I don’t want to go with the AUDUSD move post-RBA because we’re about to focus back on the USA again.
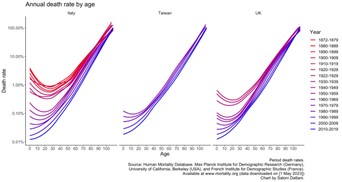
Death rates plotted by age
used to show a j-shaped
curve but are becoming
straighter lines as infant
mortality falls dramatically.
Good news!

I don’t want to go with the AUDUSD move post-RBA because we’re about to focus back on the USA again.
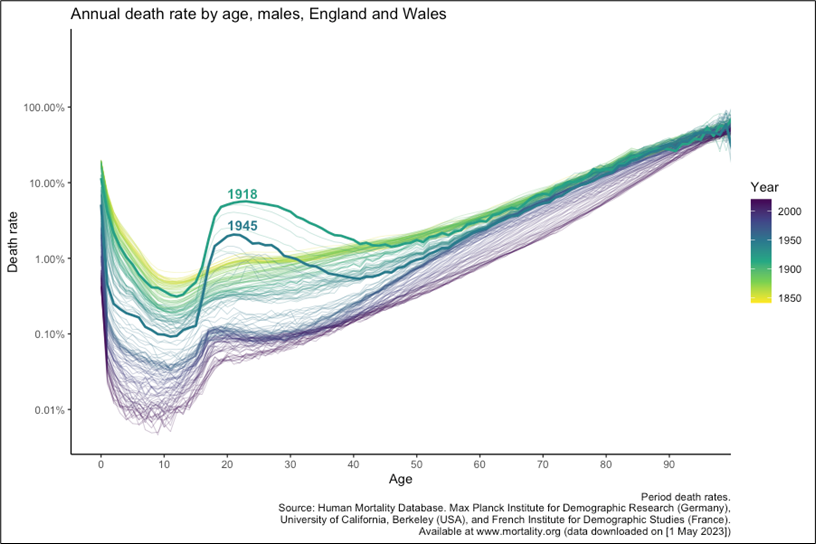
Death rates plotted by age
used to show a j-shaped
curve but are becoming
straighter lines as infant
mortality falls dramatically.
Good news!
20JUN USDCHF
0.8850 digital put @ 20%
spot ref. 0.9275
May 2, 2023
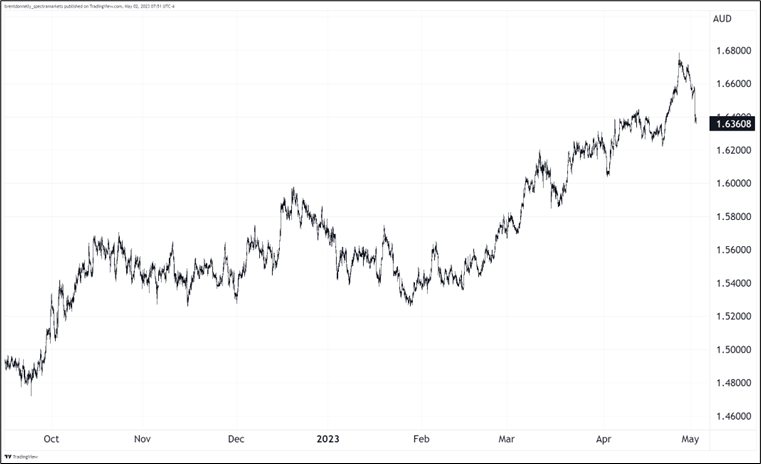
Well, the RBA hiked and while you can barely even see in on the hourly AUDUSD chart, it is at least a step in the right direction for the currency as it has been unable to celebrate the China reopening due to super-loose RBA policy (and other factors).
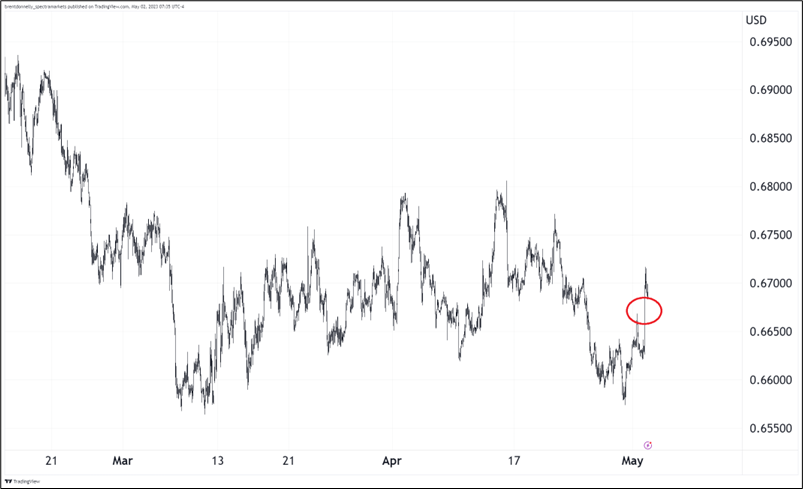
I am not particularly excited to go with AUDUSD on the rate hike here as Asian stocks have lost their momentum and copper is going nowhere for now. When you read discussions of the China reopening these days, it almost feels like the market is starting to look through it and see weakness again on the other side. Or at least something less obviously raging bullish and totally unlike the revenge spending by Americans in 2021.
It’s also hard to get excited about Oz with stocks near the massive resistance band that runs all the way from 4200 to 4300 in SPX. So I’m leaving it alone. If you are thinking this is a turning point for Oz, short EURAUD probably makes sense given how much and how steadily it has rallied in recent months.
Also, we are about to get a deluge of US data (and the FOMC meeting), so the focus is going to quickly turn back to the USA. Here is how June 2023 pricing has evolved over the last year:
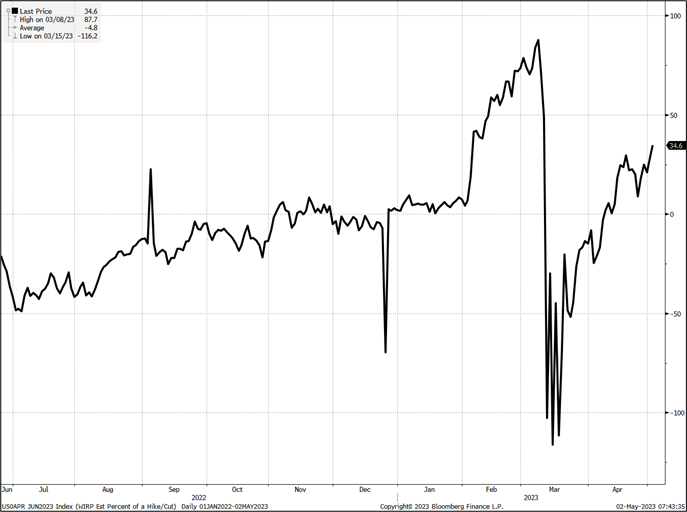
We had nearly a 100% chance of a June hike priced before Silicon Valley Bank imploded, then 100% chance of a cut soon after. Now, we are crawling back towards the hike side of the ledger again. Right now, interest rate markets have a 34% chance of a Fed hike priced in for June.
It’s worth noting that after the VAR shock in March, it’s become much more difficult for speculators to receive rates in the front end as liquidity broke, and risk limits got reset smaller after the carnage. This says to me that pricing is probably not that efficient and that’s why there are more cuts priced in than basically anybody in the world actually expects. It’s not just about risk premium, I don’t think. It’s also about the market being a tad broken.
Yesterday’s ISM, along with the tone of corporate earnings over the last few weeks, makes it feel like the big collapse in the US economy has been delayed a few more months. We will keep expecting the big collapse, but the timing will keep getting pushed out by 3-6 months until the wave finally hits shore (or doesn’t). Tighter lending standards, falling deposits, and more Fed rate hikes will hit the economy with fiendishly hard-to-estimate lags and the current run of data is telling us that recessionistas are still either early or wrong or both.
I am surprised that markets don’t care much about the CBO and Yellen’s comments on the debt ceiling X-date yesterday (she said the X-date could be early June) … but perhaps the market is just reading the comments as political posturing. Or maybe the market just can’t bring itself to take this seriously anymore.
Finally: I received emails correcting my Spanish in the am/FX title yesterday, but the title was in Esperanto, not Spanish.
Have a vital day.
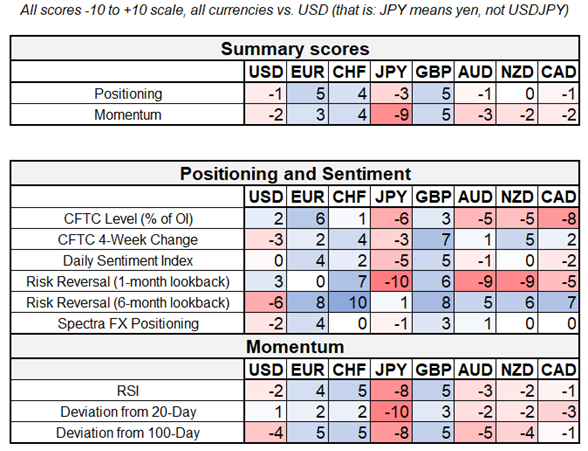
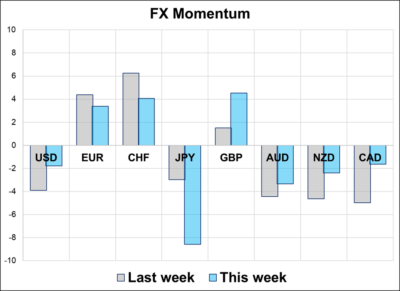
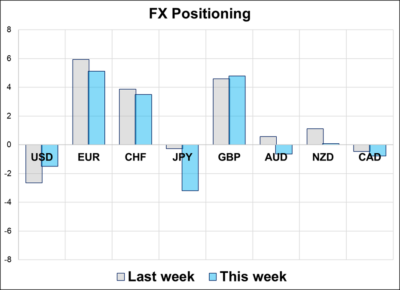
EURUSD positioning seems to have capped progress to some extent, though we have also seen stronger US data, weaker German CPI, and a meaningful contraction in Germany/US rate spreads so perhaps the triple top at 1.1075 in EURUSD is more about mean reversion in the data, not speculators exiting positions. Or maybe a bit of both. With BOJ out of the way, USDJPY is doing its best impression of GameStop circa March 2021. To infinity, and beyond. All five positioning metrics showed accumulation of GBP this week; a 5-for-5 sweep is a rarity.
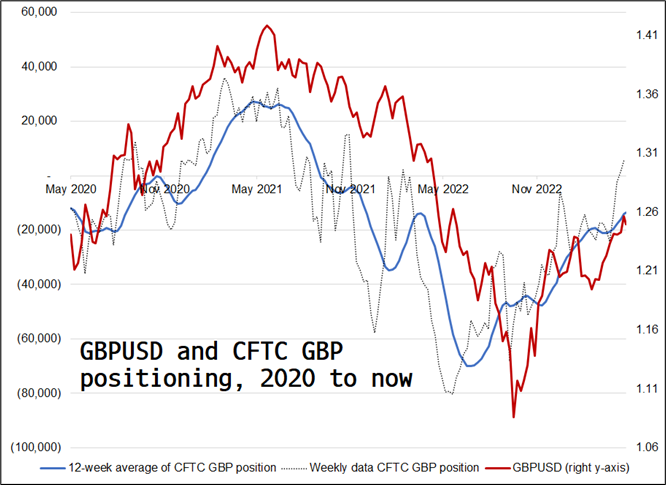
1. “Sentiment follows price” is a common nugget ‘O wisdom you hear on trading floors, so it’s worth noting the exact opposite has happened with GBPUSD of late. In fact, there are many times when positioning and sentiment lead price and the divergence between price and positioning can be informative.
GBP positioning, for example, turned before price at both the highs in mid-2021 and the lows in Q3 2022 (see chart). This information isn’t actionable after the fact, but it’s worth staying on high alert in future for other examples of this. It has worked many times over the years in EURUSD, too, where positioning turns, and price follows.
2. JPY momentum is extreme at -9 (in other words, USDJPY momentum is +9). Justin looked back at the other times when this happened, and the signal is unambiguously not contrarian. The hit rate on going long USDJPY at an extreme of +9 or +10 for USDJPY momentum is only 50/50, but 60 days later the average returns is -2.25% on losing trades and +6.68% on the winners. Here’s a graphical version, which I thought was neat because you can see the regimes like Abenomics 2013 and 2015, and Fed hike-o-rama with oil terms of trade shock 2022.
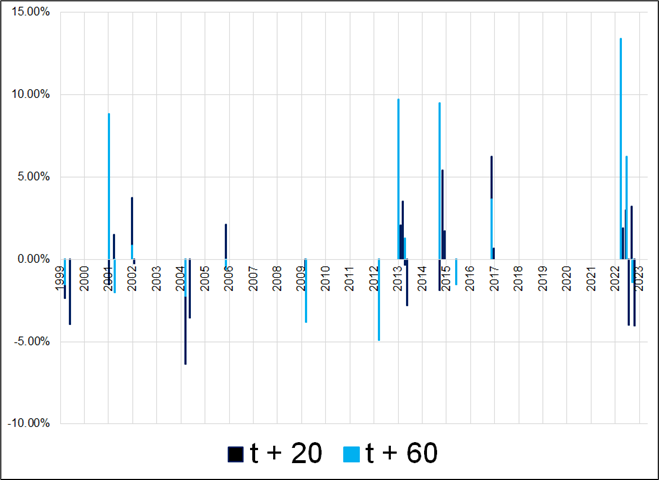
i.e., you go long, even though it’s overbought
I will leave it to you to make an assessment of the current regime when considering whether USDJPY might mean revert or not. Positioning and momentum data below:
That’s this week’s report. Thank you for reading.


This piece is mostly for people who are interested in backtesting