
Going through a few reasons I was wrong on AUD and looking at a few other bits and pieces.
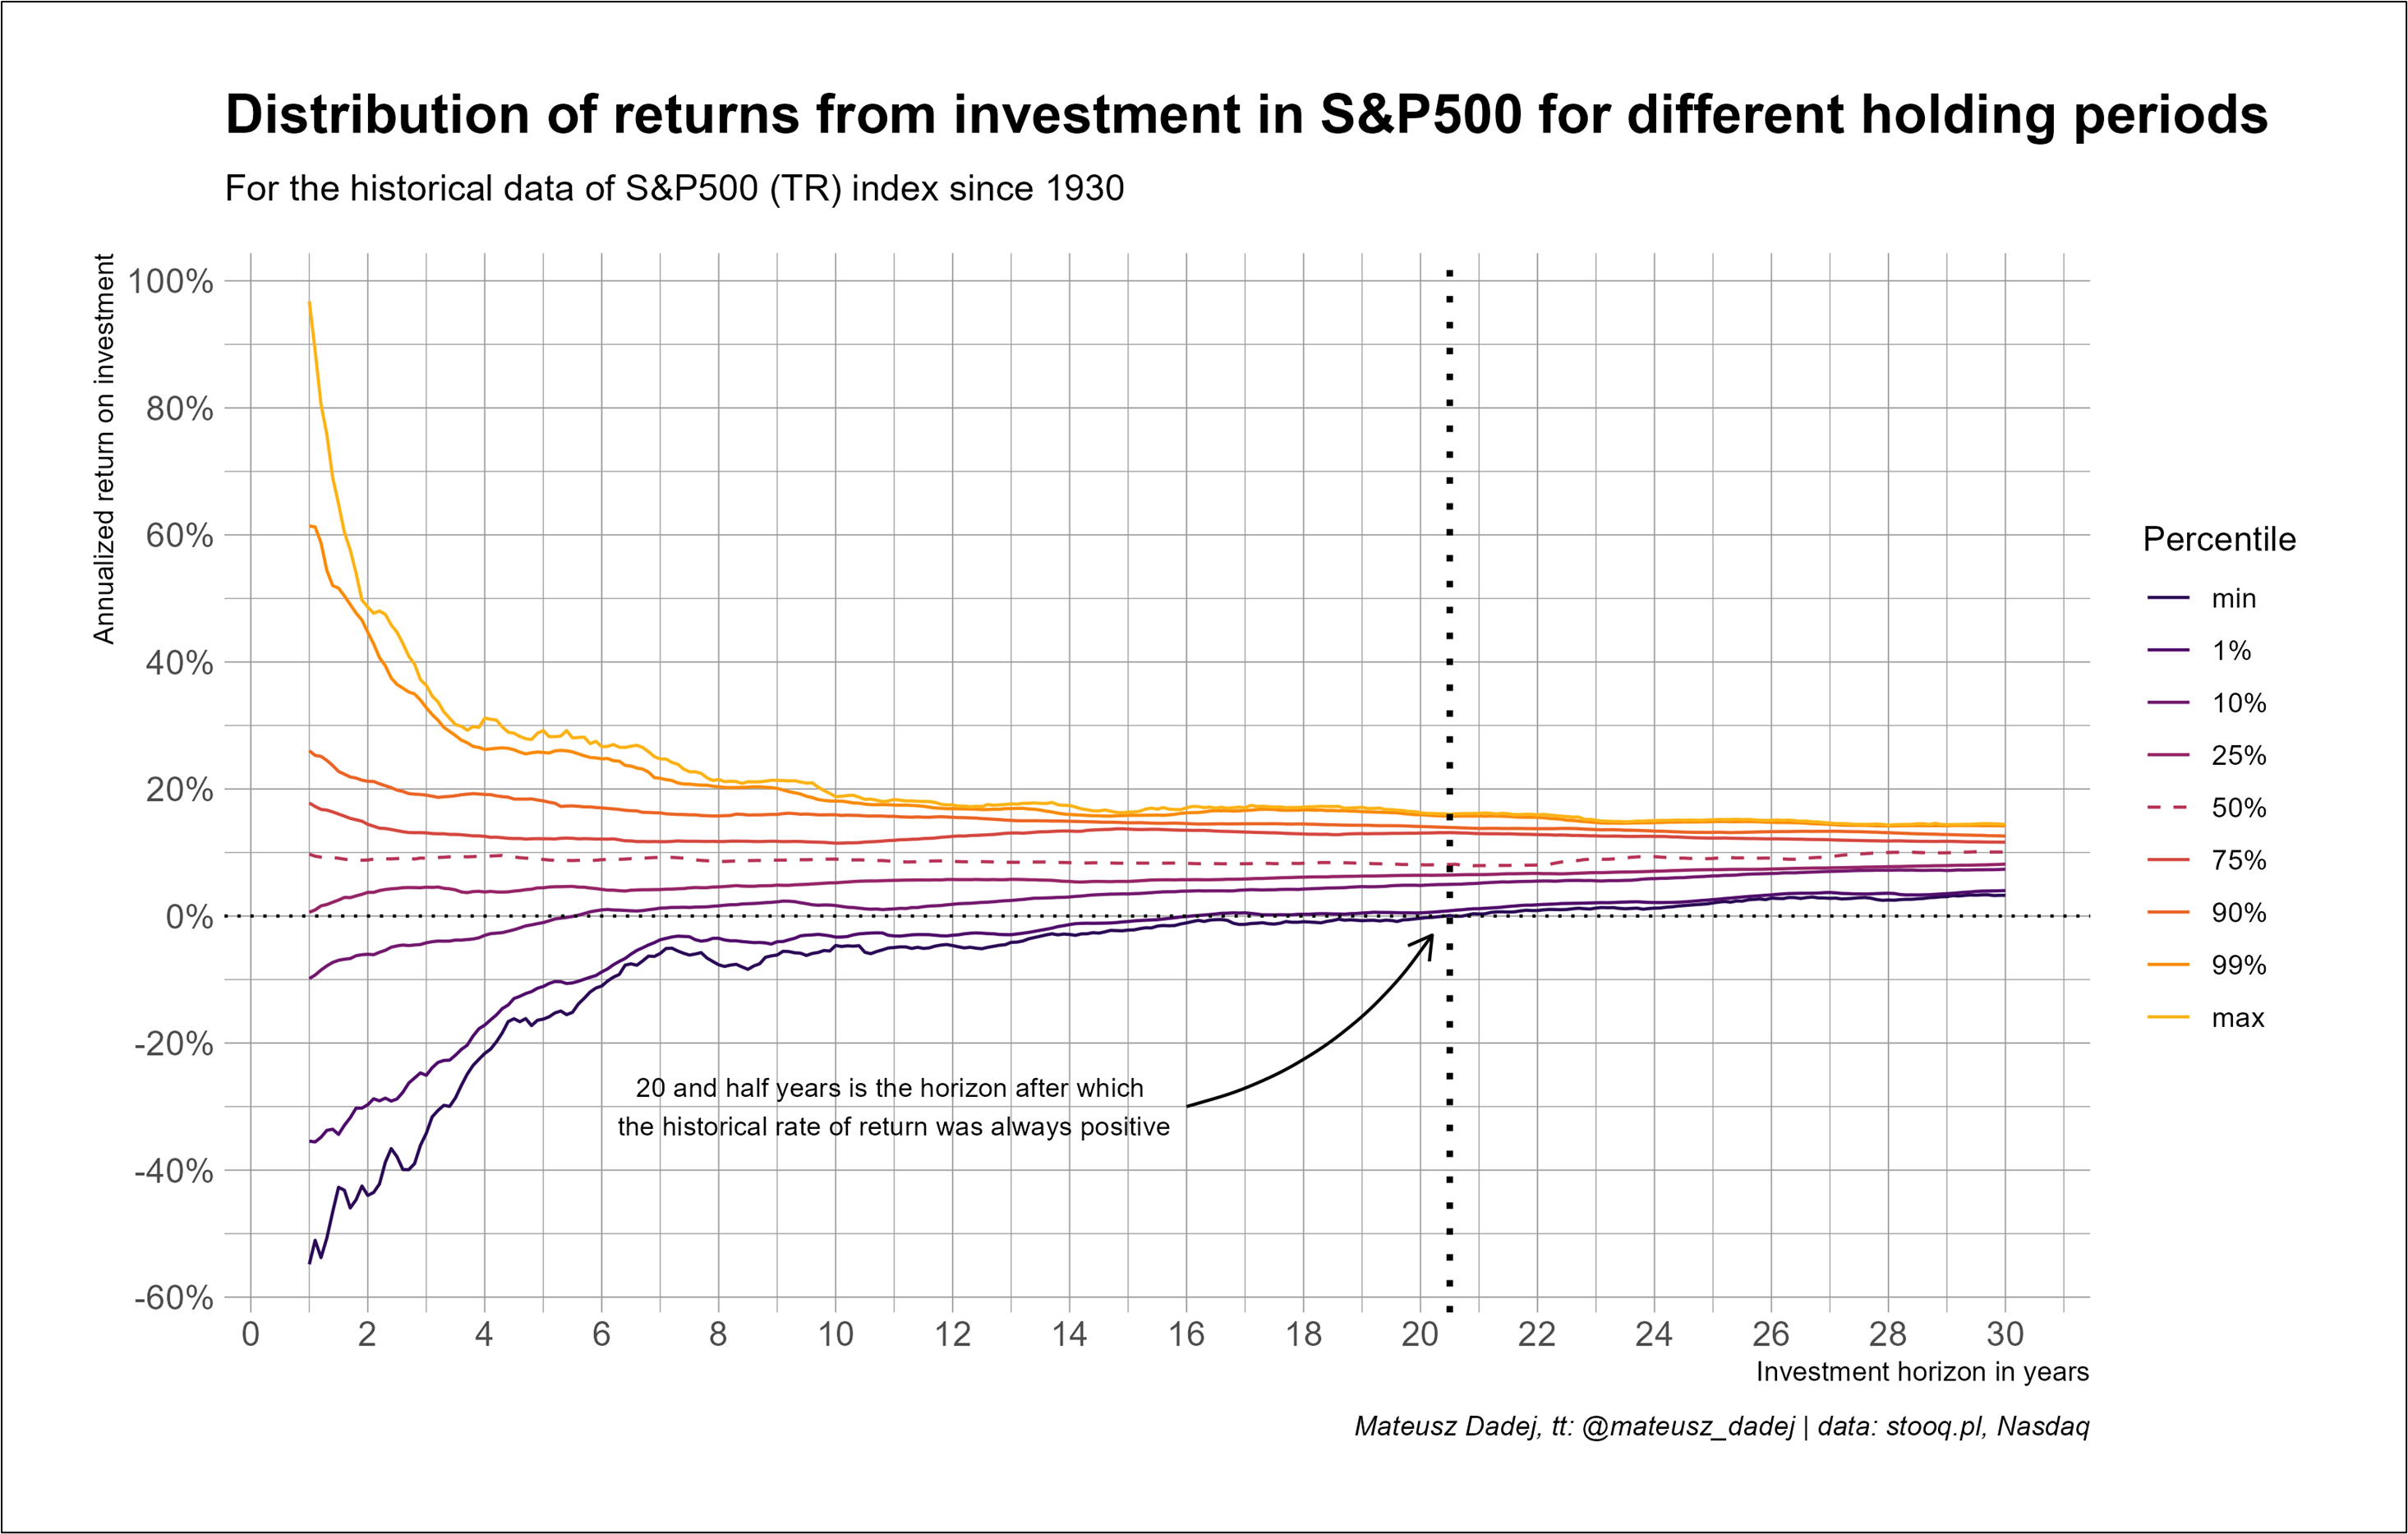
Total return of S&P 500, by holding period.
Larger version at the end of am/FX

Going through a few reasons I was wrong on AUD and looking at a few other bits and pieces.
Total return of S&P 500, by holding period.
Larger version at the end of am/FX
Short CADJPY at 108.90
Stop loss 110.26
Long 10DEC EURMXN
18.70/18.20 put spread
~50bps EUR
off 19.16 spot
November 7, 2023
My 2-day AUDUSD calls are worthless. Sometimes trading outcomes are an output like: good decision / bad outcome, and you move on. But in this case maybe it’s worth going through what I missed or how my framework was wrong. Because this feels more like bad decision / bad outcome.
1. The RBA delivered the hike but given how late cycle we are, it’s very hard to find hawkish central bank outcomes these days. To quote BofA: Global central banks “now cutting rates at fastest pace since Aug’20 (30 cuts in 3 months) ..” [Hartnett] via CNBC. It’s hard to find a hawkish central bank these days and I overestimated the RBA’s willingness to play catch up.
2. The USD is a beast. Yields are lower, and yet the dollar is higher. It’s confusing. The other day, Kanda was arguing that FX does not reflect fundamentals, and while the BOJ is obviously responsible for USDJPY at 150, on a zoomed in look, USDJPY looks kind of nuts up here and Kanda is probably logged on to the MOF remote server, white knuckling. Overall, my view on the USD is that this is a wipeout of the first round of USD shorts and I still lean bearish USD given yields, cooling US data, and the late cycle setup for the Fed.
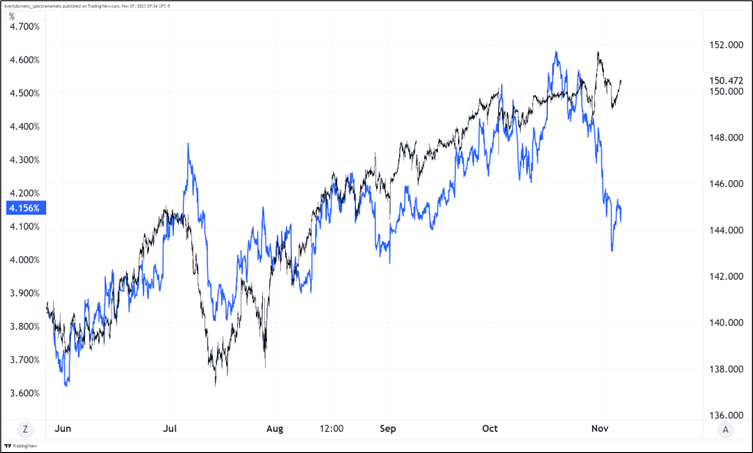
3. Fast money positioning into the event was meaningful as there was a ton of adding of short-term AUDUSD topside yesterday.
A bad trade.
Waller today could be interesting. At 10 a.m. NY he speaks about “Using economic data to understand the economy.” This is a good topic as our understanding of the economy over the last few years has been pretty bad and most explanations have come ex-ante not ex-post. I really like Waller and find he’s one of the more useful Fed speakers for those wanting to understand the direction of travel of Fed intellectual energy and policy.
The Fed story has settled into a kind of equilibrium here with very little priced out to May 2024 and then the usual series of probabilistic rate cuts. These rate cuts further out don’t have much predictive value as there have been cuts priced starting about six months out for ages. If you look at the pricing a year ago, there were cuts priced starting in July 2023. This is a permanent feature of a world where the curve is inverted and the future outlook is always grim, regardless of present conditions.
Apollo’s Chief Economist Torsten Slok publishes a daily which is bite-sized and always offers some compelling factoids. He wrote the following this morning:
Hiring for the holiday season is generally done in October, and adding up new jobs created in the BLS-defined holiday season retail sectors in the latest employment report shows that retailers expect a weaker holiday season, see chart below. This soft outlook is consistent with growing inventories at many retailers. The BLS defines holiday sectors as furniture, electronics, personal care, clothing, sporting goods, general merchandise stores, miscellaneous store retailers (e.g., florists, office supply stores, gift shops, and pet shops), and non-store retailers (e.g., online shopping and mail-order houses, vending machine operators, and direct store establishments).
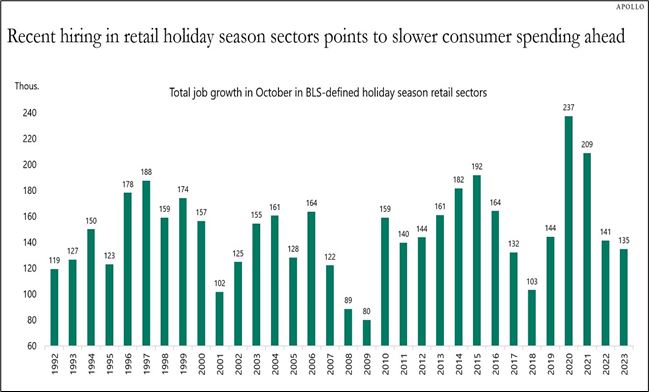
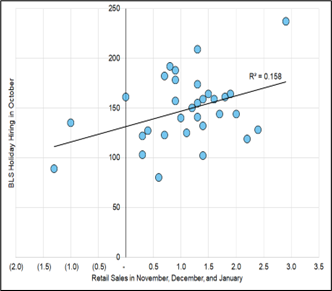
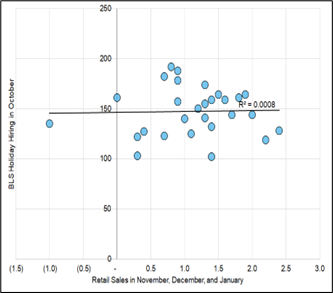
This is something to watch as we get Retail Sales over the next few months. Below I have created two scatter plots of BLS holiday hiring and Retail Sales for November, December, and January of the same year. There appears to be some connection.
Unfortunately, if you remove the four outliers (2008, 2009, 2020, and 2021), the relationship disappears, so it really depends on how hard you think the current economy is coming down off the fiscal high. In other words, in an economy that isn’t cratering or going to the moon, the holiday hiring numbers are mid-range and don’t contain much information. In a booming or rapidly-contracting economy, there is a signal. Feels like noise to me for now, but definitely something to watch!
All data 1992 to now
Removing the 08, 09, 20, and 21 outliers
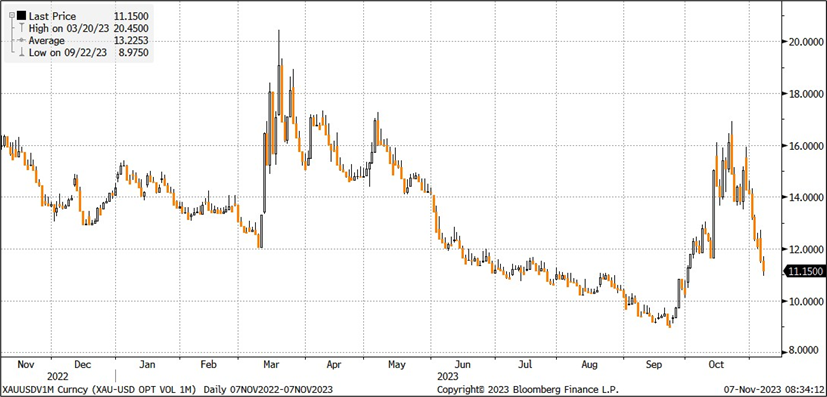
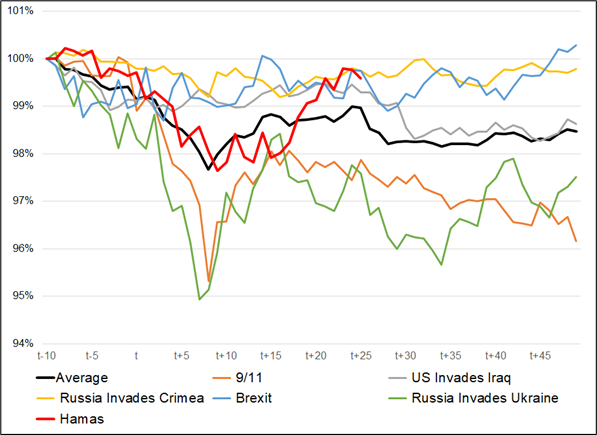
Dave sent me this graph of 1-month gold volatility. It’s very hard to make money trading war as the market’s interest fades so quickly. We saw this with Russia / Ukraine (oil and wheat both topped within 10 trading days of the invasion and went straight down). This lines up with the analysis I showed a few weeks ago where the half-life of the big market reaction to geopolitical events tends to be about 10 trading days.
Here’s that chart for EURCHF updated. I suppose you could say the reversal in EURCHF predicted the reversal in gold?
Have a profitable day.
The Spectra FX Positioning and Momentum Report
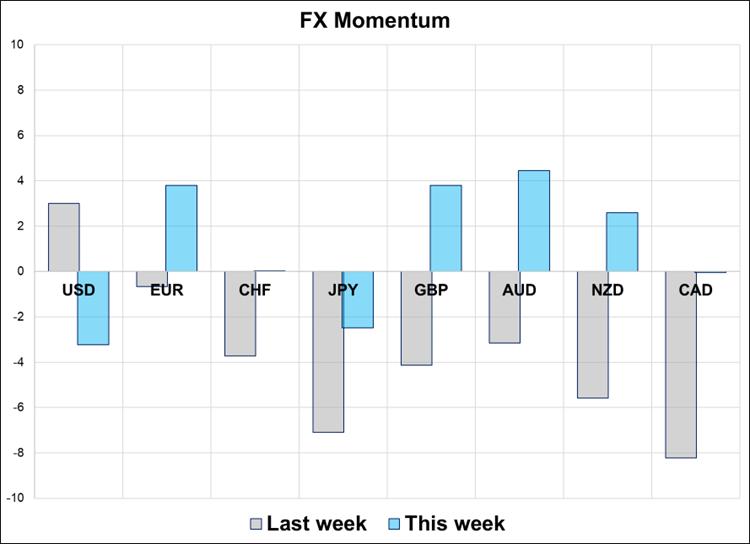
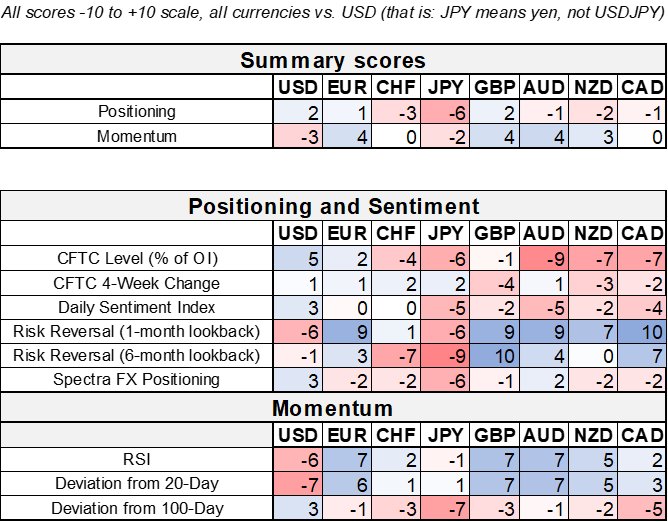
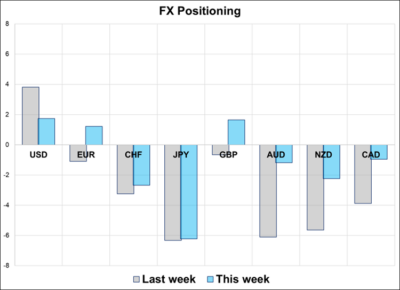
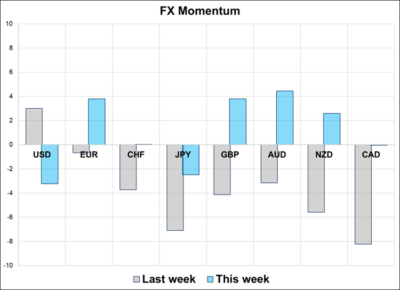
Hi. Welcome to this week’s report. We have seen a huge turn in USD momentum as the discretionary market’s preferred direction always seems to be short USD and a huge buildup of USD longs from CTAs and carry strategies is under pressure. Spec USD long positioning has been reduced significantly, especially in AUD and NZD, but the CFTC remains heavily short both those currencies. GBP has found significant topside momentum as the overhang of CFTC longs was finally cleared out in recent weeks. It’s still nowhere close to overbought, though.
1. In retrospect, the observation in the 16OCT positioning report that showed USD longs at an all-time high and the DXY RSI over 70 was good. That said, there was another two weeks of chop as the market pressed USD longs on rising yields. The dollar held in and in the end, the change in the Treasury’s funding mix (and a bit too much fanfare around the QRA) helped risk assets and the USD turn a corner. I acknowledge this was a difficult turn to catch; only pointing this out for future reference. The measure of extreme USD longs was a good indicator.
2. USDJPY remains the most bullish position out there. In am/FX, I have been writing about the large divergence between yields and X/JPY and most of the feedback I have received from clients has been negative. This is another indication of positioning—it shows people are ignoring yields and staying bullish things like USDJPY and GBPJPY despite the big loosening in rates. Divergences don’t always close, they’re just one part of the toolbox, but the positioning and the feedback to my bearish cross/JPY views are both saying the same thing:
The market is short yen.
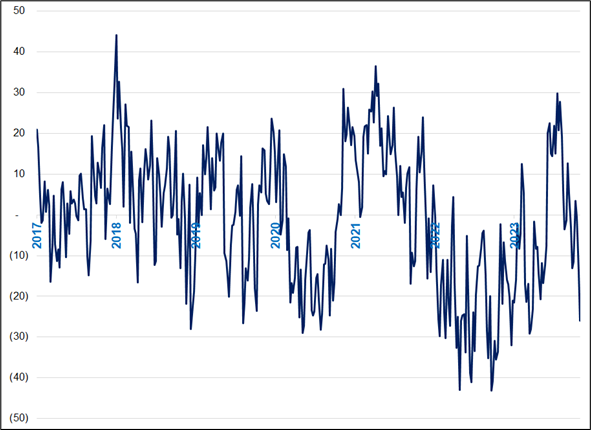
3. On November 2, even after stocks had rallied well off their lows, AAII sentiment printed down in deep bear market levels. The drop shows how rapidly the repricing of US long-end yields impacted sentiment in stocks. So while bullish Q4 equity seasonality was drowned out by bullish positioning and skyrocketing UST yields in October, positioning is now clean or bearish, and yields have stabilized on a strong signal from the US government.
—
That’s this week’s report. Thank you for reading.


This piece is mostly for people who are interested in backtesting

