
Oversold metrics in stocks, blowoff tops in yields, positive seasonality, and footprints in the sand.
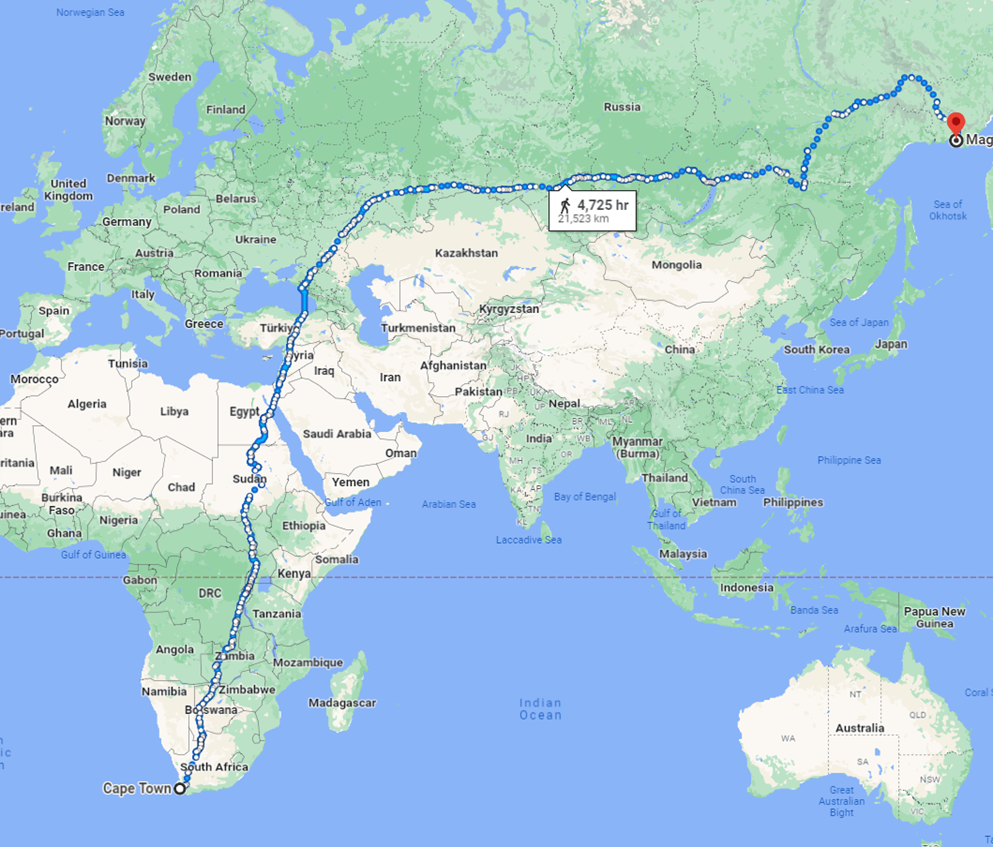
The longest walkable distance in the world is 21,523 km from Magadan, Russia to Cape Town, South Africa
Nobody has done it. Yet.

Oversold metrics in stocks, blowoff tops in yields, positive seasonality, and footprints in the sand.
The longest walkable distance in the world is 21,523 km from Magadan, Russia to Cape Town, South Africa
Nobody has done it. Yet.
Go short USDJPY at 150.09
(limit order)
Stop loss 152.26
Take profit 146.57
October 4, 2023
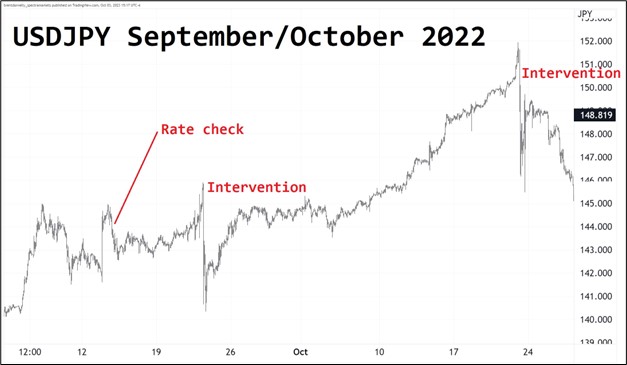
It is unconfirmed but highly likely yesterday’s dump in USDJPY followed an MOF rate check. MOF did a rate check on 14SEP22 and USDJPY moved lower by about 170 pips but kind of in slow motion. It dropped 145 to 142.60 in that wave and when it made a new high to 146.00, they slammed it to 140.50.
The next intervention was from 151.80 to 146.00. Based on that playbook, next time we peek above 150.00, they will sell it and it will go down to the 145/146 area. It makes sense to get short at 150.09 with a stop at 152.26. I’m putting that in the sidebar.
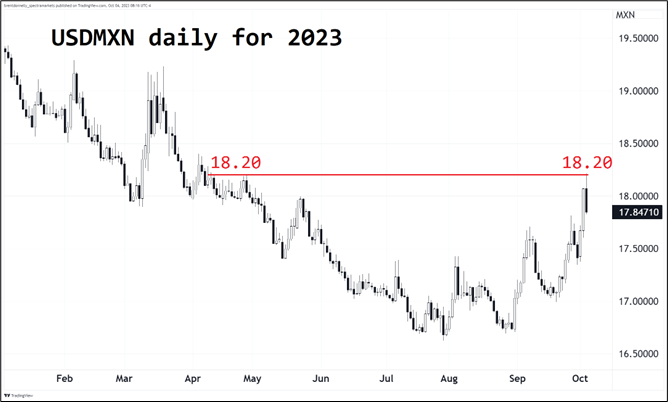
Meanwhile yields and EM look like blowoff tops. Here is USDMXN, for example:
This move in yields has been a serious momentum trade, so any evidence of a momentum reversal is worth paying attention to. There is still ISM and NFP to get contend with, though, so I would keep an eye on closing levels of yields for confirmation or rejection of the idea that the overnight highs in yields are some sort of important extreme and significant reference point.
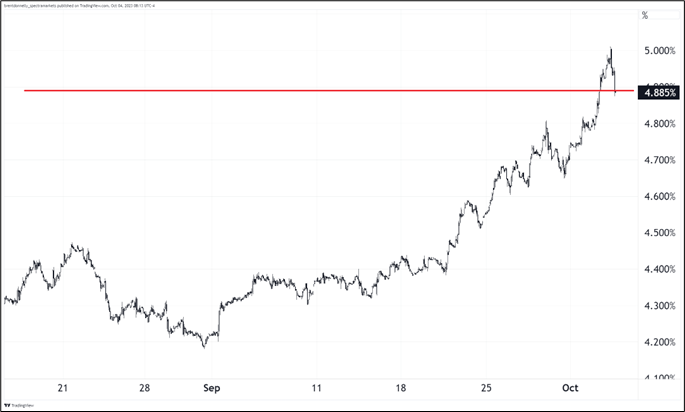
Looking at US 30-year yields, there was a massive quadruple top in the 2008/2010 period as you can see here:
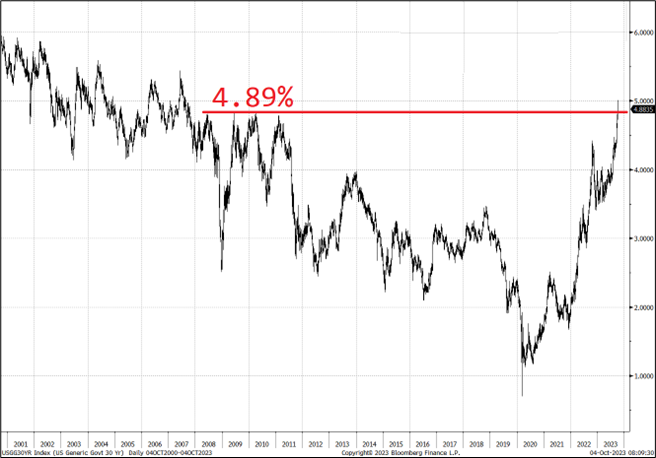
The hourly chart shows that we traded 5.0% and are now right at that red line (4.89%). A close below, say, 4.85% or so would be a slingshot reversal in the 30-year yield and may put a short-term end to the Armageddon trade.
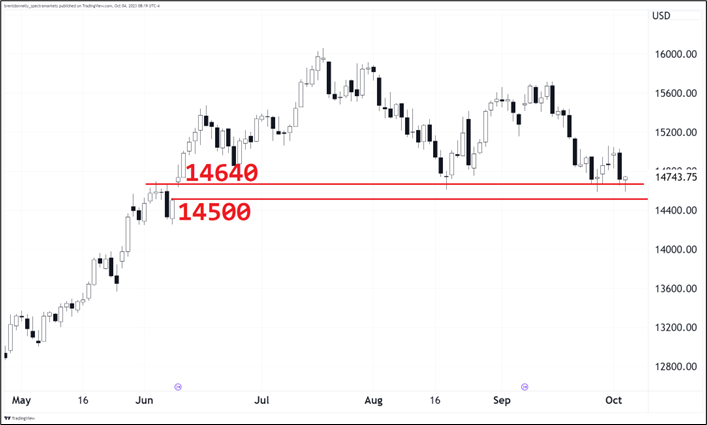
And stocks are making bull hammers everywhere as the NASDAQ continues to trade well on each probe of the June 14500/14640 gap. Here’s the NASDAQ chart:
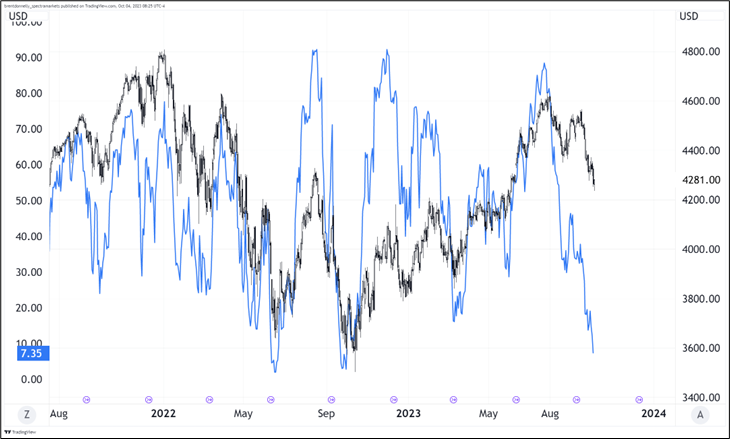
Adding to the odds of a reversal across the board is that just 7.35% of S&P 500 stocks are above their 50-day moving average now. That’s a condition that has seen large bounces in the past. The closer we get to 09OCT (the seasonal low for equities), the more likely a reversal in stocks off oversold levels. The next chart shows the occasions when that metric went below 10 over the past couple of years. The only other moments in the past 10 years when the % of stocks above the 50-day number was <10 were: March 2020, December 2018, January 2016, and August 2015. Those were all epic buying opportunities.
The kind-of-breathtaking moves in treasury yields make it highly doubtful that the Fed will hike in November, I think. They are getting plenty of tightening now from multiple directions and with policy already in restrictive territory I would bet November pricing (was 30%, now 20%) should be closer to zero than 50.
Markets are setting up for an end of year rally. Given the impulsive moves in yields, and what looks like a persistent supply vs. demand imbalance in treasuries, the bottoming process could continue to be choppy and messy. But I do believe that a month from now, bears will be sad, and bulls will be glad. Maybe time to get short USDCAD. A very tight, but reasonable stop is 1.3766. Or long NQ with a stop at 14355.
Key levels on a closing basis:
Hope you get a chance to take a long walk today. Speaking of long walks: I’m not religious, per se, but this gave me goosebumps the first time I read it:
https://www.geneseo.edu/~heap/footprints.html
Nobody has done it. Yet.
Here’s why it’s hard but maybe not impossible
https://globalrescue.com/common/blog/detail/debunking-the-longest-walkable-road-in-the-world/


This piece is mostly for people who are interested in backtesting

