Not everyone trusts that Sam can find a trillion dollars lying around
Hello. It’s Friday. Thanks for signing up. I’m Brent Donnelly.
The About Page for Friday Speedrun is here.

Not everyone trusts that Sam can find a trillion dollars lying around
Hello. It’s Friday. Thanks for signing up. I’m Brent Donnelly.
The About Page for Friday Speedrun is here.
Here’s what you need to know about markets and macro this week
It has been quite a week. The market is unwinding some of its most optimistic assumptions and the raging momentum trade that dominated dozens of assets has run out of gas. Gold and silver peaked first, then RGTI and the most-shorted / least-profitable stocks, and finally the AI favorites, Korea, and Japan. Momentum trades printed money for hedge funds, CTAs and retail for several months, and the market back-fitted narratives to try to justify them (it’s a DeBAseMenT trade!) In reality, GLD calls from retail drove the last $300 of the rally in gold, FOMO drove the ridiculous rally in ORCL, and the jury is still out on whether Sam Altman is Elon Musk or SBF.
I think a critical moment was the release of META earnings on October 29. This is not hindsight, I wrote about it on October 30 in am/FX and held it up as a clear red flag for the AI trade. This is not to flex—it’s just important—and I didn’t write Friday Speedrun last week because I was in Toronto watching Game 6 at the Rogers Centre (sad face emoji). Here’s what I wrote 30OCT:
—
excerpt
There was a time, about 5 months ago, when bragging about how nuts you’re going on capex was bullish.
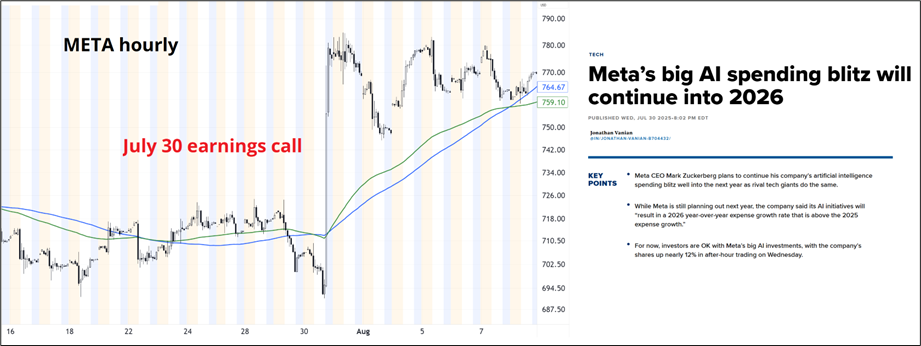
The bottom two bullets from that CNBC article are:
“For now” was the key. Last night, META said essentially the same thing (2026 expenses will be high due to capex) and got a different result from the stock market.
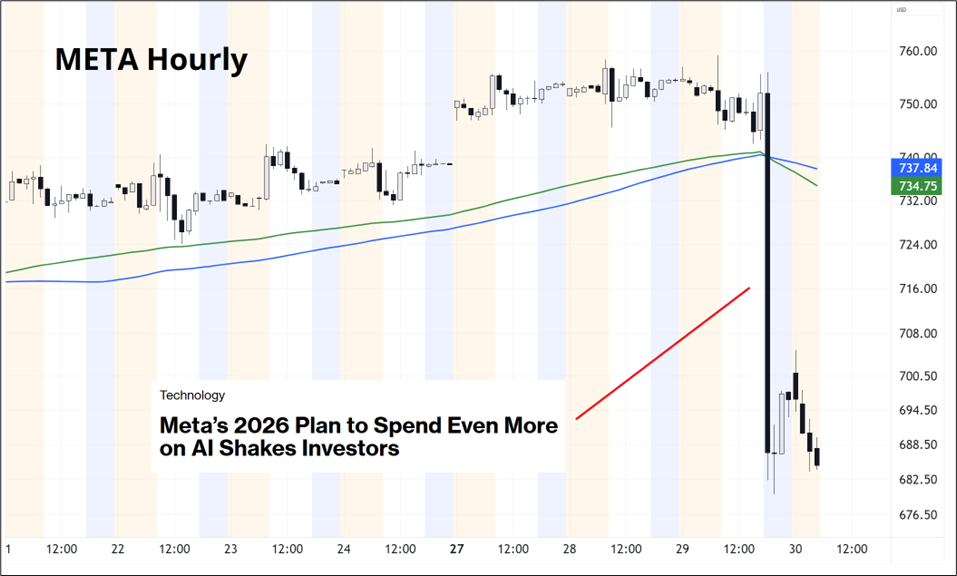
This is a big deal! The market is starting to show some impatience on the realization that $1.5T in capital spending (or whatever the number is) might not yield the revenues to generate pay back. You may have noticed that many tech firms have been making forecasts all the way out to 2030 of late, and I think this is another red flag. Management is starting to feel a bit of heat to show some kind of payoff, but there will be no payoff on any reasonable time horizon and therefore they have been forced to zoom out. Way the heck out.
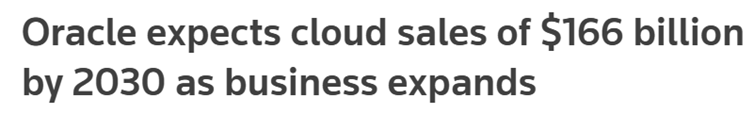
I could be wrong, but I don’t remember firms in 2018 throwing out 2023 forecasts or firms in 2006 forecasting revenue for 2011. It feels a bit desperate to me. This chart from the Sparkline piece resonates:
Exhibit 7
Rising Capex Firms Underperform
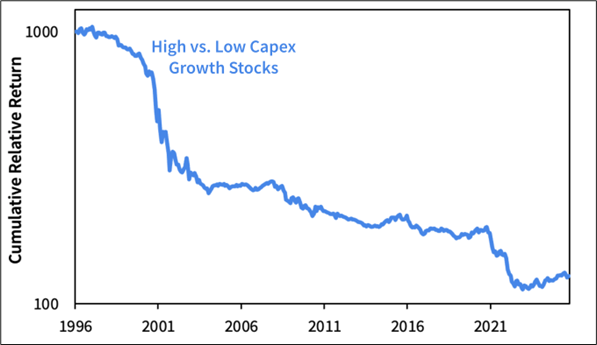
Common knowledge says that you want to be long during a bubble and that stocks only go up and you should buy every dip in the stock market, and this has been correct for 17 years, pretty much. But in the short run, there is a ton of weird stuff going on. The record-low breadth, weakness in crypto, poor response of META to moar capex, and a Fed that maybe isn’t on autopilot anymore all make me cautious, and I am selectively shorting the stocks that I think are least attractive or most overblown. ORCL (see rising CDS there, too), CRWV, and NVDA all look like fair candidates to take a shot from the short side over the next few weeks. ORCL specifically looks to me like it wants to make a round trip…
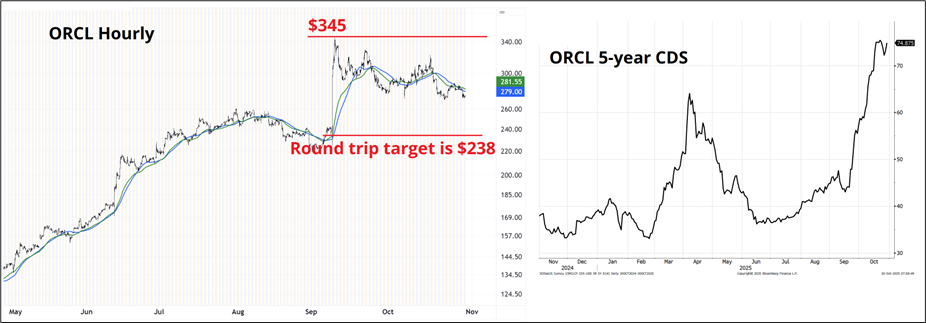
You can make money both long and short during a boom. The corrections are vicious. I am generally not a fan of buying puts because you can get just as much leverage with outright shorts and you don’t decay. If ORCL goes above $300 or NVDA breaks $221, my gut is wrong here and I will move on with my life. I will never sit here bearish for weeks on end unless the trades are in the money. Opportunistic and tactical shots like this can work out, even if we are ultimately still in a bull market. I am not a professional equity analyst, and my views should be taken as ideas for your own assessment, not investment advice. Trade your own view.
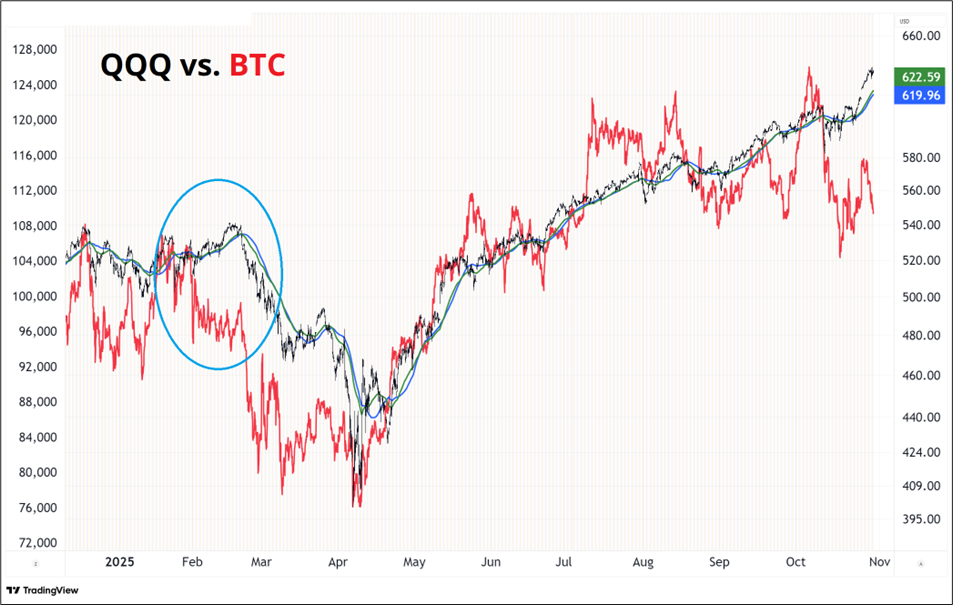
I mentioned the crypto thing, and you might recall this happened in February. Crypto turned lower while QQQ kept chugging. Crypto was the leader (see cyan oval).
end of excerpt
—
Since October 30, ORCL has completed its round trip and is all the way back to where it was before that ridiculous MOU was signed and it rallied 40%. CRWV has gone from 135 to 105. NVDA 203 to 187. Crypto showed the way in February and it continues to show the way. If you want this sort of stuff in real time, subscribe to am/FX!
The issue now is that the market is finally asking questions about AI payback and the answers are not at all convincing. Sam Altman, when asked about how he could possibly justify a $1.1T spend on just $20B of revenue, basically told the interviewer to pound sand and for investors to eff off and short the imaginary stock of OpenAI if they don’t like the vision.
This is the kind of stuff you don’t love to see if you are long AI. It’s a bit reminiscent of Jeff Skilling calling Richard Grubman an asshole on an Enron earnings call after Grubman pressed him on Enron’s balance sheet. I’m not saying OpenAI is a fraud, it’s just that a corporate leader giving off angry, nervous vibes when asked a rudimentary question about business viability is not a good look.
You can add on Satya Nadella’s comments:
And the tremendous backlash to OpenAI’s CFO claiming that the US government should subsidize their borrowing because AI is strategic. It gives off the impression that the AI vision is so grandiose and expensive that the private sector can’t possibly handle it.
And you can also add the fact that AI spending is no longer coming out of free cash flow. Oracle, META, and others are doing massive bond issuance to fund the splurge.
The narrative flip was gradual, but it’s gaining steam. It’s a concern because the entire k-shaped US economy rests on the back of AI capex and its procyclical impact on earnings, stock prices, and the wealth effect.
Meanwhile, the U.S. data desert has no end, and traders and economists are thirsty for data. This has driven analysts, including me, to dig into data that would normally go unremarked. Specifically, Challenger and Gray report a layoff number once per month and while it grabs the odd headline, nobody really cares about it much because there is always a massive base effect leading to meaningless year over year numbers. But given the headline number is useless, I decided to dig up more details. Here’s what I found.
In this chart, you can see the rolling 12-month hires minus fires, looking back over the last twenty years. It’s a decent chart that shows net hiring negative, casting a spotlight on job weakness. After manic overhiring in 2021/2022, many are now losing their jobs, according to this data. I use 12-month cumulative performance in my charts today because the data is not seasonally adjusted. If job doom is your religion, this chart is a prophecy of imminent flood.
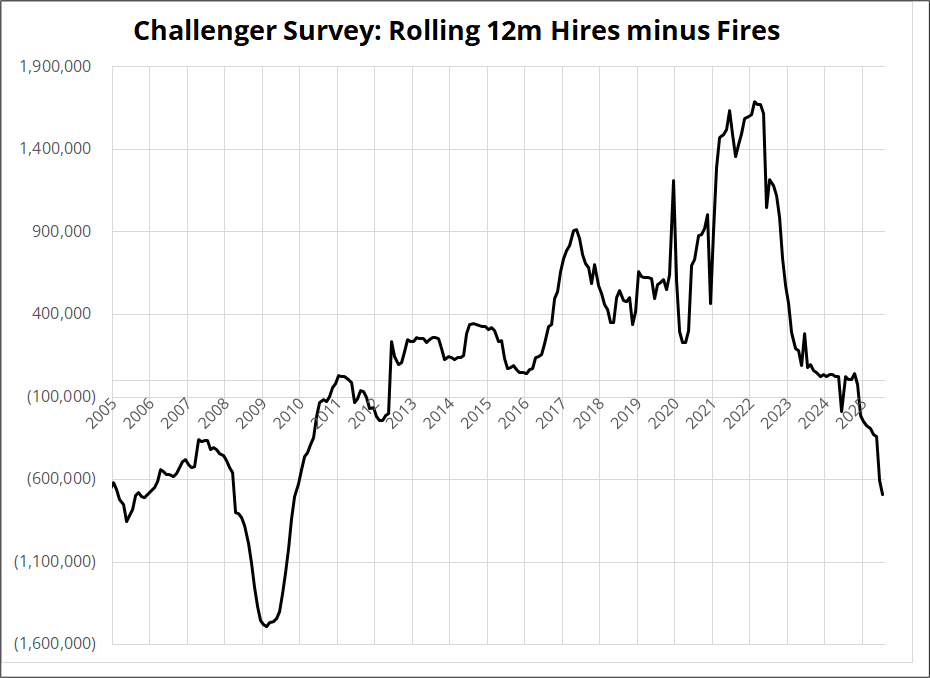
It would make sense to overlay this with the 12-month average of NFP and see how it fits. So, I did that and the chart is here. The fit is reasonable.
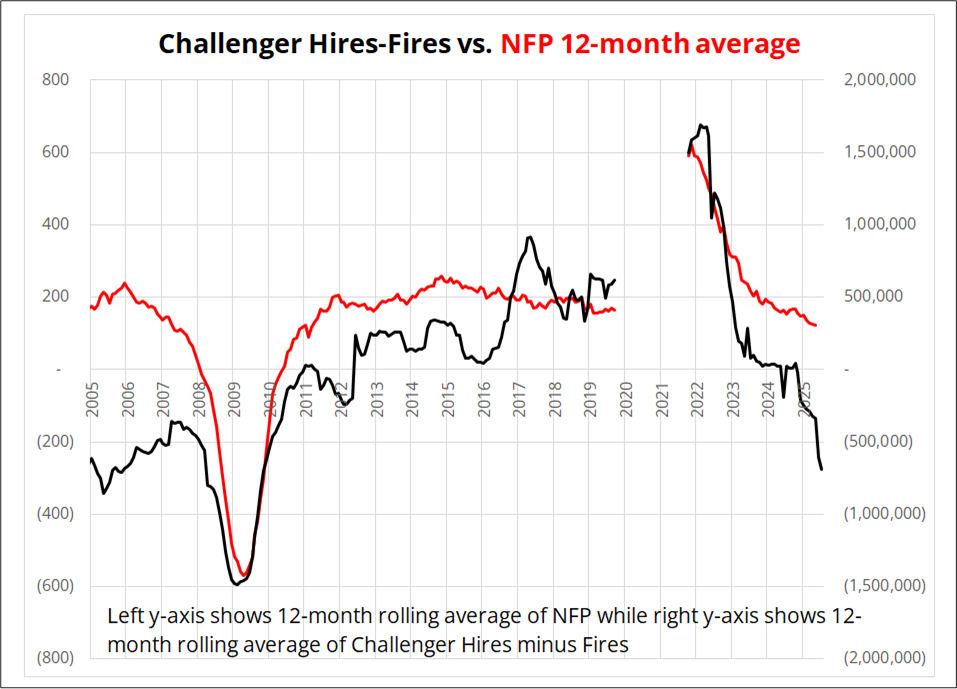
Challenger data is much noisier than NFP, and thus there’s some risk I am overhyping this. I would trust NFP much more, but we don’t have NFP. So there.
My bias is always to assume that the soft landing will continue, so I am definitely not sitting here biased, trying to find a bearish spin on this data. I just put it in the blender, and this is how it popped out. It looks pretty bad!
It’s that time of year again.
The fourth annual handbook has arrived…
The 2026 Spectra Markets Trader Handbook and Almanac is live

Use The Spectra Markets Trader Handbook and Almanac as a trading journal/day timer, and as your guide to seasonal patterns and key economic events throughout the year. It will anchor your process on proper journaling and planning—and help you thoughtfully assess your performance at the end of each month. Goals and plans written down are much more likely to come true than a flurry of ideas and thoughts and hopes swirling around in your head.
Damn unpretty for stocks as the momentum has been sucked out and the narrative has flipped from max MOMO/FOMO to skepticism. I went through a bunch of the chinks in the armor of the narrative earlier. Market reversals are often some combination of narrative exhaustion and endogenous reversal. A big red flag on the price action / microstructure side has been the post-earnings price action. I highlighted META earlier, and PLTR was the most crimson of flags as they beat and raised and the stock popped and flopped. Good news/bad price.
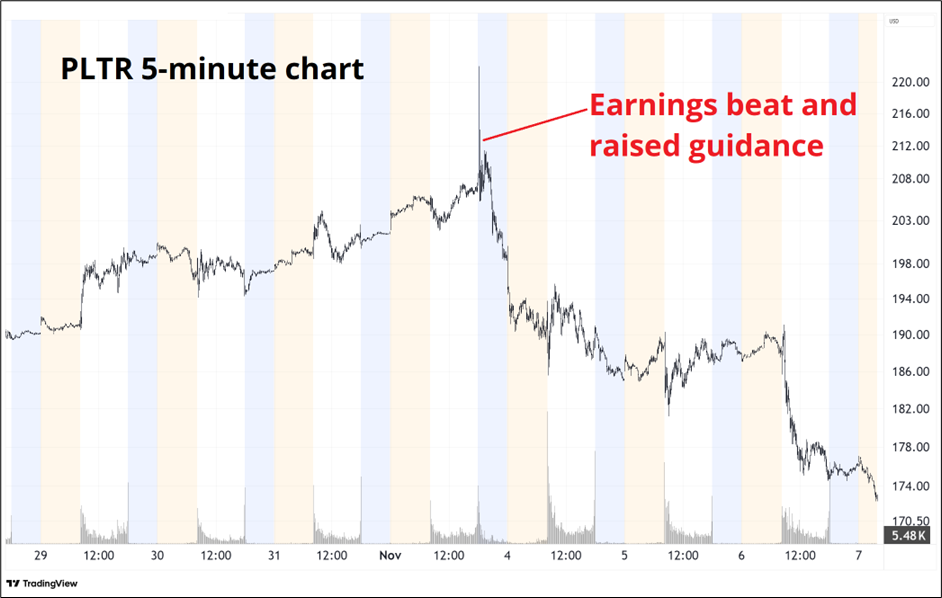
This sort of price action tells you there are no marginal buyers left in the asset. As long as crypto is heavy and momentum is weak, massive retail longs in the most meme-y of stocks like PLTR will be challenged.
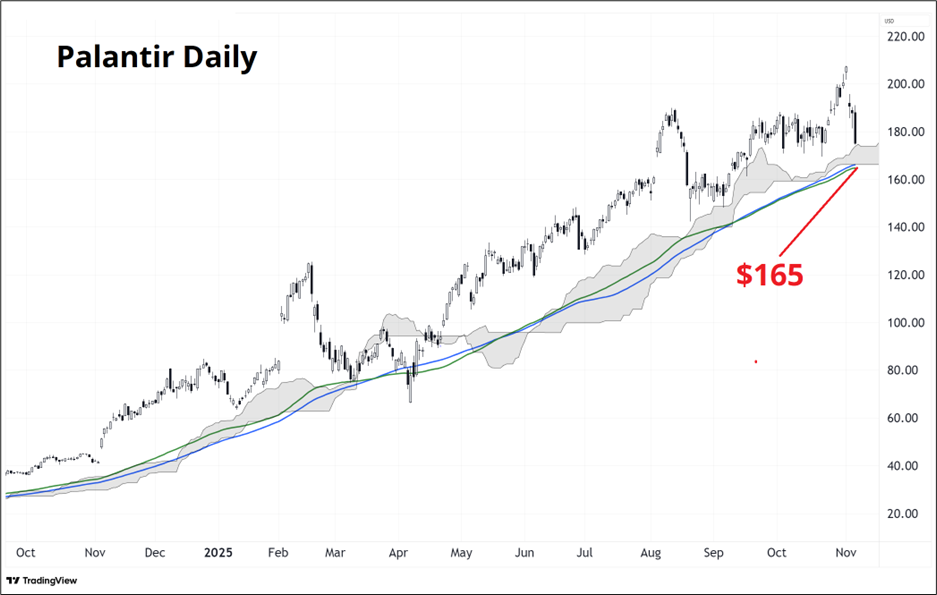
The price of PLTR needs to stay above $165. That’s where both 100-day MAs and the cloud converge.
This has been an abominable year for seasonals, and this week is no exception—the first week of November has historically been one of the best weeks of the year to own stocks. This year, not so much.
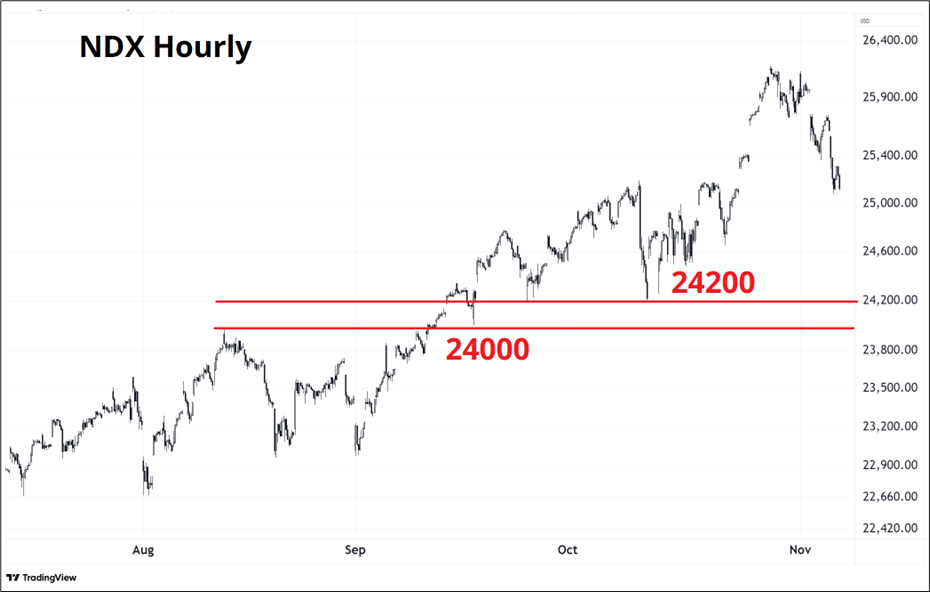
If you are bullish and you have cash lying around, 24,000/24,200 is the level to scoop in NASDAQ.
Here is this week’s 14-word stock market summary:
Questions are being asked about payback. Again, a visionary named Sam makes everyone nervous.
US 10-year yields were in a perfect narrowing and descending channel for more than five months as the market got comfortable with three more Fed cuts, but the top of that channel is now in jeopardy as Jay Powell attempted to introduce some optionality at the October 29 FOMC meeting.
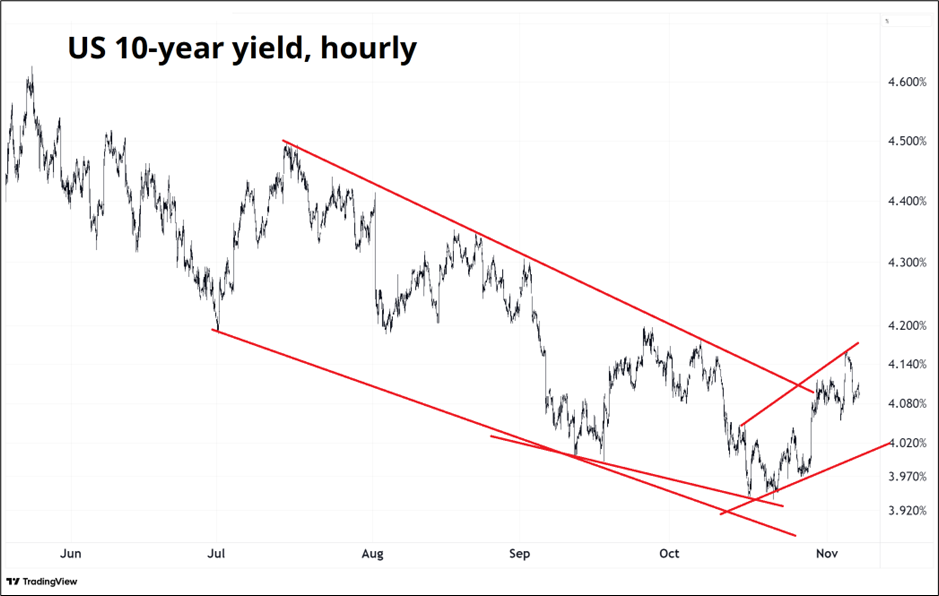
Interest rates have not been in play all that much as volatility in bond markets has cooled dramatically (similar to FX vol). The action has been in equities and precious metals in recent months with bonds and FX somewhat sidelined.
People are still worried about funding and liquidity as the government shutdown continues to drain money out of the system. Money that should be going to federal workers, contractors, and benefit recipients is instead sitting in the Treasury’s account at the Fed and draining out of bank reserves.
The shutdown is starting to have a negative impact on the job market and on sentiment as it has now dragged on long enough to have a real-world impact beyond government workers. SNAP benefit confusion and flight cancellations are not big enough to impact GDP on their own but could have some multiplier effect if they hurt confidence and increase the already substantial malaise of the low-end consumer.
The market has been bearish USD for six months, but I would say that this week marks the end of that story. The USD bears have fully capitulated. Major strategists have thrown in the towel, and our positioning data has flipped to show that the market is now net long USD, not short. The USD long is most substantial vs. CAD, NZD, and JPY.
The market hates Canada and New Zealand, for pretty good reason, and hates the JPY due to the recent election of Takaichi and her insistence on maintaining a more Abenomics style policy of loose fiscal and loose monetary policy. She claims she wants a stronger yen but isn’t running the policy that would support that wish.
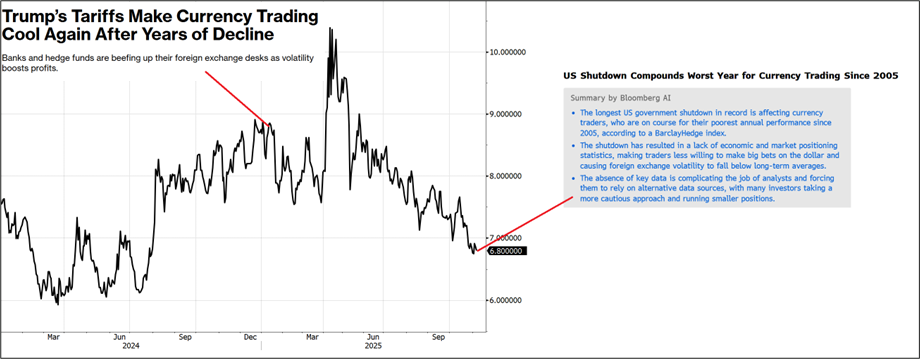
It’s been a tough slog for FX traders recently as volatility is low, correlations have just about disappeared, themes are few and far between, and many of the recent moves are hard to explain, even after the fact. This happens in FX sometimes. You just have to ride it out. At least there’s this (the chart is FX Volatility):
Crypto remains soggy as there is no bullish narrative.
The ETHzilla sales highlight the procyclical nature of the crypto treasury scam as whales were selling $1 bills to retail for $2 and can now buy those $1 bills back for under a buck. There is a death spiral aspect to the crypto treasury trade when the stocks trade below NAV because not only do they stop buying crypto, they are incentivized to sell it. Much as GBTC traded way above then way below NAV, crypto treasury companies can too. One day we might see Warren Buffett come in and buy a crypto DAT at 50% of NAV and then sell calls on BTC to lock in a guaranteed arbitrage. For now, crypto is underperforming stocks and stocks are performing poorly.
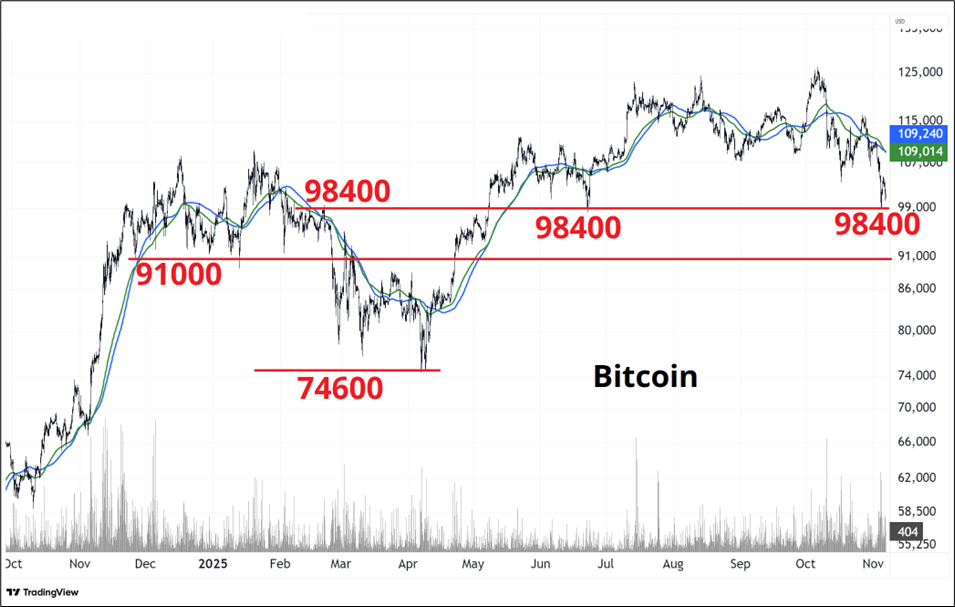
4-hour bitcoin chart follows below. 98250/98400 area (depending what feed you look at) has been a major pivot all year. Broke down in FEB / held below / then cracked above in May, retested and held. Nearly tested again Tuesday.
Below that: 91k/93k
… then 74500/77200 zone below that.
Saylor’s DCA 74,058 a psychological level too I suppose.
Saylor’s DCA is meaningless from an operational point of view, but fun to watch. The more important question for MSTR will be how they pay back their debt in 2026/2029 if they can’t raise any more money.
Meanwhile, Tom Lee, he of the “ETH wiLL TRaDe 16,000 bY YeAr End” call, is underwater on a huge majority of the ETH purchased by BMNR.
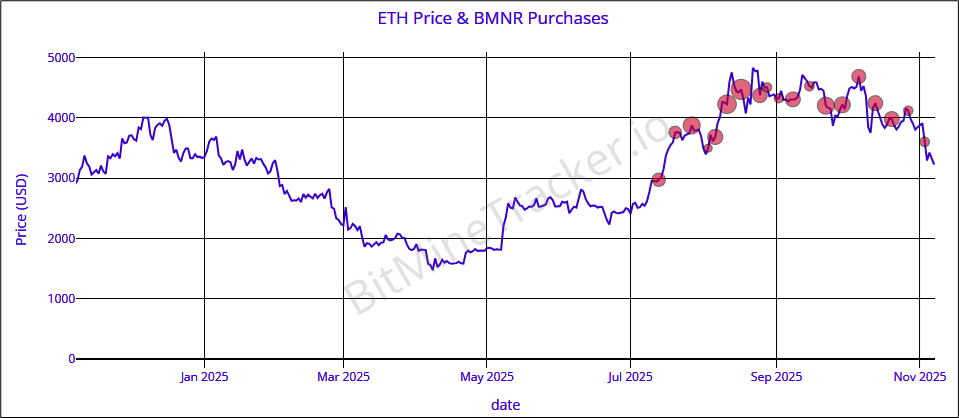
Again, maybe who cares? It all looks grim to me, and I think we take out 98400 soon.
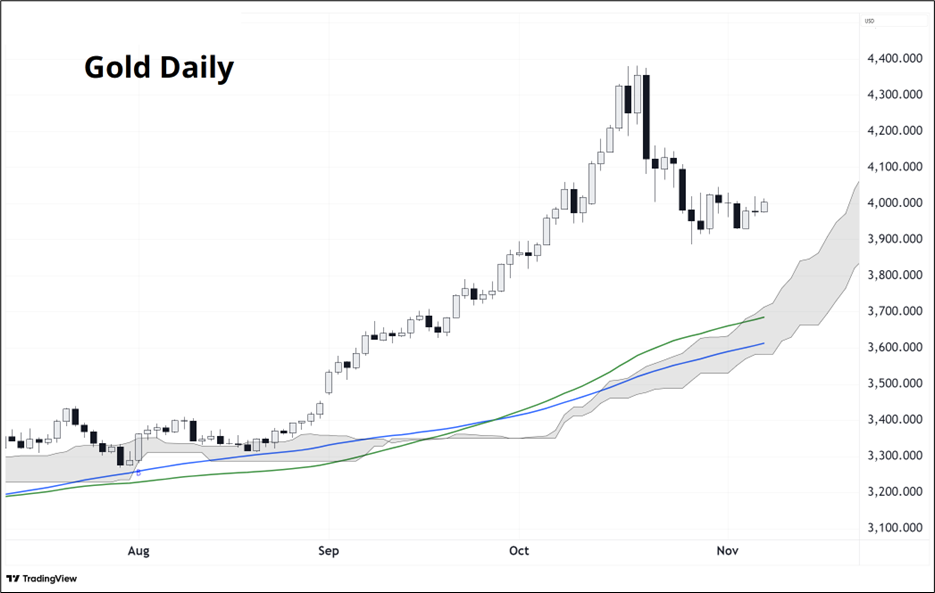
With the gold and silver momentum break a few weeks ago, we have entered a consolidation phase. This is normal after a massively overbought thing reverses. I am more bullish gold than most other assets simply because there is a shortage of safe assets in the world as bonds, JPY, and CHF don’t really work anymore. The r/wallstreetbets crew buying GLD calls put in the top, but you can argue the fundamental story remains good.
Dip buyers probably want to focus on 3600/3700 because that is where the 100-day moving averages and the cloud come in.
Oil had its bounce and while it’s a popular short, the rally hasn’t exactly been impulsive.
That’s it for this week.
Get rich or have fun trying.
*************
For Stone Temple Pilots fans via Mr. N. Jonas
*************
When I write a 300-word, insightful market-related commentary on Twitter, it gets maybe 130 to 250 likes. And then there’s this:
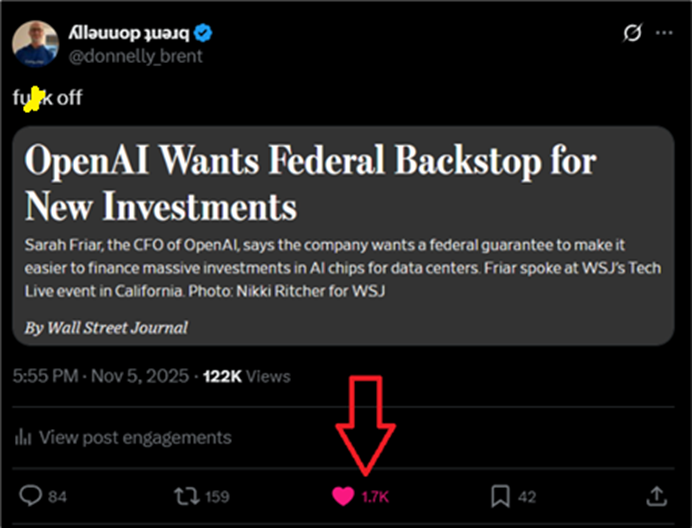
It’s superficially funny, but really it points to the fact that the most angry and aggravated content is what resonates on Twitter. It’s a waste of time to post anything reasonable because nobody will ever see it.
*************
Headline of the week:
*TARGET MANDATES WORKER SMILES, FRIENDLINESS TO BOOST SALES
*************
Thanks for reading the Friday Speedrun! Sign up for free to receive our global macro wrap-up every week.
