Phil’s DNT idea is solid

Beyond yeet

Phil’s DNT idea is solid

Beyond yeet
Long USDJPY @ 151.80
Stop 149.84. Target 154.84.
Short AUDUSD @ 0.6486
Stop 0.6576. Target 0.6357.
Short EURUSD @ 1.1585
Stop 1.1711. Target 1.1409.
Short EURCHF @ 0.9228
Stop 0.9285 Target 0.9111.
My general view on GBP is (and has been) that the market expects fireworks from the Reeves budget on November 26, and that expectation is unlikely to be met. It is rare that a crisis is telegraphed months in advance, because that’s generally not how crises work. Also, you rarely get a crisis in the same pocket of financial markets twice in a row—and we just had a UK debt crisis in September 2022. Furthermore, there have been leaks and dribs and drabs of information about the budget coming out already and by the time November 26 rolls around, there probably won’t be many details left to guess.
The UK is in mild stagflation with CPI still up at 3.8%, Unemployment rising from a low of 3.6% to 4.8%, and GDP growth hovering around 1.5%. It’s not a great look, but it feels like a stable equilibrium as inflation is cooling, gilts are performing okay along with global bonds, and the Bank of England is not priced for much. Falling inflation is dovish, but it’s also somewhat helpful in alleviating the EM comparisons.
Phil Valori (Spectra FX) highlighted a double no touch idea today, and while I realize that retail traders cannot do these, they are a nice idea if you work at a bank or a hedge fund. I don’t think the passage of the budget will unlock a massive GBP rally, but I also don’t think it’s going to trigger a crisis. And GBP remains a high-yielder in G10, so you get some carry benefit if you skew towards the downside.
The range in EURGBP over the past two months is a mere 141 pips.

Buying a double no touch (DNT) is selling vol. Do you really want to sell vol when realized has been so low (and implied is low too?) I think so, yes.
If you look at that chart on page 1, the spikes stand out (Eurozone crisis 2010/2011, UK downgrade 2013, Brexit 2016, COVID 2020) but if you look more closely, there are plenty of times where realized vol is persistently low. Volatility clusters more than it mean reverts. Here is the forward 2-month range after a 2-month range of less than 200 pips.

You can see that quite often you still get a range of 250 pips or less. My bias is that GBP does okay from here, so I want to skew the EURGBP DNT downwards. If you use 0.8494/0.8781, the thing costs around 25% off 0.8690 spot. Phil is suggesting something tighter like 0.8575/0.8775 because that thing only costs 11% or so and rolls up to 42% if you survive for one month. That is a reasonable strategy, too—do something tighter and consider taking it off once it’s increased 3X in value. Either strategy is viable and positive EV to me.
My 25% idea is 287 pips wide, which I think is right for a trade where you put it on and ride it to expiry. The most annoying risk for both of these is the market attacks GBP after the budget, EURGBP spikes, then it’s a nothingburger and EURGBP collapses but you got knocked out. That’s why you get so much leverage.
As always, please reach out to me on Bloomberg if you are interested in this structure. We can price and mess around with strikes if you like something a bit different. I actually love this trade, but I am not putting it in the sidebar because it’s a bit idiosyncratic and features a longer time horizon than normal.
Speaking of the sidebar, the long USD and short EURCHF I put on yesterday are doing OK, with USDJPY about 100 pips higher and the rest within a random margin of error. CPI is key and then hopefully month-end corporate USD buying next week will take the USD to Shangri-La.
There is a mild read through from Canadian CPI to US CPI as both countries feature similar economies with similar pricing patterns and inflation trajectories. If economists whiff on the Canadian data, they are more likely to whiff on the US data in the same direction. Since January 2000, there are 155 months where Canadian CPI missed or beat, and US CPI also missed or beat. 89 out of 155, the miss in Canada matched the miss in the US, and 66 times it did not. That’s a 57.4% hit rate, which is not crazy beautiful, but it’s one more piece of the puzzle.
If you filter only for misses >=0.2% in Canada Headline CPI (September CPI in Canada was expected -0.1% and came in +0.1% for a 0.2% beat)… The results get spicier. When Canadian CPI was strong or weak by 0.2% or more, US CPI missed in the same direction 55 times and missed in the wrong direction only 26 times (67.9% hit rate).
To sum it all up: Rising Prices Paid, rising commodity prices (BCOM up quite a lot in both August and September), tariffs, higher-than-expected inflation in Canada, and two full cuts priced in for the FOMC in 2025… To me it all points to an asymmetry where we are more likely to get a strong CPI and the market reaction function will be asymmetric that way, too. I guess we find out tomorrow.
I (and many others) have been waiting for the CME to raise margins on gold and silver. But someone sent me this yesterday.

https://www.cmegroup.com/content/dam/cmegroup/notices/clearing/2025/10/chadv25-323.pdf?
It shows they raised margins after the close on October 16. And that is when gold and silver peaked. There is nothing on Bloomberg or any legitimate news service about it so I’m surprised. But it looks like the CME raised margins exactly at the peak on Thursday afternoon (October 16) and that probably contributed to the collapse in silver and gold. And I completely missed it somehow.
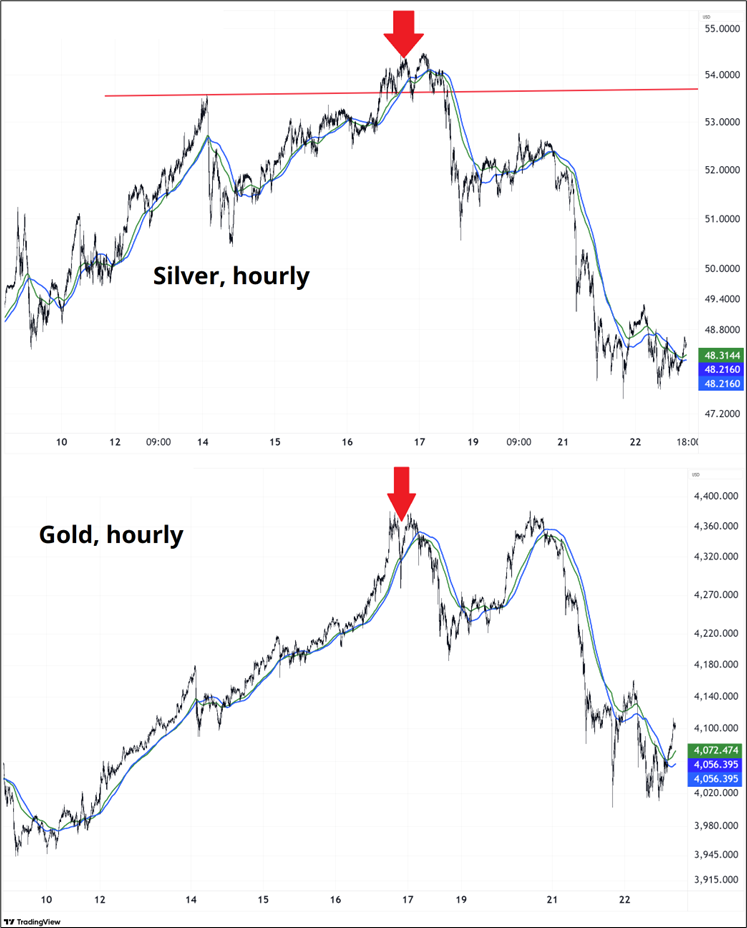
As someone who likes to think of himself as an information hub kind of guy, this makes me feel pretty stupid. I apologize for my lack of knowledge and the non-timeliness of this information. I almost didn’t want to say anything because I am embarrassed, but better to fess up. Red arrows mark 18:00 NY time on October 16. So maybe the rinse is over in gold and silver and they consoliate for a while now. Silver trades a $46/$51 range, e.g.

1-year total returns by US GDP growth bucket

The more years I spend doing this, the more I think bucketing and slicing by deciles and groups and percentages is way better than regression analysis. Most performance analysis requires the recognition that markets behave in particular ways in particular regimes and the performance is not linear as you move from regime to regime. And it’s not really exponential or curve-fittable. It’s just a bunch of regimes that need to be looked at separately. Normal economic growth of 1-3% is a thing, and economic growth of >4% is a thing—and the shift between the two things is discontinuous, not exponential or linear.
We attended the National Association for Business Economics Annual Conference in Philadelphia this week – and our major take away was that despite a generally negative outlook on the macro picture, we did not find many economists who were worried about their particular industry (except housing). This is not unusual, and is part of the reason economics is called the dismal science. As we have often noted, economists are rarely hired to point the way toward growth – that is the job of strategists and CEOs, who more often graduate from business schools. Economists are defense, hired to point out potential pitfalls from changes in government policy, whether monetary, fiscal, or regulatory.
It’s hard to find optimistic economists, even in a world where expansion is the norm and recessions are a rare exception. I suppose “things look pretty good still, and some stuff is weak but most stuff is fine” does not sound very smart, even though it’s the probabilistic base case.

Have a day that is beyond yeet.
Beyond yeet
