Yes, it’s the fiscal and monetary mix but I need more than that to trade it

Yes, it’s the fiscal and monetary mix but I need more than that to trade it

30JUL USDMXN put fly
17.40/17.15/16.90
1X2X1 for 30bps off 17.52 spot
13JUL USDKRW put spread
1530/1505 for 37bps off 1543 spot
I am not a fan of regression because it rarely yields actionable insights. It can be good for simplistic 30,000-foot views of the market, but it assumes so many things that are not normally true in financial markets. When you understand how two markets interact, you almost always appreciate that the speed of change is just as important as the change or the level. For example, bond yields impact the stock market more when they move up quickly than when they move up slowly—a regression whiffs on that sort of interaction.
Anyway, here’s a regression.
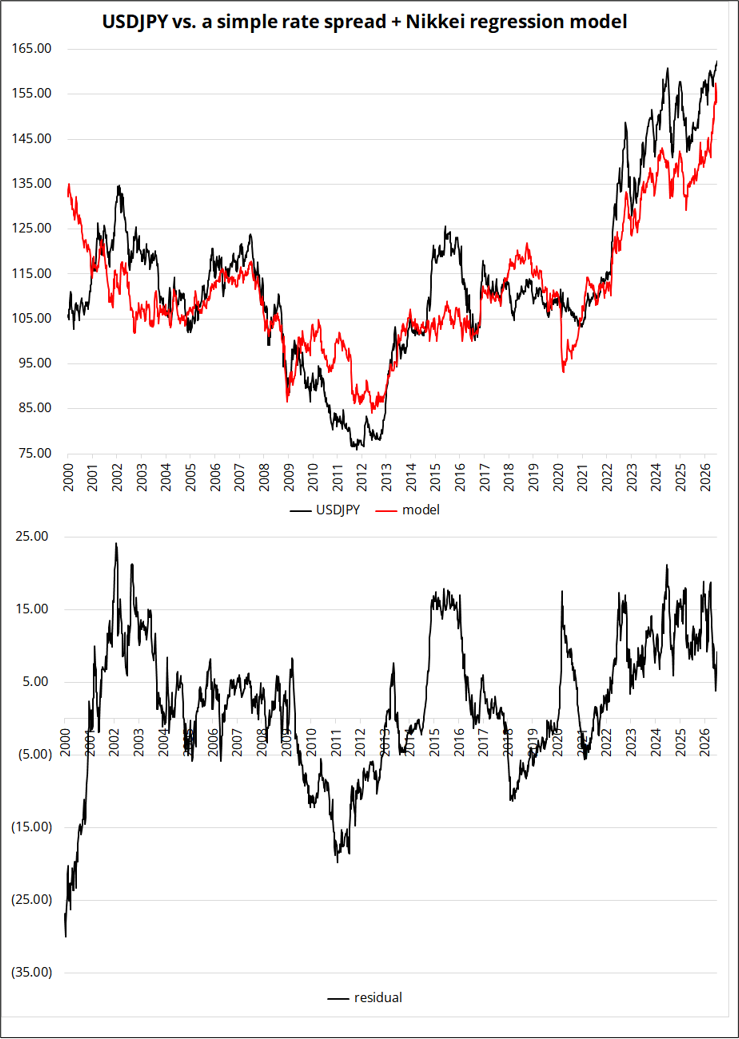
The reason I decided to build this is that I am having a hard time understanding what is going on in USDJPY and I don’t like trading off simplistic explanations like “loose fiscal/loose monetary” because that sort of framework would mean you just always go long USDPY for the rest of your life and you almost always go short USDCHF and USDNOK. These sort of fiscal scorecard approaches are not flexible enough for my time horizon.
In other words, structural analysis is not useful for the way I trade. Much as doing a DCF on Tesla isn’t going to help you trade the stock, observing that Takaichi prefers loose fiscal policy will only get you so far in USDJPY. Of course, when she came in, there was a huge trade because it was a regime change. Now, almost two years later, I am not as certain that’s a useful way to position in USDJPY. It’s like trading stocks off the Fed Balance sheet—at inflection points of course it matters, but over time it gets priced in and/or loses its power.
I am keen to find a good explanation for USDJPY because I believe what David Deutsch has said (paraphrasing): You need good explanations before you can make good predictions. The chart above is a simple linear regression of 10-year rate differentials + Nikkei vs. USDJPY using data from 2000 to 2019. The model still looks pretty okay out of sample (2020 to now) as you can see the red line and black line move together somewhat through and after COVID and through and after Takaichi’s election.
The reason USDJPY tends to trade with Nikkei has partly to do with hedging but has more to do with the fact that a rising Nikkei signals strong risk appetite in Japan and increased buying of foreign assets by the Japanese. While everyone loves to worry about Japanese debt, the reality is they have a lot of assets too! People obsess over sovereign debt because scary stories are more fun (dystopian fiction outsells utopian fiction 30:1) but a balance sheet has two sides.
The most interesting takeaway from the chart is that the residual is shrinking, not increasing. The insane runup in the Nikkei (it has more than doubled since Liberation Day) offers a fairly solid explanation for the strength in USDJPY, even as rate differentials and oil go down. While I have been obsessed with oil this year because the importers went nuts in USDJPY for a while after the war, the surprising fact is that the coefficient of oil is backwards if you include it in the regression model pre-2020. In other words, pre-COVID, oil had zero explanatory power over USDJPY.
Today’s am/FX is a bit of a thought piece with no call to action. I am just trying to get the framework for USDJPY straight in my mind. Takeaways:
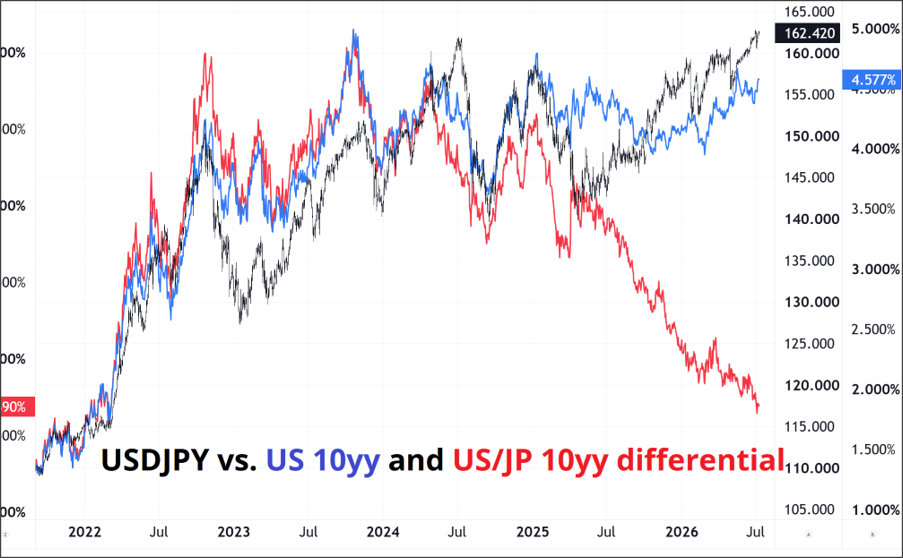
All this to say that if you want to take a view on USDJPY that has nothing to do with timing the next MOF intervention, you need to have a view on the direction of Nikkei and U.S. yields. Not Japanese yields or the BOJ. This is clear on a micro level, too, as USDJPY reactions to BOJ policy surprises last about 14 seconds.
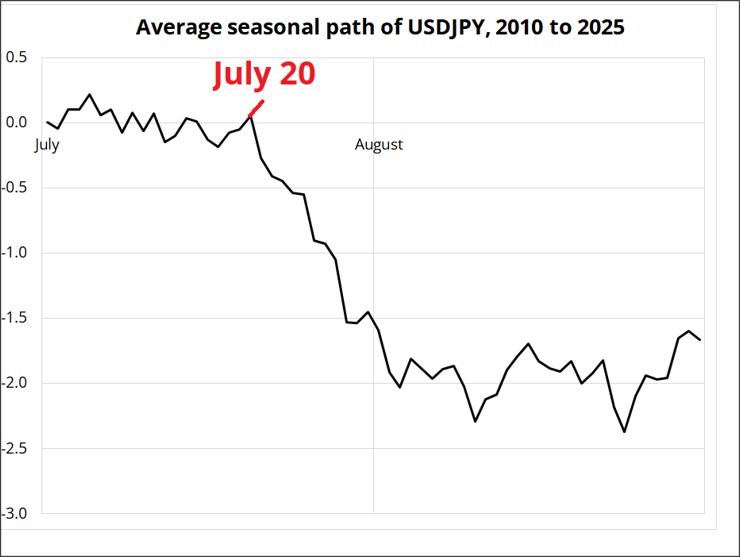
One other factor worthy of consideration is that July 20 marks a seasonal high point for USDJPY.
Again, no call to action here. I suppose I am trying to think through the alternative hypothesis to everyone’s base case which is: USDJPY will be permabid because of loose Japan fiscal and hawkish Warsh, with MOF intervention risk as a wildcard.
I want to be open to the possibility of an organic reversal in USDJPY and think about what might drive that.
Round number bias is one of the most interesting of all the psychological biases. I cover it in Alpha Trader. The basic concept is like: When you fill your car with gas, do you sometimes have the urge to round it off to the nearest dollar, even though you are paying with a credit card? Do you get a tiny thrill watching a car’s odometer roll over from 99,999 to 100,000? For many amateur marathon runners, a finishing time of 3:59:58 is a great success while 4:00:02 is a disappointment. These are examples of round number bias.
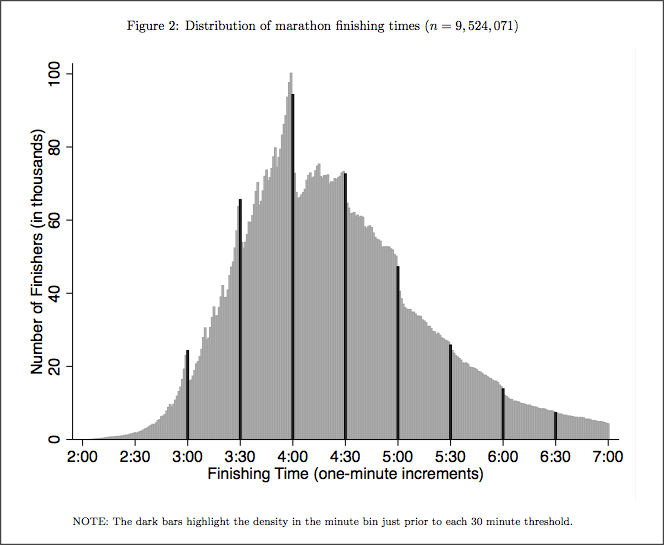
Runners push extra hard to beat 4 hours then give up if they cannot
Round number bias appears in financial markets, and while this knowledge will not be life- or career-changing for you, it will save you from the occasional big disappointment. Due to round number bias, many market participants leave their orders on the round numbers. Many more than you would see if orders were randomly or evenly distributed. This anomaly is present in every market I have studied.
Recently, I have been trading a lot of MU because there is so much leverage in the semi space it makes for some incredible short-term trades. The thing trades at $1014 or so, and thus I was wondering if round number bias would still apply. That is, when something has such a huge absolute value, do highs and lows still happen more often on the round numbers? The answer is yes. See chart here, which shows the distribution of the cents of MU open/high/low/close data.
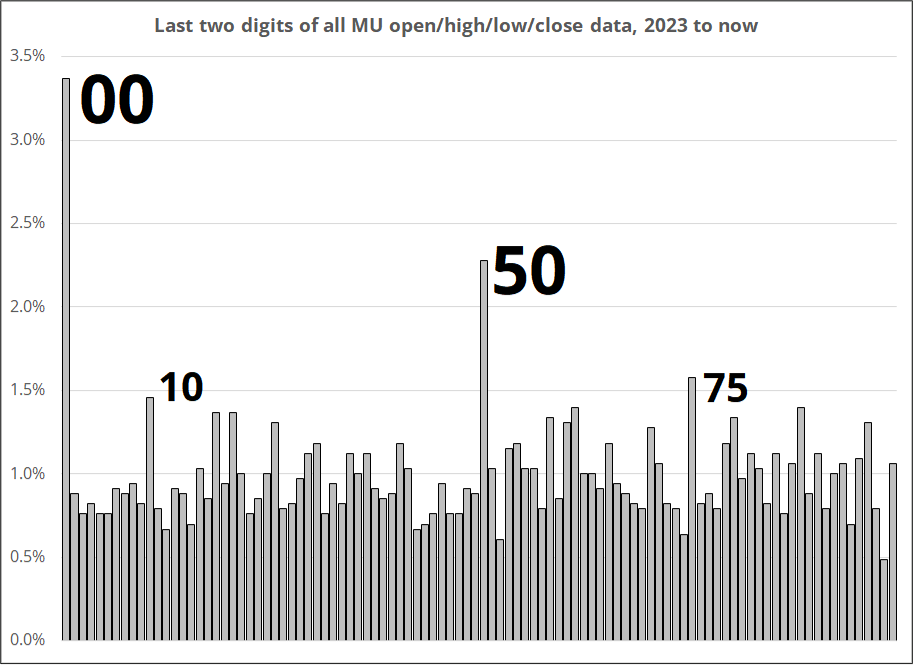
Leave your bids at .11 and your stops at .97. It usually won’t matter, but the one time it matters, it matters a lot. Same deal with FX option barriers—don’t leave them on the round numbers!
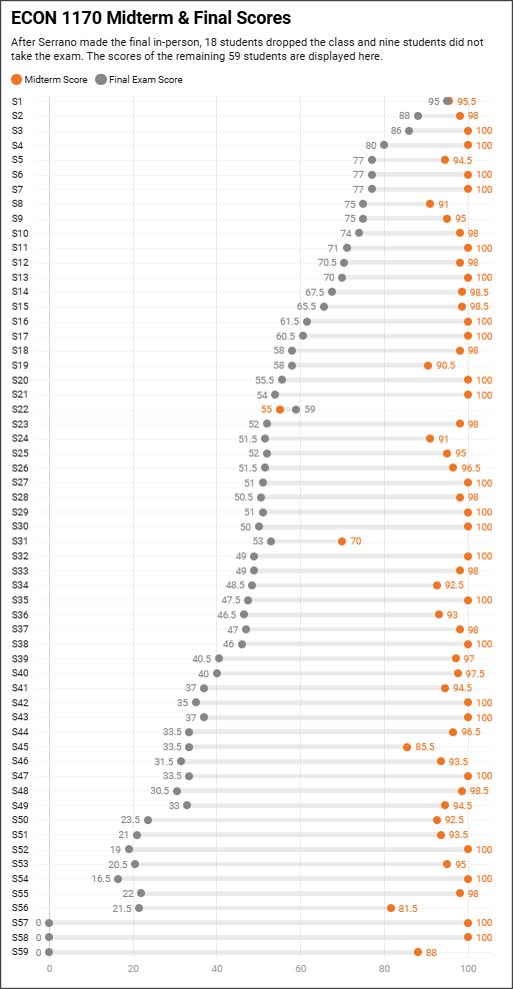
The stupidest thing about this is that the kids aren’t even good at cheating! If you’re going to cheat, you aim for a grade of ~86%, not 100%! Don’t make it so obvious. Be better at cheating!
If you spent any time in clubs or at raves in the early 2000s, the bit from 4:00 to 4:45 will make you smile and give you goosebumps, guaranteed.
Via Jared Dillian
Have a snippy day.
A quartet of scissors?
HT SkD


This piece is mostly for people who are interested in backtesting

This could be a consolidation week as crosswinds now blow in FX and equities