Fading the Fade

Subscriber-only

Took profit on the CADCHF. Now entering short GBPJPY.

BD
by Brent Donnelly

You have an urn full of red and white balls, but you have no idea how many are white and how many are red. You start by assuming it’s 50/50. Then, you blindly remove one ball and it’s red. What is now the best estimate of the ratio of red to white balls?

What if you now take another ball out and it’s red again?

Current Views


Short GBPJPY @ 187.00

Stop loss 190.61

Take profit 182.66

Tiny walkback

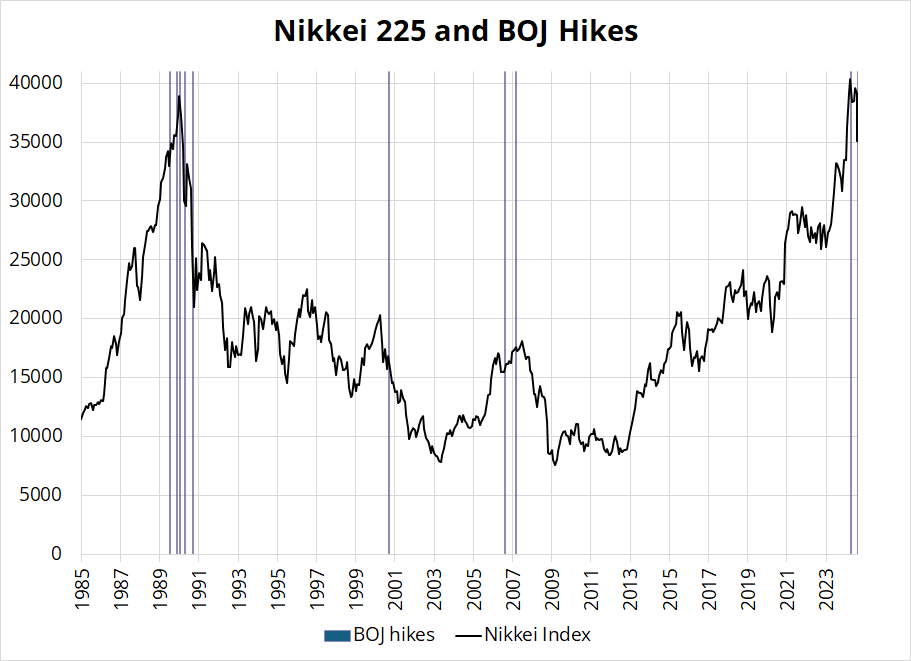
Turnaround Tuesday did not disappoint as the market has ripped equities off the lows, cooler heads prevail, and Uchida drops a dovish walkback on the yen. The BOJ still has painful flashbulb memories of hiking at the worst possible times, as prior hikes in the late 1980s, 2000, and 2007 all preceded 50% drops in the Nikkei.
Meanwhile, we are back in the danger zone for US equities as we got the scheduled Tuesday rally and now we’re at major resistance in the NASDAQ. CHFJPY failed at 172 again, USDJPY is no longer oversold, and tomorrow looks risky for stocks. Here is how the NASDAQ does on Turnaround Tuesday, and then the three days afterwards. Thursday is bearish.
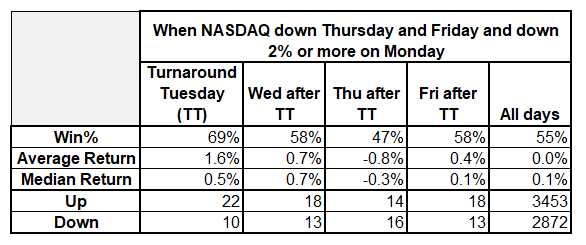
This bearish result for Thursday is notable because in the sample I’m using (1999 to now), the NASDAQ rallied from a level of 2,000 to ~20,000 and therefore you would be hard pressed to find a condition with a sample size of 31 days where the output is bearish. It’s difficult to find bearish strategies in a data set that went up by 10X.

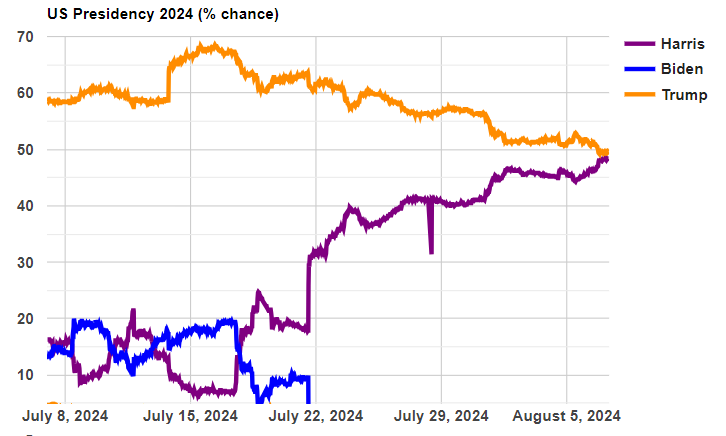
Even worse for stocks, Kamala Harris and Trump are now tied. This is bad for stocks and all debasement trades (as I have discussed many times) because the MMT on steroids fiscal approach is not guaranteed to be delivered by a Harris government. Add on top of this: The BOJ Summary of Opinions from the July meeting come out tonight (19:50 NY) and following the Uchida comments overnight, the risk now is that those sound hawkish.

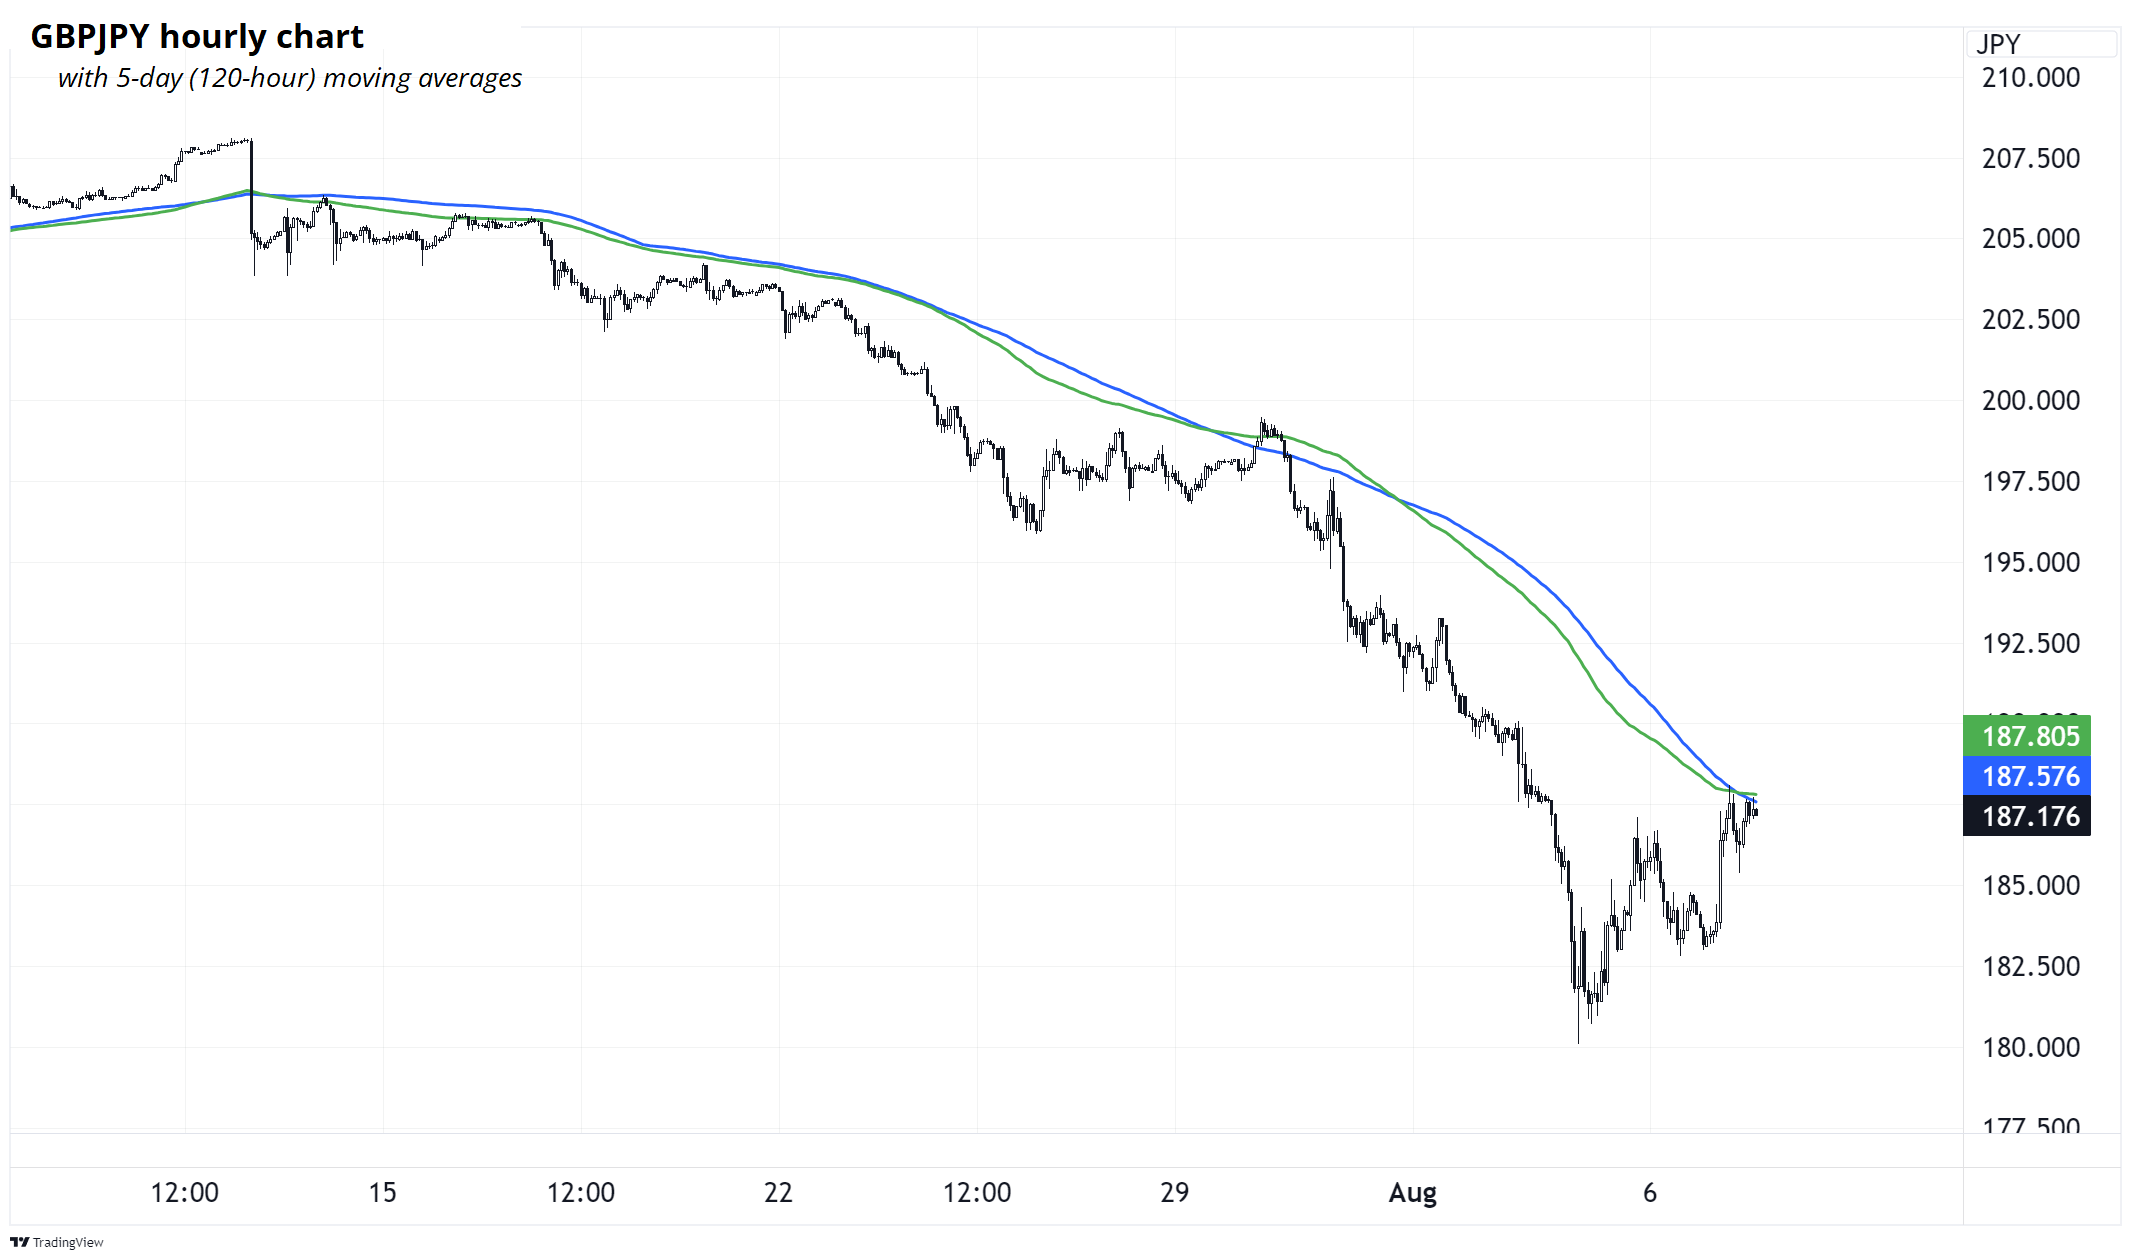
As such, I think it’s time to flip. The CADCHF bull trade is exited near the highs and now it’s time to look at bearish trades again. I like short GBPJPY as GBP is one of the weakest links in this risky asset rally. Much as CAD showed incredible strength when stocks were collapsing, GBP is showing tremendous weakness now. The 5-day moving averages are right here (187.60/80) and this looks like a good entry point to position for a return to equity weakness and JPY strength.

Short GBPJPY here (187.00) with a stop at 190.61, looking for a return towards 182.00.
One could also make the argument for long USDMXN with a stop at 18.94 as MXN, like GBP, hasn’t strengthened very convincingly or impulsively, either.


Final Thoughts

The October Surprise came early. Chart from electionbettingodds.com.
Have a Bayesian day.

Imagine there are just two balls, one red and one white. 50/50. Then, you draw a red ball. Now there are three balls, two red and white (66.7% red is best estimate). Then, you draw another red. Three red and one white (75% red is best estimate). That’s the simple way of thinking about it and it’s analogous to the Monty Hall problem. Here’s a more complicated explanation.

1. After drawing the first red ball: We need to update our probability estimate based on this new information. This is a perfect scenario for applying Bayes’ theorem. Let’s say R is the event of drawing a red ball. Our prior probability P(R) was 0.5. After drawing a red ball, our new best estimate is: P(R|R) = P(R) * P(R|R) / [P(R) * P(R|R) + P(W) * P(R|W)] Where P(R|R) is the probability of drawing red given that we’ve already drawn red. P(R|R) = (n-1)/(N-1), where n is the number of red balls and N is the total number of balls. Simplifying, we get: P(R|R) = 0.5 * (n-1)/(N-1) / [0.5 * (n-1)/(N-1) + 0.5 * n/(N-1)] This simplifies to n/(n+1), which is approximately 0.667 or 2/3. So after drawing one red ball, our best estimate is that about 2/3 of the balls are red.

2. After drawing a second red ball: We repeat the process, but now our prior probability P(R) is 2/3. P(R|RR) = (2/3) * (n-1)/(N-1) / [(2/3) * (n-1)/(N-1) + (1/3) * n/(N-1)] This simplifies to 3n/(3n+1), which is approximately 0.75 or 3/4.

Therefore, after drawing two red balls in a row, our best estimate is that about 3/4 of the balls are red.

This demonstrates how our probability estimates change as we gather more information, a process known as Bayesian updating.

HT DEEPS!!

good luck ⇅ be nimble

More recent posts

Subscriber-only

Enough of this EUR

The window for a euro rally was open and now it’s closing

Rabbit Holes

CAD and Rabbit Hole #18

This piece is mostly for people who are interested in backtesting