Some quick thoughts on Fed and Turnaround Tuesday

Until the 1950s, most stop signs were yellow

Some quick thoughts on Fed and Turnaround Tuesday

Until the 1950s, most stop signs were yellow
10SEP CHFJPY put spread
199/196 for ~37bps off 200.50 spot
First up, a lovely chart idea from Bloomberg, which I took and added. This is my chart, but it’s a copy of an idea presented by Bloomberg (sent to me by Tim Power).
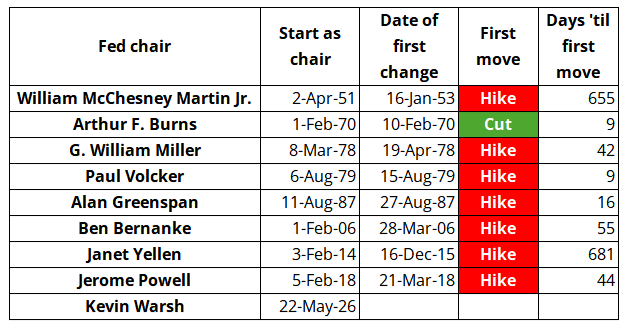
This feels mildly relevant as Warsh and Waller remain on a hawkish warpath even in the face of weak CPI and soft NFP. With the Middle East back in the headlines and non-headline energy prices (crack spreads, Dutch natgas, etc.) making new highs, the inflation story is not even close to settled. The Fed has a strong preference for a credibility-building hike right now, USD positioning is super clean (was max long USD a few weeks ago), hostilities in the Middle East have resumed, energy prices are boiling, and AI / computer inflation is still hot. The setup looks symmetrical here at this point with yields not far off the 2026 highs.
The biggest issue facing speculators right now is the lack of new information as we await the FOMC meeting July 29. There is no meaningful data on tap, the UK story has settled (GBP was buy rumor/sell fact), MOF intervention in USDJPY remains a waiting for Godot type situation, and even a 50% tariff on Canadian goods isn’t moving the needle.
It’s interesting that the market does not take the 50% tariff announcement seriously at all. USDCAD went up 15 pips and back down 15 pips. The never-ending onslaught of half-serious trade war measures from the U.S. administration does not agitate markets anymore as the end result is that they could be waived, delayed, or ruled illegal. My thoughts and prayers to Canadian exporters trying to run a business in this environment.
It may seem daft to be talking about Turnaround Tuesday (TT) now, because it would have been much more useful to talk about it yesterday before this 1.33% rally in NQ futures. The problem was, when I wrote am/FX yesterday, stocks were deep in the green. It was only a large reversal that finally took stocks negative on the day and triggered a Turnaround Tuesday signal[1]. The signal triggers if Thursday, Friday, and Monday are down in SPX. I have written about this effect many times in the past in am/FX and in my books. It’s a strong pattern that yields strong positive returns.
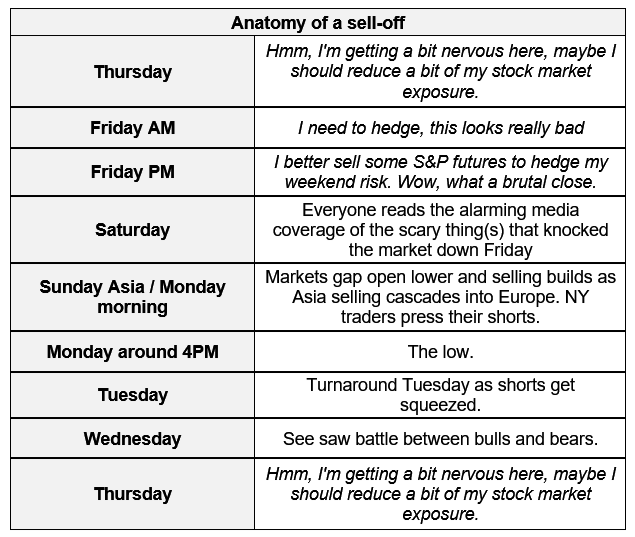
The behavioral mechanism is that a scary thing is happening, stocks sell off into the weekend, the weekend media reinforces the scary thing and investors dump on Monday. Shorts add to winners as this Monday selloff unfolds, then there are no sellers left by Tuesday and so things bounce. This time, it’s the war and Kimi3 that are the scary thing. But the pattern never changes.
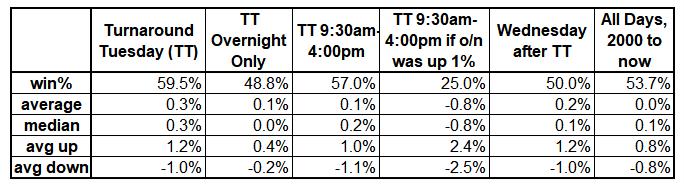
For your future reference and for your information with regard to today’s setup, here are the statistics around TT. I will give the major takeaways in bullet form:
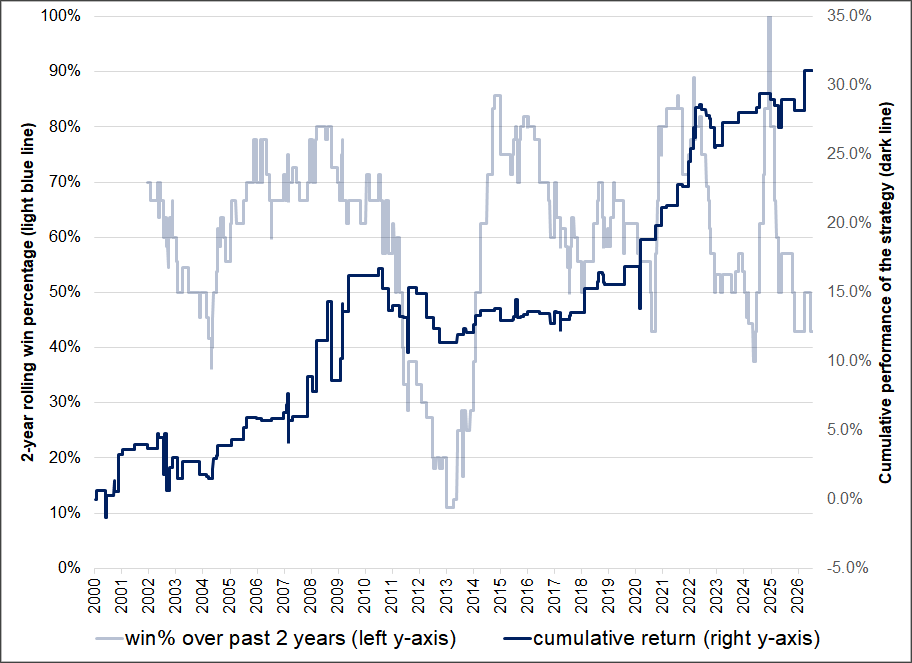
This chart shows the P&L of long only on TT signal days. You can see the skew is pretty good and the Sharpe is solid. You can see most of the gains come during crises (GFC and COVID) as it works best when people are completely freaking out.
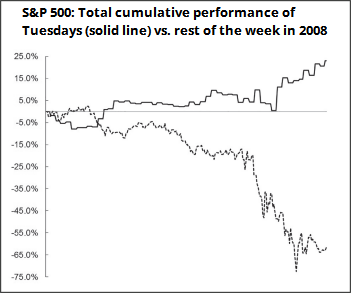
One of the craziest statistics in finance is this one: In 2008, a year stocks fell more than 50%… You made money if you were long only on Tuesdays. That is bananas. Here is a chart excerpted from page 225 of Alpha Trader.
In conclusion, watch for TT in the future and watch out for a reversal in stocks after 9:30 a.m. today.
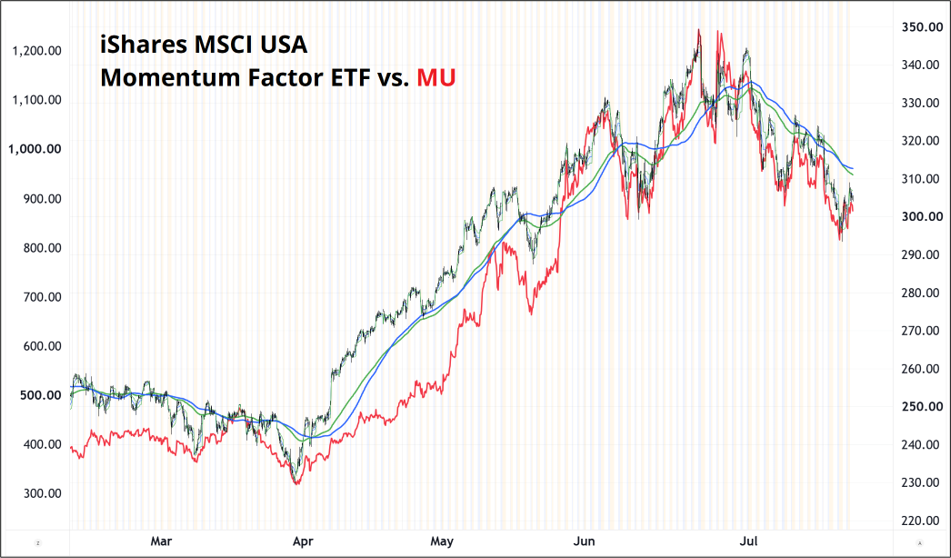
I have written in the past, and more recently, about how it’s useful and important to understand the real driver behind the things you are trading. Various momentum indices and ETFs often get discussed in the media and in market analysis, and they tend to discuss momentum as this basket of stocks or index of companies. The reality is that “momentum” means “semiconductors” means “Micron” right now.
The smoothest baseball play ever.
Have a colorful day.
Until the 1950s, most stop signs were yellow
There were a variety of colors used for STOP signs until the late 1920s, when the background color was standardized on yellow for maximum day and night visibility. This was years before the invention of glass-bead retroreflectorization for sign faces, so a red sign looked very dark at night.
By 1954, signmakers were able to use durable fade-resistant and reflective red coatings for sign faces, so the STOP sign was changed to the red color you see today. This change also served to make the color consistent with that of red traffic signals.
—
[1] Note: I did blast the TT info to my client chats at 4 p.m. yesterday. If you work at a hedge fund and trade FX options and would like me to cover you, please ping me on Bloomberg.