There are weeks where nothing happens; and there are weeks where decades happen. This was the former.
Hello. It’s Friday. Thanks for signing up. I’m Brent Donnelly.
The About Page for Friday Speedrun is here.

There are weeks where nothing happens; and there are weeks where decades happen. This was the former.

Hello. It’s Friday. Thanks for signing up. I’m Brent Donnelly.
The About Page for Friday Speedrun is here.
Here’s what you need to know about markets and macro this week
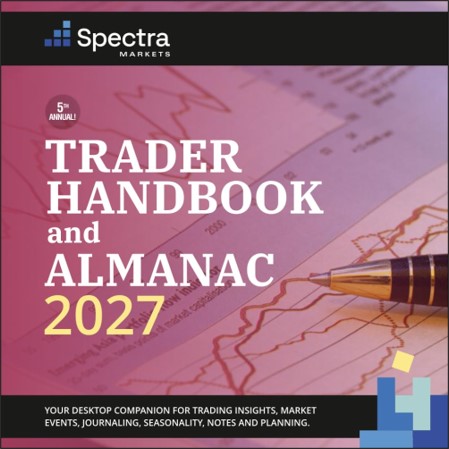
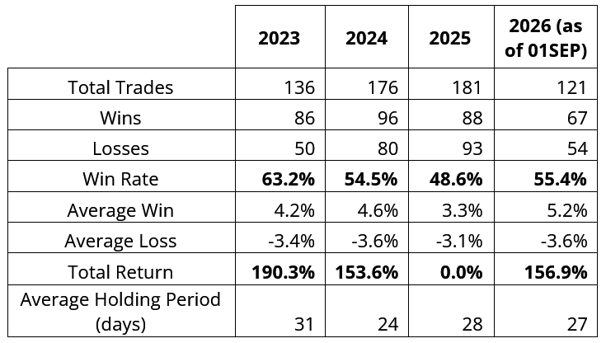
Before we get started, The Spectra Markets 2027 Trader Handbook and Almanac is now available for purchase. This is the fifth year for the book, and I can confidently say that it’s the nicest-looking edition so far. You can buy it here for under $30. After a break-even 2025, the signals were back on fleek in 2026. Here is the raw performance of the signals (out of sample, of course, because we publish them months before the start of the year). If you vol-adjust the signals, you get similarly stellar results. Equities and crypto delivered the strongest asset class returns while FX was the worst, fwiw.
These results are raw returns without sizing for volatility and with no stop loss; they are to be taken in that context. We have tested vol-adjusting and the results are not significantly different.
I use seasonality as just one input as I try to layer multiple small edges overtop of each other in an attempt to find a trade with a large edge. Some funds trade seasonality systematically, but I use it as one of many discretionary inputs.
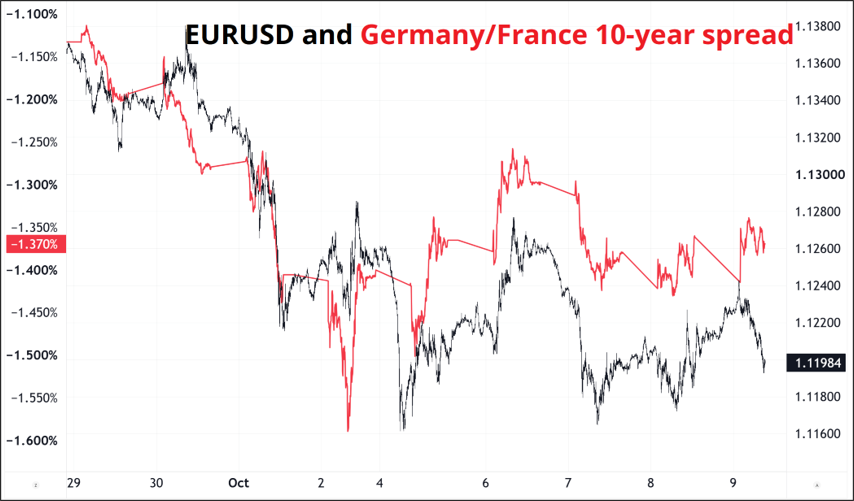
Anyway—This was a consolidation week of sorts as very few products made new highs or lows. For example, this week started on October 5 and here is how some major assets traded:
Currencies and sovereign spreads:
Stonks:
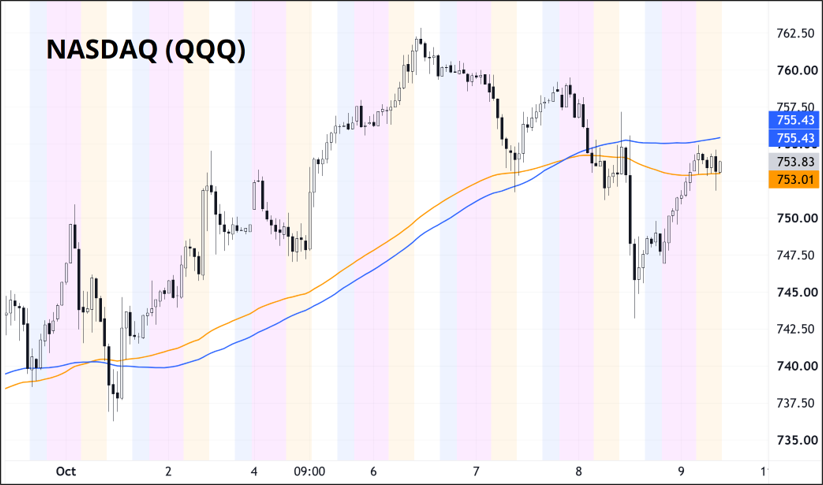
US bond yields:
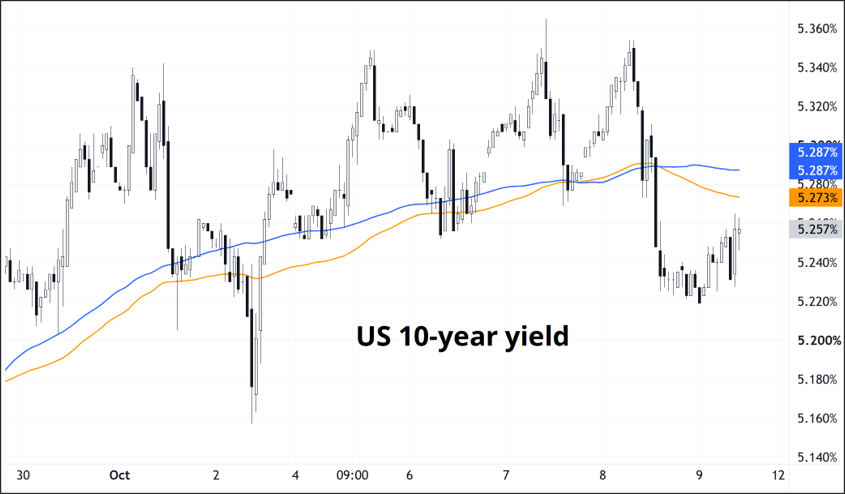
You get the idea. Stuff ain’t moving. This is a fairly common situation / regime in markets after a large move. In FX for example, you can argue that currently we have the following conditions:
So, you get consolidation. Predicting consolidation phases can be an incredibly useful tool as a trader because it helps you conserve mental energy and avoid going long vol (buying options) when nothing is going on. After a large move like we saw last Friday in French spreads and currencies, the market starts to get that foaming at the mouth feeling where nobody wants to miss it.
The next crisis is here! Gotta be short some OATs!
But dude, OATs have just gone from 100bps to 160bps in a straight line.
Okay! Gotta fade it! This is the extreme! I’m gonna catch the turn!
Sometimes the answer is not that the trend will continue and remain impulsive, or the trend will reverse. It will consolidate. If you can avoid losing money during consolidations and be on board during some meaty parts of major moves, you will make money. Many traders make a ton in the trend, keep pyramiding all the way down, buy too many options, then end up flat P&L when the thing consolidates for two weeks because they get chopped up and their options expire worthless.
Last week, I pooh-poohed breadth as a bearish condition in stocks. But part of my reticence in adopting a bearish view in recent weeks was also the relatively okay performance of precious metals and the notable strength in crypto. When those two liquidity barometers are performing well it makes it much less attractive to be short the stock market. When they are turning over and soft it feels safer to be bearish QQQ, for example.
Side quest: Are silver and bitcoin liquidity barometers? Or thermometers? Which term is best here? Barometer, is best if my point is that they move first. A barometer measures pressure, and pressure changes before the weather does, so here it means “early read.” A thermometer only tells you how hot it is right now, so it means “reflects current conditions.” Most people who call bitcoin and silver liquidity indicators mean that these high-beta, low-cash-flow assets react to shifts in liquidity before equities, credit or the macro data do. That is: Barometer.
Thermometer is the better fit if I mean something like: they show how much speculative heat or excess liquidity is in the system right now. That is a froth gauge. “Silver at X and BTC at Y tells you how hot the liquidity bath is” would mean I use thermometer.
I guess both are fine, then! I will use barometer when I mean leading and thermometer when I mean it as a real-time / coincident indicator.
Anyway, I published a bearish tactical trade idea in NASDAQ this week. Let me share it with you here. Everything from here until the end of the “Stocks” section is excerpted from am/FX on October 7.
am/FX: Taking a shot from the bear side
Yesterday I wrote a bit that follows up on prior work I have done showing that bad breadth near the ATH is not empirically bearish. Coincidentally, Jonathan Krinsky, the esteemed technician / Managing Director at BTIG, has been writing with a lean in the opposite direction recently, highlighting his concerns about bad breadth. His work on index vs. breadth divergence has particularly focused on some market structure similarities to the 2000 bubble pop, particularly within the semiconductor universe. His 2000 vs. now SOX analog, for example, has held remarkably well through recent ups and downs.
Anyway, if you don’t subscribe to his stuff, you definitely should. He emailed me yesterday to kind of / sort of rebut what I had said about breadth—his point was that bad breadth at the ATH in isolation is not necessarily bearish, as I have shown, but bad breadth near the ATH with treasury vol near 52-week highs and HY widening should be more concerning.
I am always nervous about overparameterizing backtests and event studies in search of bearish patterns because this is an important way permabears have stayed wrong throughout the S&P 500 rally from 1000 to 8000, 2009 to 2026. If you look hard enough, you can always find a combination of variables that is in force today and was bearish in the past. But all that said—treasury vol at a 1-year high and high-yield widening are logical conditions that don’t feel like cherry picking.
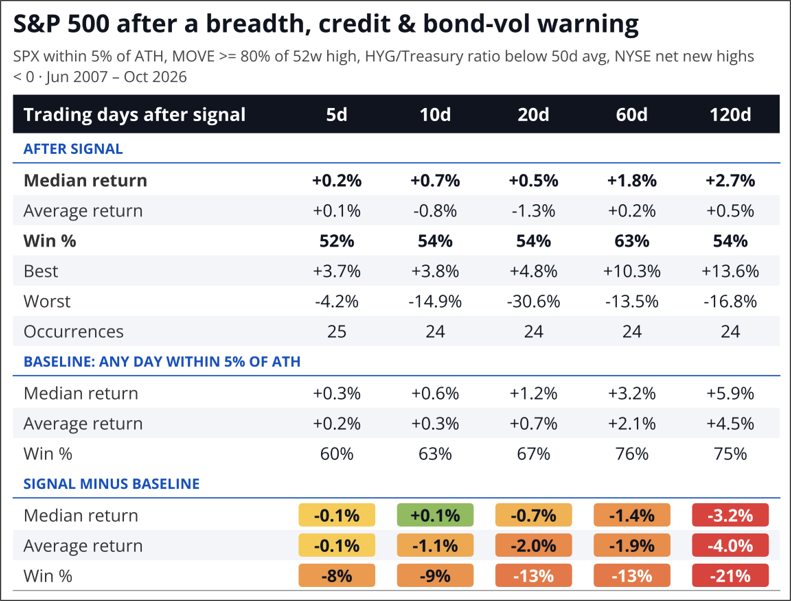
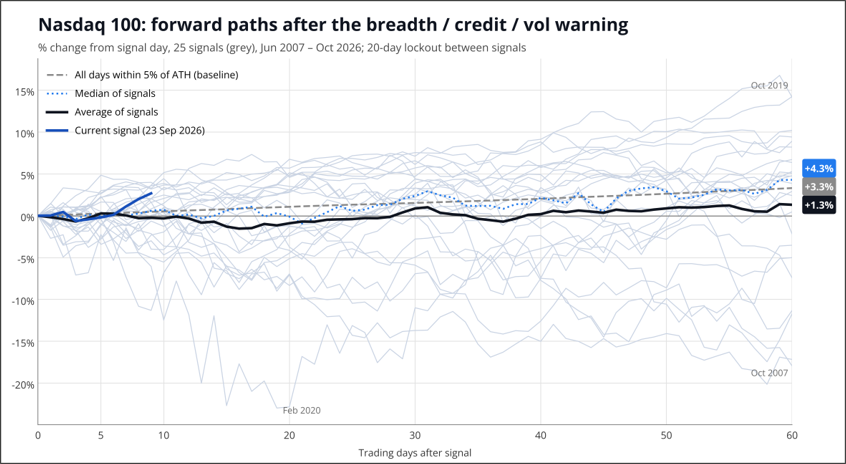
So, I ran it. Keep in mind that it is generally rare to find any backtest of initial conditions that shows bearish forward returns in an asset that has gone up eightfold over the period tested. The trend often dominates the output. So if you find something bearish without cherry picking or overtuning your parameters, it’s definitely interesting. So combining my conditions with Jonathan’s, I tested:
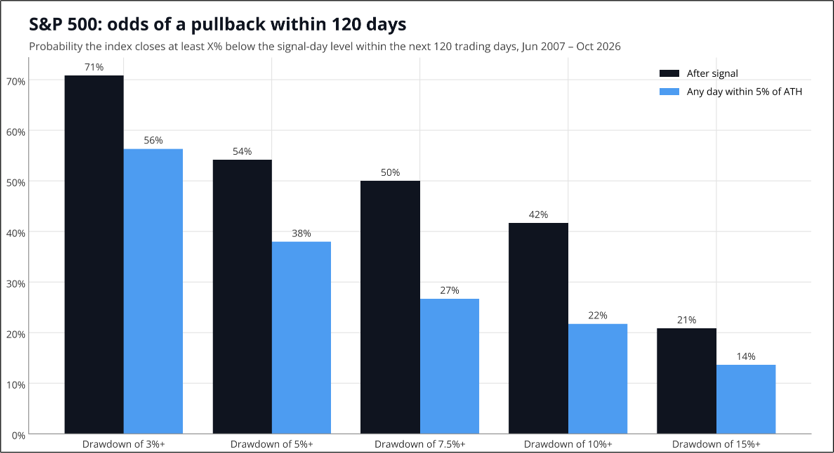
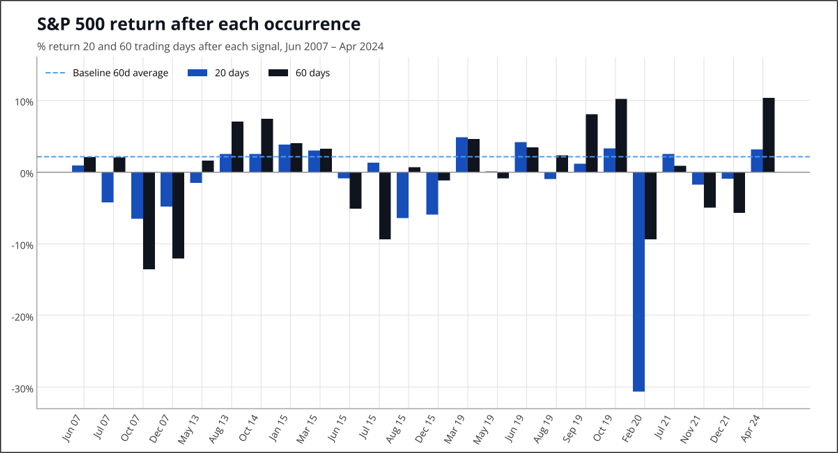
The results are convincingly bearish relative to baseline, but not outright bearish. The signal tends to precede six months of unusually weak returns.
What the results show:
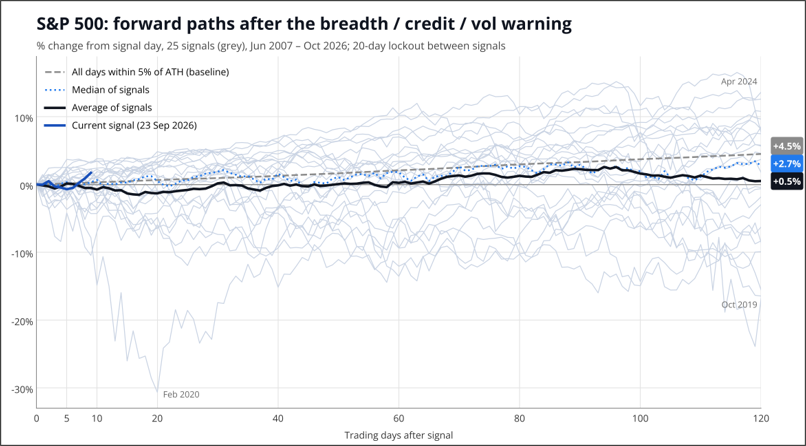
NASDAQ looks similar, naturally…
S&P correction odds after and without signal.
And one last chart to show all the results, one by one.
Conveniently, this analysis comes after a rather epic rally in QQQ, and at a time when bitcoin, silver, and gold all finally trade weak. The strength in crypto in the past week or two has made it particularly tough for me to have a bearish equity view because it indicated to me that animal spirits were still alive. Now, with the break to the ATH in stonks, tightening financial conditions, a zippy move in bonds today, this backtest, weakness in crypto, and a stellar entry point… I think this is a great time to take a shot selling QQQ. I am adding it to the sidebar.
Short at 754 with a stop 2 ATRs away at 772.55. Take profit 708.55. Risk 19 to make 45.
Not investment advice. Simply sharing my ideas. Trade your own view. Regular readers know how I roll when it comes to shorting equity indexes. I am not a permabear. I will sell here and if I get stopped out, I will move on to the next idea. I have no emotional attachment. I just think this is a great place to take a shot. Thanks to Jonathan Krinsky for taking the time to email. His points helped greatly.
Here is this week’s 14-word stock market summary:
Short because barometers/thermometers dropping, bad breadth, and high bond vol are potentially poisonous.
The Economist has intervened in the bond market. That Economist cover is close to a signal for Magazine Cover Capital, but not quite, because the cover is in the form of a question, not a directional statement. But this is pretty darned close to the exact thing bond bulls were hoping for! Funny thing is, they have also invoked Betteridge’s Law here LOLLLL.
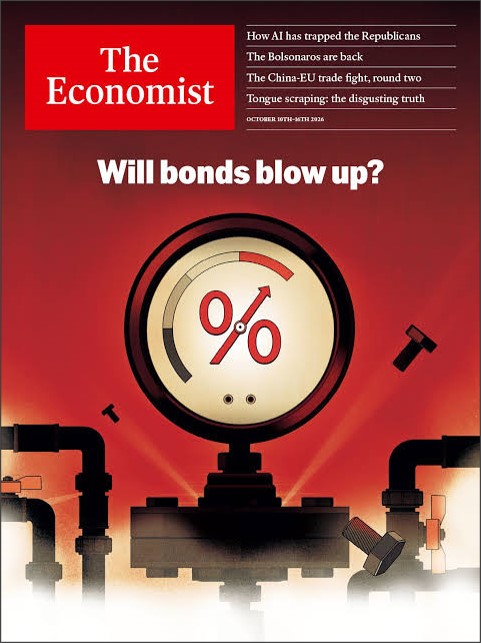
Let’s see what happens!
The euro is trending lower, but as I discussed earlier, there are some yellow flags on positioning and momentum. For example, I map 100 major macro products, including FX, and look how many USD pairs show up in the top left (USD strong) and bottom right (USD strong).
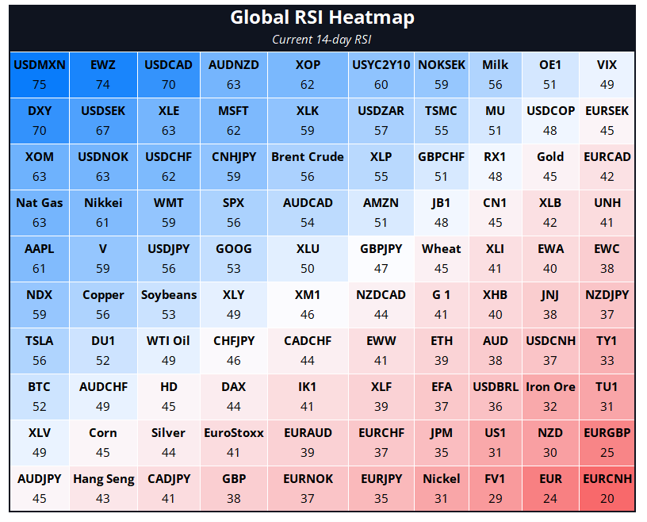
You don’t stare at this thing every day, but I do, so let me tell you that is extremely unusual to see so many FX pairs in the corners, and even more unusual that they are all saying the same thing.
Here’s another view of positioning, via the Spectra FX Weekly Positioning and Momentum Report. The scores run from -10 to +10 but due to averaging and methodology, anything at 5 or 6 is very high.
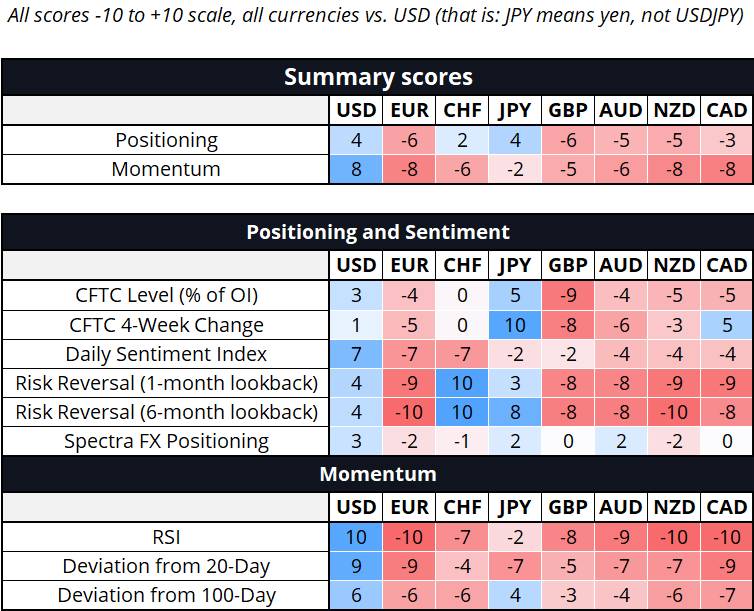
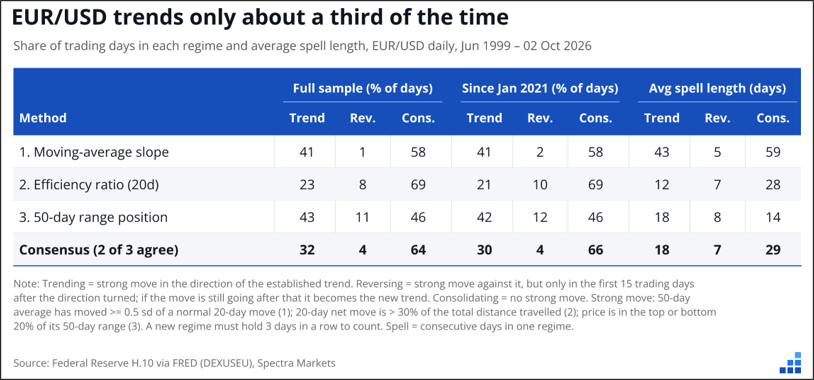
But positioning is just one piece of the puzzle and the macro story hasn’t changed and so again we get a consolidation view here, not a reversal view. Trends and epic reversals are the most fun to trade but consolidation often prevails for longer than some people can remain focused and/or solvent. Here’s a breakdown of trend, reversal, and consolidation regimes (Trend, Rev., Cons.) according to three different methods. You can see we are consolidating about 65% of the time. You can’t just position for trends or reversals all the time. You also have to be set up correctly to either profit from, or at least survive consolidations.
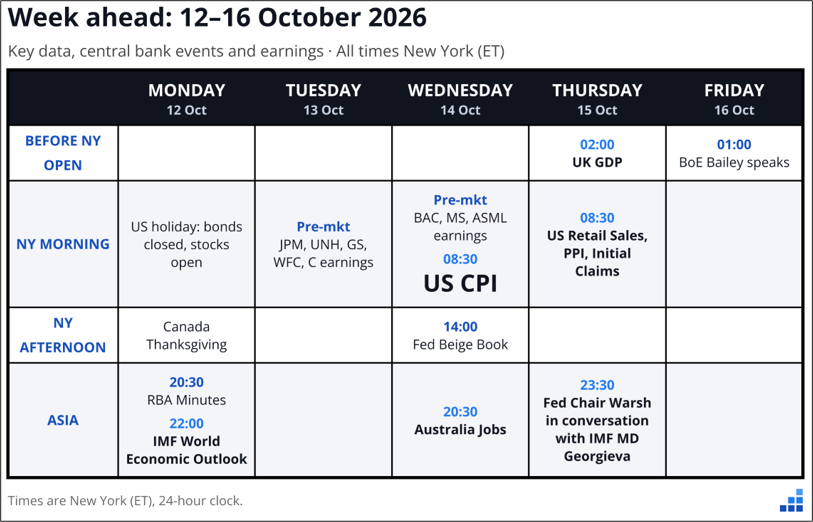
Here’s next week’s calendar.
HEY! If you’ve read Trade Outside the Box – please click here to leave a quick review. Thanks! And if you have not… Buy it here:
TRADE OUTSIDE THE BOX: Advanced Thinking for Professional Traders.
Here’s the one-pager.
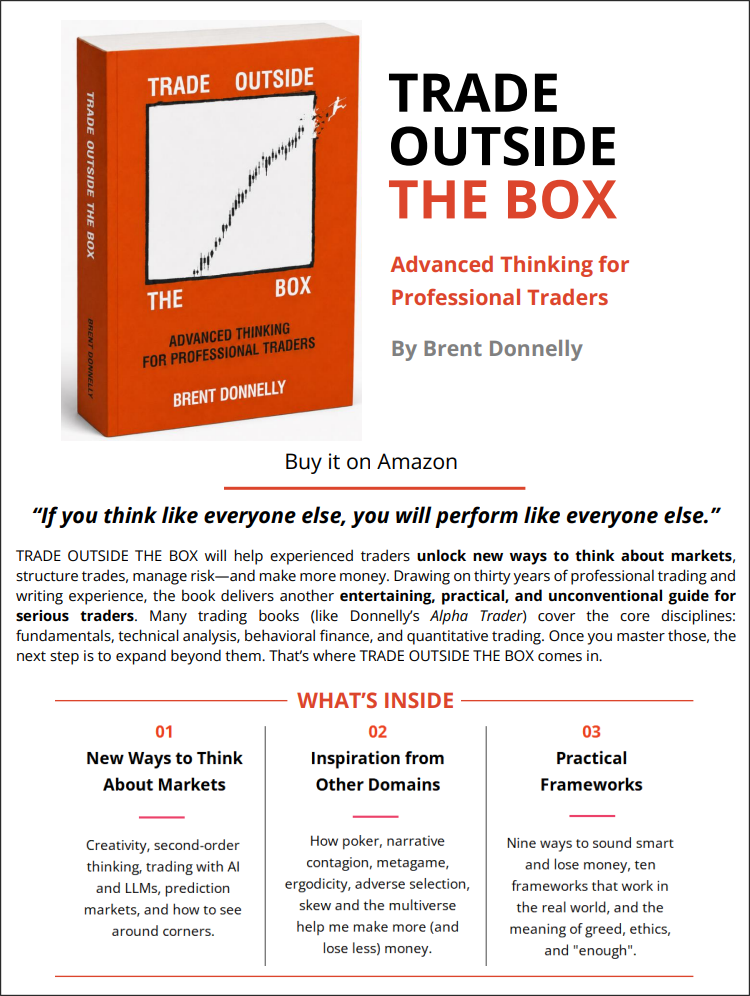
The book is written for experienced traders. If you are new to the game, I would suggest you start with Alpha Trader. If you have been trading or investing for more than five years, this book is for you (and you don’t need to have read Alpha Trader to enjoy it).
Big FUD this week from Justin Drake. Thanks CR for sending. This is a useful read because not only is it relevant to crypto, but it’s worth keeping in mind that AI is going to do some weird and crazy stuff in the next year or two and might be hacking and cracking bank accounts and Google search histories and all kinds of other things people thought were secure.
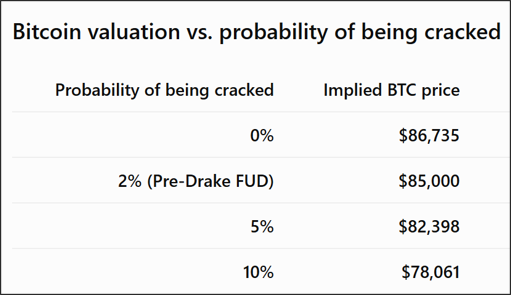
If you assume the market price was correct at 85,000 and there was a 2% probability of a crypto crack priced in before the FUD, you can re-estimate the new fair value as I did above. To be clear: the conditional value assuming no crack is held constant as I recalculate fair value. The grid is a decent simulation of what actually happened this week, imo. Obviously the 85k is arbitrary, I’m simply trying to see the delta as you move the slider on the crack %.
Here’s a Coinbase guy pushing back on the Justin Drake FUD.
Gold cannot be cracked. It’s a thing. There is always a non-zero risk that various types of cryptography are cracked somehow, whether it’s AI or quantum or whatever. Better to have a fertile imagination right now as we are unleashing an alien intelligence into the world, with almost no supervision, and some bad actors are going to train it on the honey pots.
The FUD this week killed the Siamese Bart formation and now bitcoin is back down but not close to out. Meanwhile, the ZEC move from $40 to $1700 in less than a year finally ran out of steam for now.
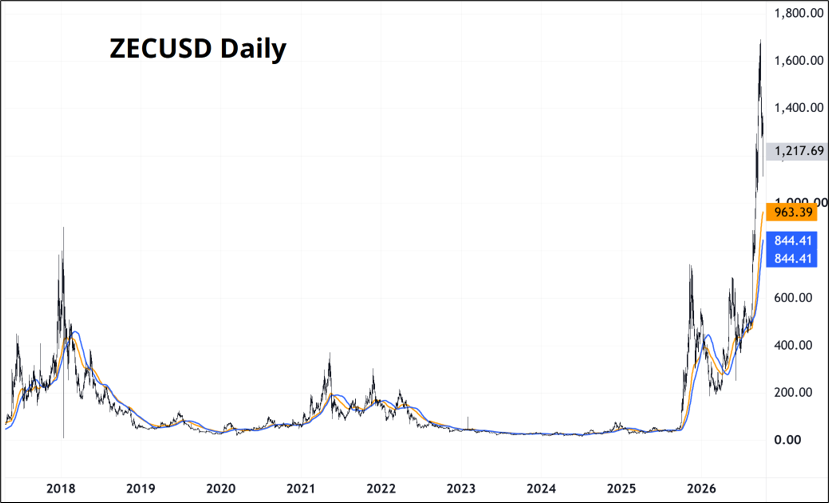
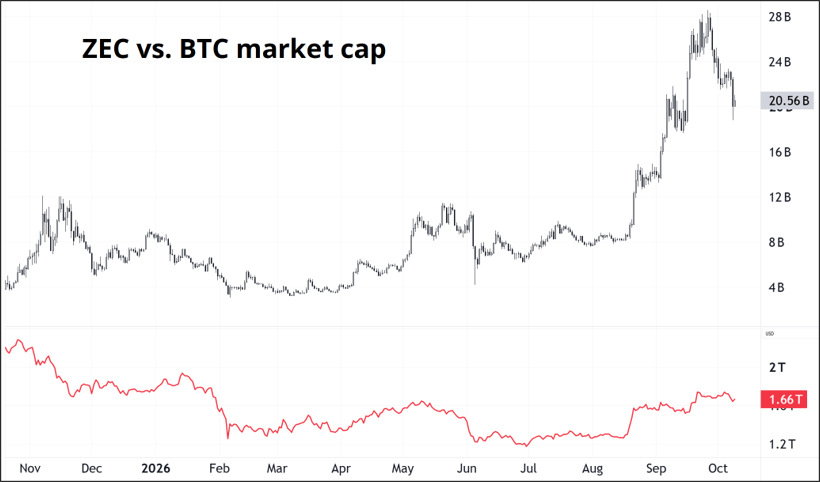
Like Bitcoin, Zcash (ZEC) has a maximum supply of 21 million coins, uses proof-of-work, and follows a halving schedule. Its main differentiator is the use of zero-knowledge proofs, which allow users to conduct transactions without publicly revealing the sender, recipient, or amount, while still allowing the blockchain to verify that the transaction is legitimate. Unlike Bitcoin, where transactions are publicly traceable, Zcash offers both transparent and private (“shielded”) transactions. In short, BTC is a bet on digital scarcity; ZEC is a bet on digital scarcity plus financial privacy.
Given the rise of the global plutocracy and aggressive but often fruitless attempts to tax them, the Zcash use case is pretty obvious! The ZEC bulls look at this chart and salivate. Top one has a B on the y-axis. Bottom one has a T.
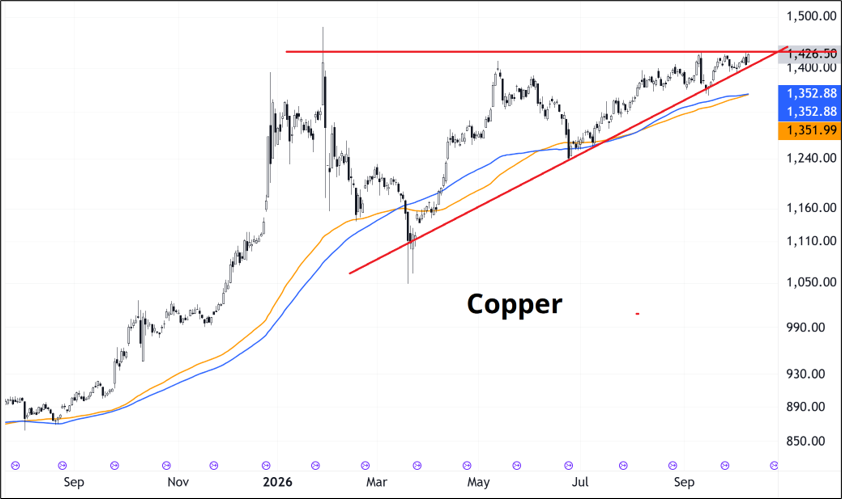
Copper is making an epic triangle and has been doing so for a few weeks.
Oil could get scary again soon but is still in familiar territory.
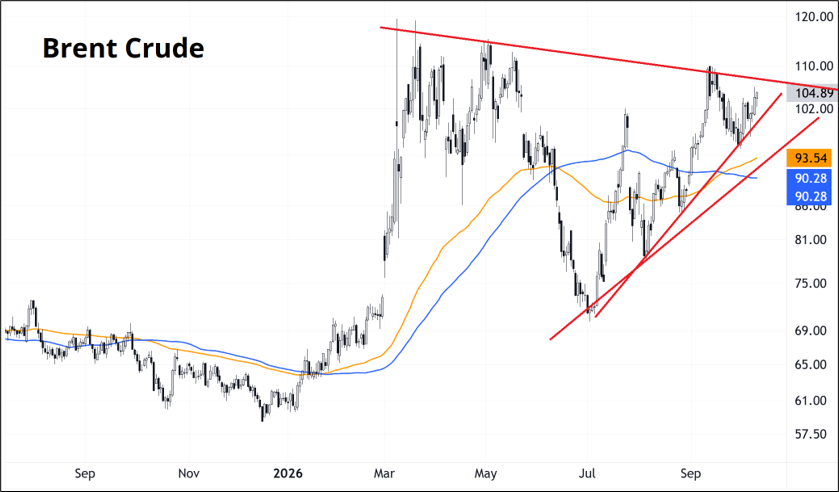
Triangles usually lead to vol compression as realized (pretty much by definition) contracts as the ranges get smaller. As the apex approaches, that can sometimes be a good time to buy vol because ranges expand on the breakout and realized vol rises. I don’t trade triangles systematically, but as an apex approaches, this happens:
That’s it for this week.
Get rich or have fun trying.
*************
My good friend Ramiro López Larroy has just published a book about practical Buddhism. I have read it, and I think it’s excellent. It is mostly about real life, but some of the concepts are applicable to trading, too. It’s short (136 pages) and well worth your time.
Ten Ways to Awaken: A Contemporary Guide to Finding the Way
https://www.amazon.com/dp/B0HF6SZ49B
*************
Old school hip hop house DJ set from Egyptian Lover
*************
Now let’s check in to see how late capitalism is working for everyone…
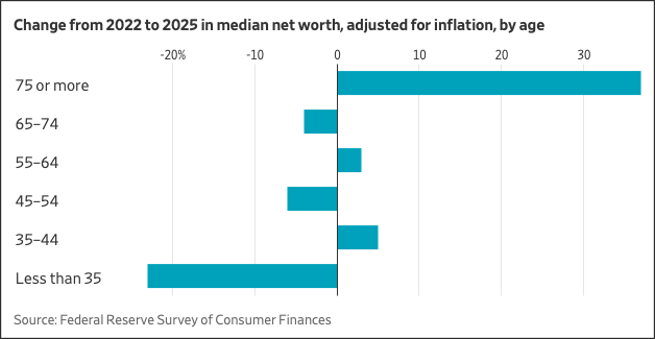
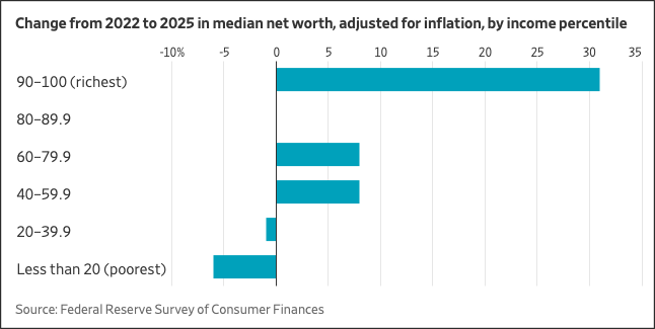
We need a new term. Trickle-up economics? Gerontoplutocracy! The plutogeriatric economy. Golden geezers. I could go on. There it is again, that funny feeling. That funny feeling.
*************
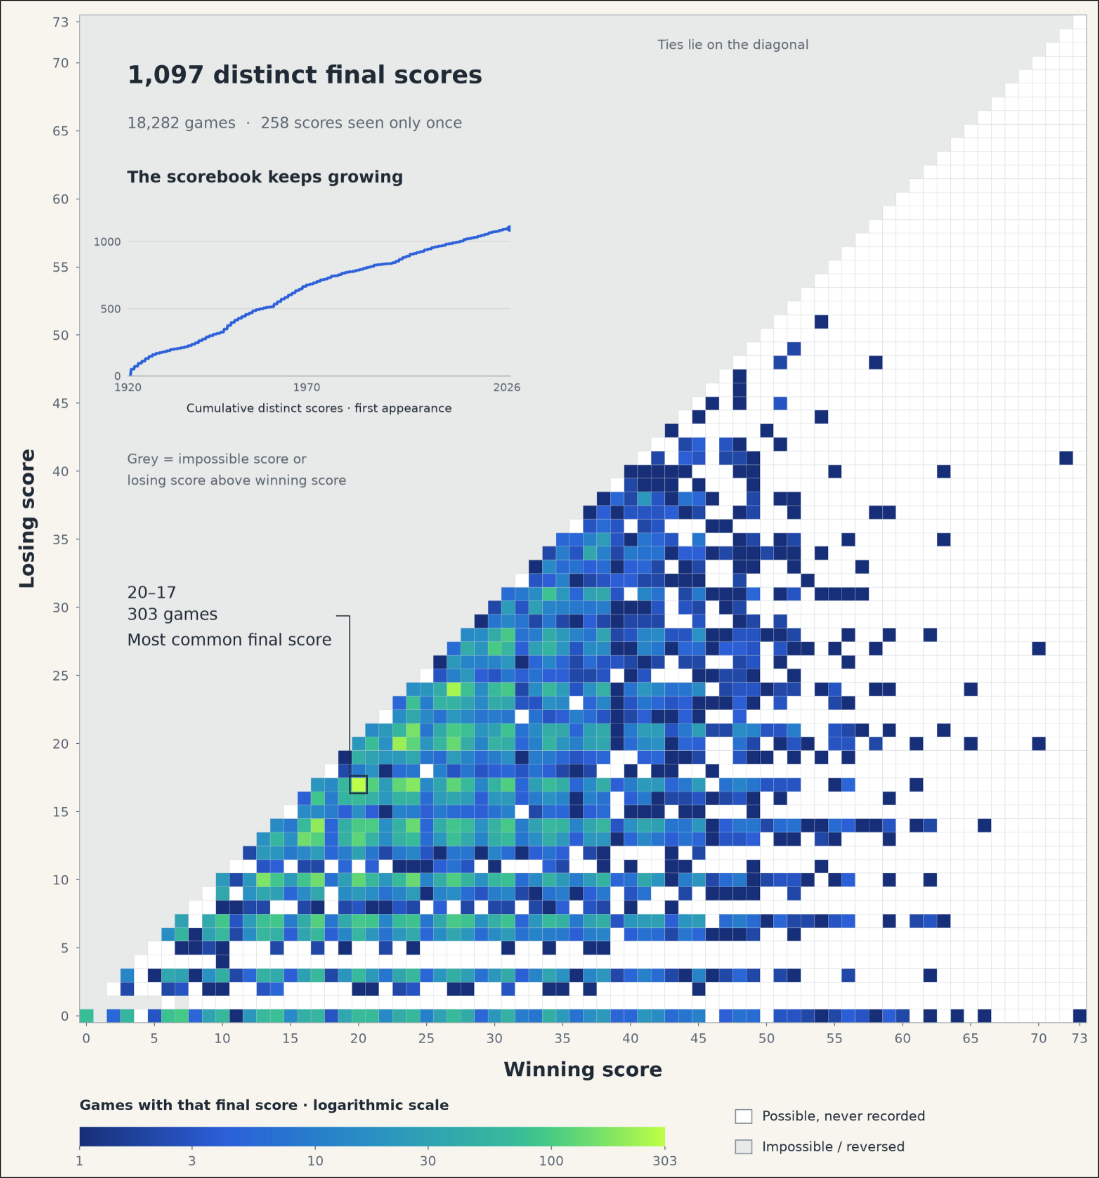
Every score in the history of the NFL including the 73-0 playoff game in 1940.
*************
Here is a short and informative WSJ podcast on how Google AI products short-circuit student learning. Via GM.
Staying on the education theme, a clever bit from the Onion via the inimitable Adam Donnelly. Contains some offensive vocabulary. The execution and acting here is SOOOO good.
Are Tests Biased Against Students Who Don’t Give a Sh*t?
*************
A sort of almost funny and short academic paper that is logical.
*************
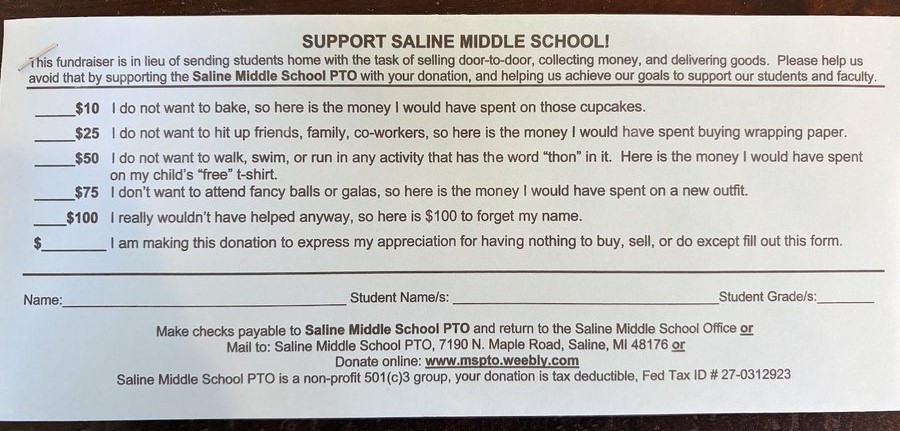
Real:
*************
Thanks for reading the Friday Speedrun! Sign up for free to receive our global macro wrap-up every week.