
The immaculate disinflationary landing remains as the data points to continued falling inflation around the world with robust employment and demand.

Here’s what you need to know about markets and macro this week
Global Macro
The immaculate disinflationary landing remains the big story as the data points to continued falling inflation around the world but non-disastrous outcomes in employment and demand. For now, at least! People like to say there are no soft landings but we got most of one in 2019 before COVID, and we got a full on soft landing in 1995 and therefore it’s possible, if improbable.
Things are feeling a lot more like 2018/2019 these days as the Fed is now starting to ratify the market’s dreams of rate cuts on a tradeable time horizon. This snippet from Waller is the key point of the week because he is seen as a leading intellectual voice on the Fed and Powell was offered an opportunity to push back today and did not.
That was a major, important statement by a voice who is almost 100% signal and 0% noise at the Fed. And then JPOW didn’t slap it back. So the base case is becoming more and more like 2019.
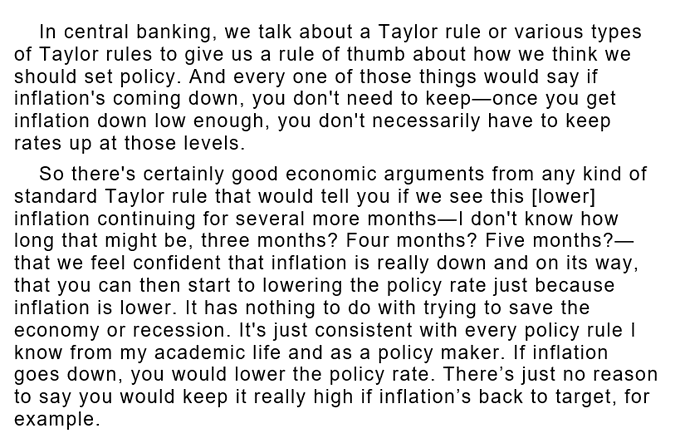
Since the summer of 2023, the FinTwits and commentariat has been aggressively worried about the runoff in US excess savings. Then, there was a revision to the data and some more wire got added to the fuse that counts down the “tapped out consumer time bomb.” Here is how the San Francisco Fed presented it.
Cumulative aggregate excess savings
It’s not clear to me why a return to pre-pandemic levels would mark the death of the US consumer. It should just mark a return to 2019 levels of savings and spending and possibly a return to that sort of OK-but-not-booming economy. The old new new old new normal or whatever. It’s not controversial to say that the economy from 2020 to 2023 was an aberration unlike anything you or I have ever seen.
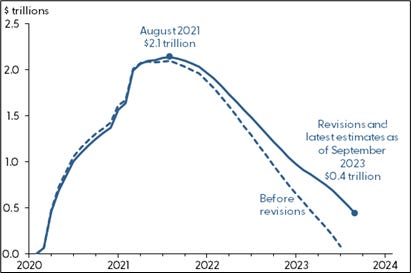
It is more controversial to just assume we are going back to the 2010s stagnation regime because there have been some huge changes in the world, like reshoring, supply of labor, wage expectations, and so on. Then again, the primary drivers of lowflation in the 2010s were technology and demographics. Technology is accelerating with AI likely to be deflationary, and US demographics are struggling to get back to pre-COVID.
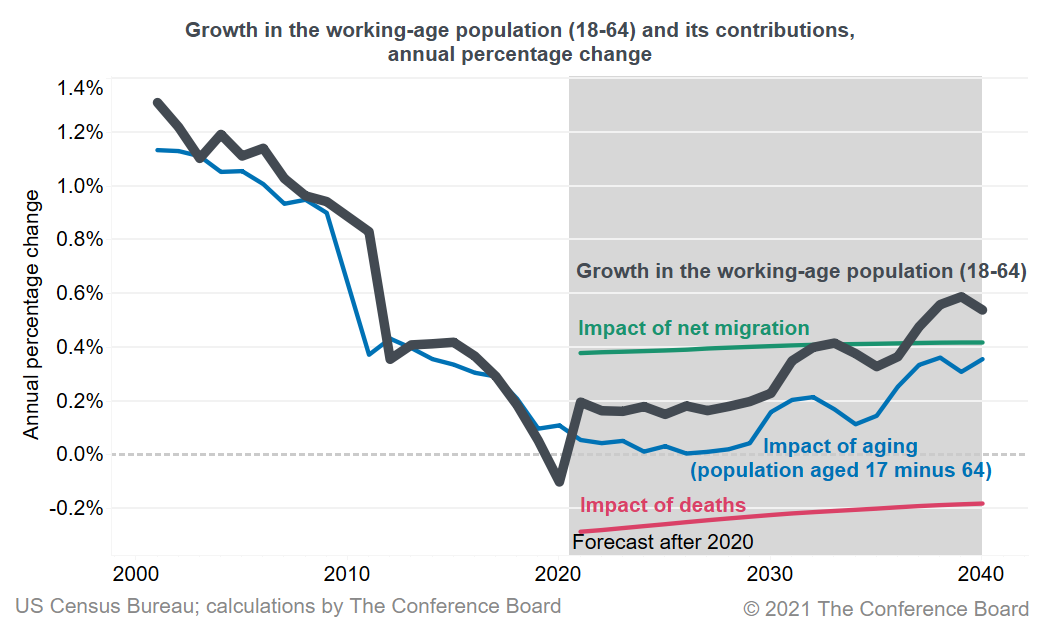
A return to pre-2019 secular stagnation or something similar but less extreme, is a scenario that is underpriced, underappreciated, and underdiscussed. If you look at where things are now vs. 2019, there are more similarities than differences in many cases. I made a huge grid to summarize it all.
A one-time increase in money supply and a COVID shock created the inflation spike of a lifetime, but now the money shock is over, supply chains are back online, shipping costs are collapsing, commodities are stable, labor supply is returning, and things look more to me like 2019 than 2021 or 2022.
The good news is that with economic volatility falling fast, the YoY numbers for 2024 won’t be polluted by nearly as many base effects. A huge drop in yields in 2024 should be on everyone’s bingo card, at least.
Stocks
A disinflationary boom is bullish for stocks. That is what is now slowly getting priced in and so the question now becomes whether or not it’s fully priced or there’s still more room. Equity seasonality is super bullish in December on year-end flows and fund managers are going to want to show they own the winners at year end, even if they whiffed all year. Much as they dumped megatech at the end of last year on forced liquidation around tech unwinds, they will be forced to buy this year as money chases performance into year end. This is the silliness of performance chasing: Sell low, buy high.
By the way, SPX has followed the average seasonal path perfectly. Here’s the chart. It’s a looker! If you want to receive seasonals in advance, make sure you buy the 2024 Spectra Trader Handbook and Almanac. It’s a trading assistant and day timer in one. Nice.
SPX 2023 performance (red, right y-axis) vs. average path since 1995
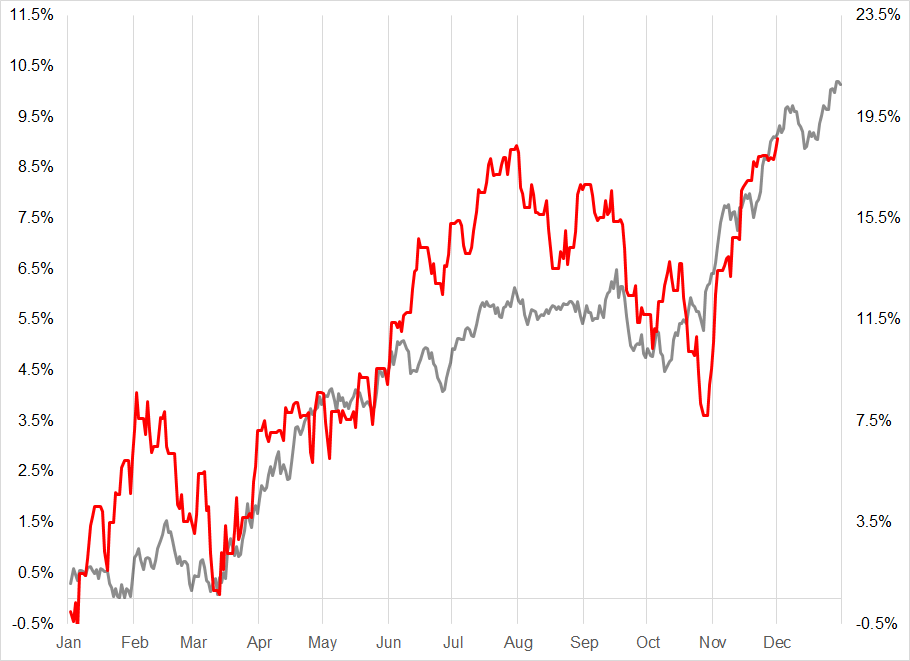
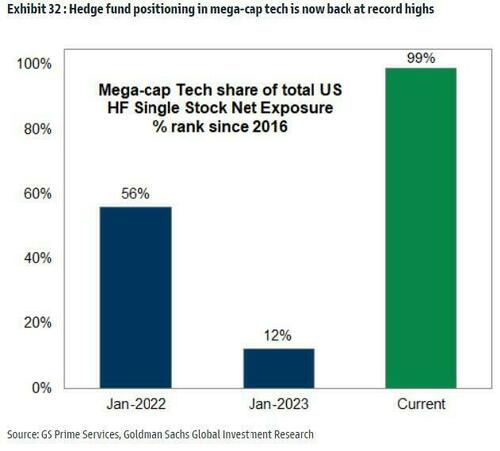
While Goldman data shows megatech longs are in the 99th percentile, I wouldn’t be fading that until the turn of the year. There are too many bullish forces in play right now as technicals, positioning, seasonality, momentum, and macro all look super bullish.
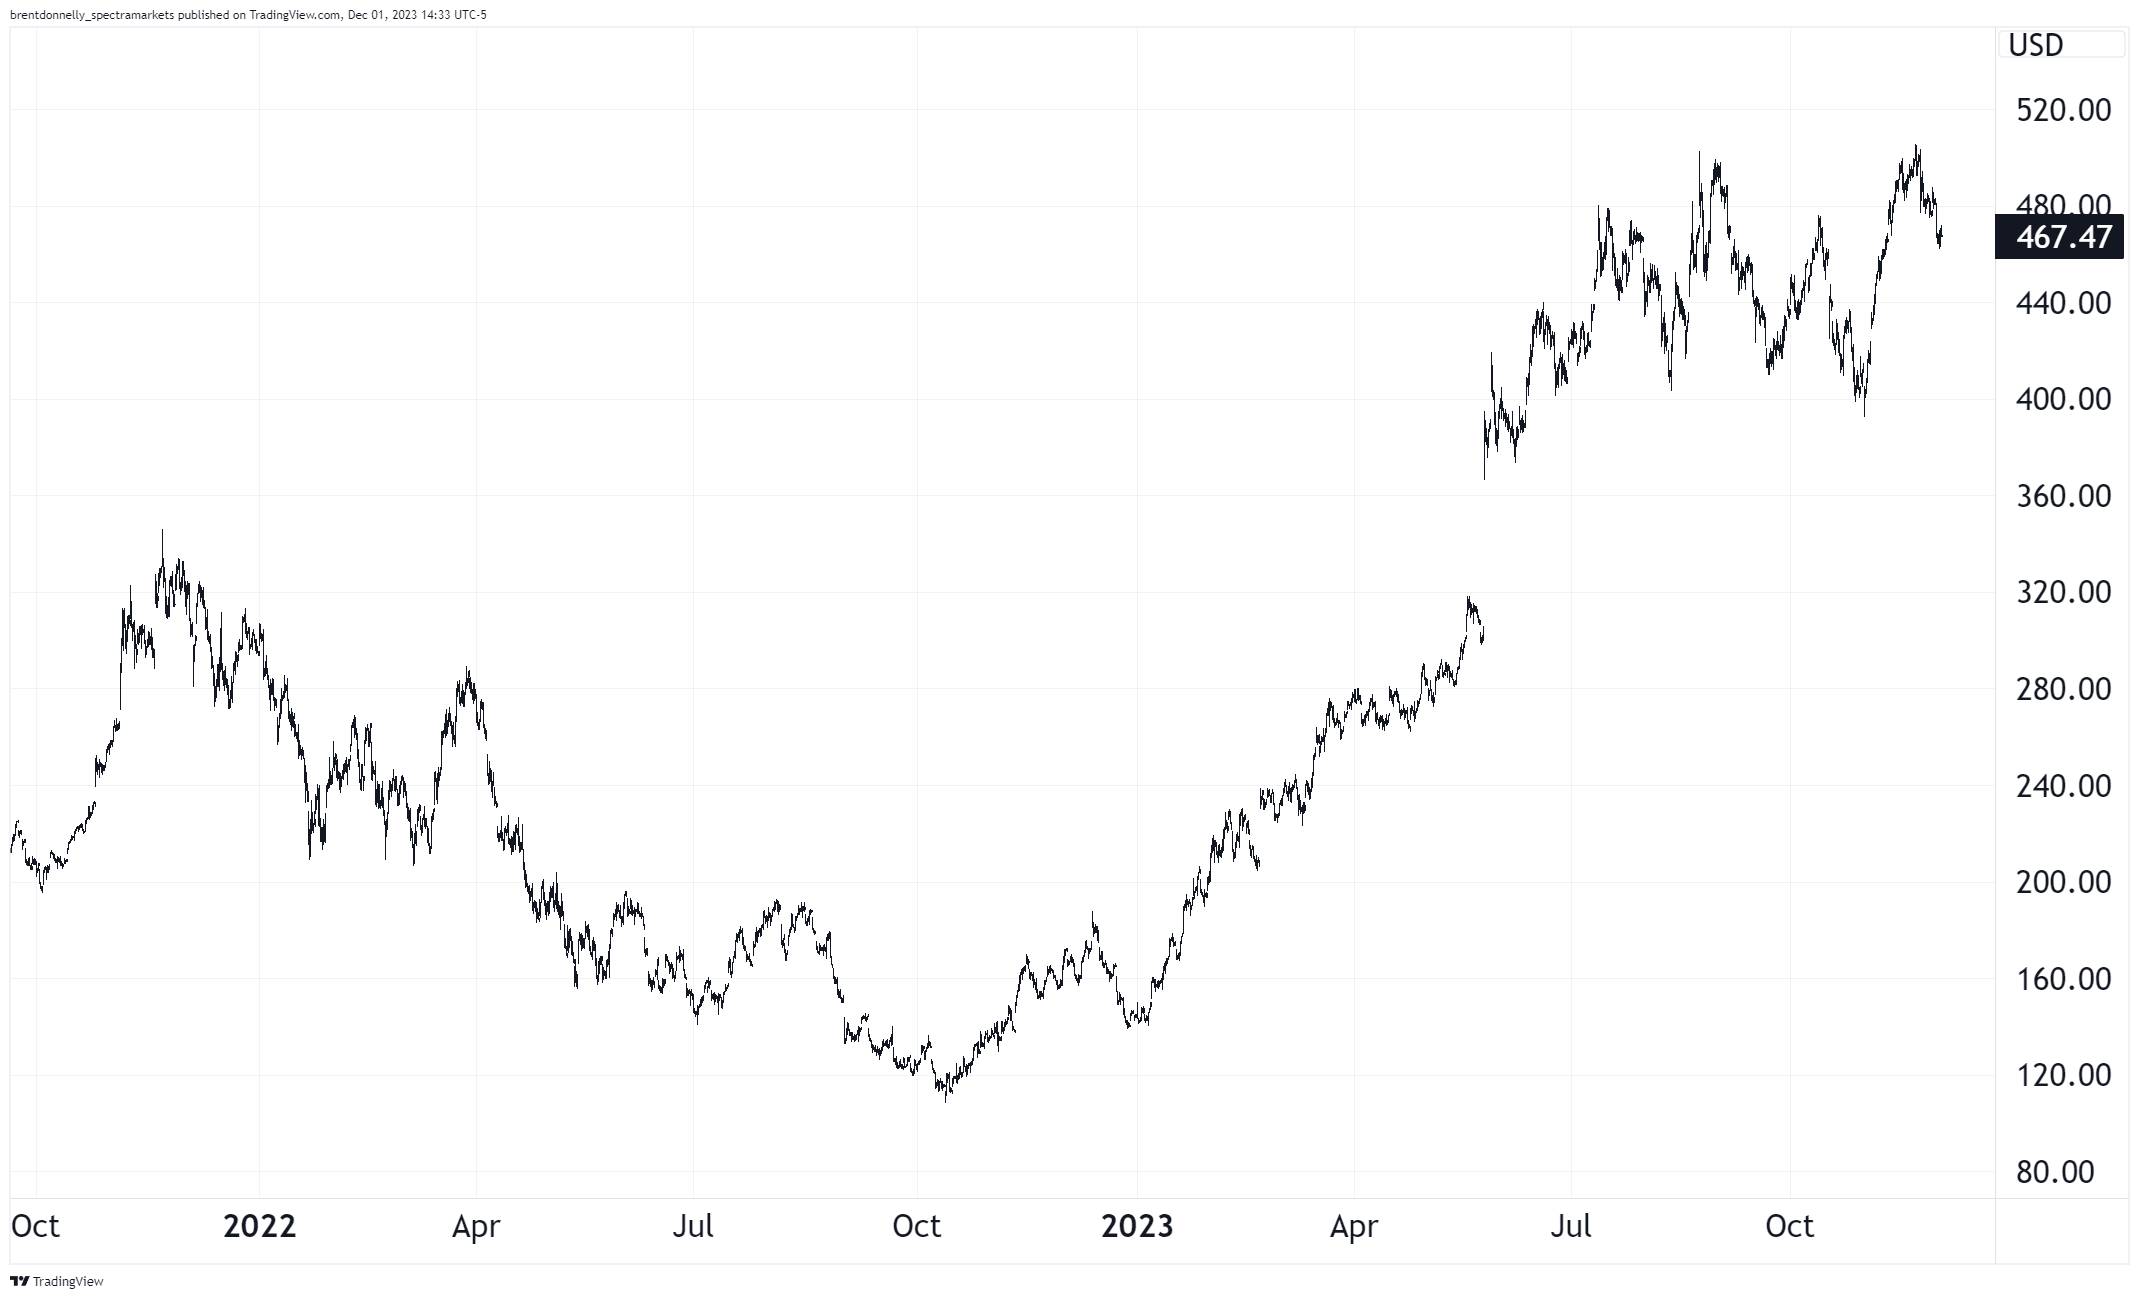
Interesting(ish) to me is that NVDA cannot break 500 despite a roaring equity rally, loose financial conditions, and a crypto boom. This is a good stock to keep on your radar as a short in January but no shorts for me right now! A lot of good news is priced in, stocks are near major resistance, but there is very little selling likely to come in the next four weeks. Long stocks was a much easier trade a few weeks ago. Now, I could see how long or flat both make sense.
NVDA hourly chart back to late 2021
Here is this week’s 14-word stock market summary: Waller says jump and stocks say “How High?” Don’t fight the tape in December.
Interest Rates
Yields keep on tanking. Bond shorts got overconfident just as the economic data, US Treasury, and Federal Reserve all piled on to trigger a massive reversal. If yields have made their cycle highs right on the 5% round numbers… The fall could be much steeper and faster than most expect. As a general rule, interest rate cycles in most countries happen faster and more violently than anyone expects.
The hiking cycle was way faster than the market priced, and the cutting cycle will probably be similar.
One way to estimate where a market might go after a major regime shift / reversal is to look at symmetry. If something can go up X in Y amount of time, it’s rational to believe that it might also go down X in Y amount of time. That’s often how markets work because volatility can remain constant enough that symmetry is achieved.
Here’s an example:
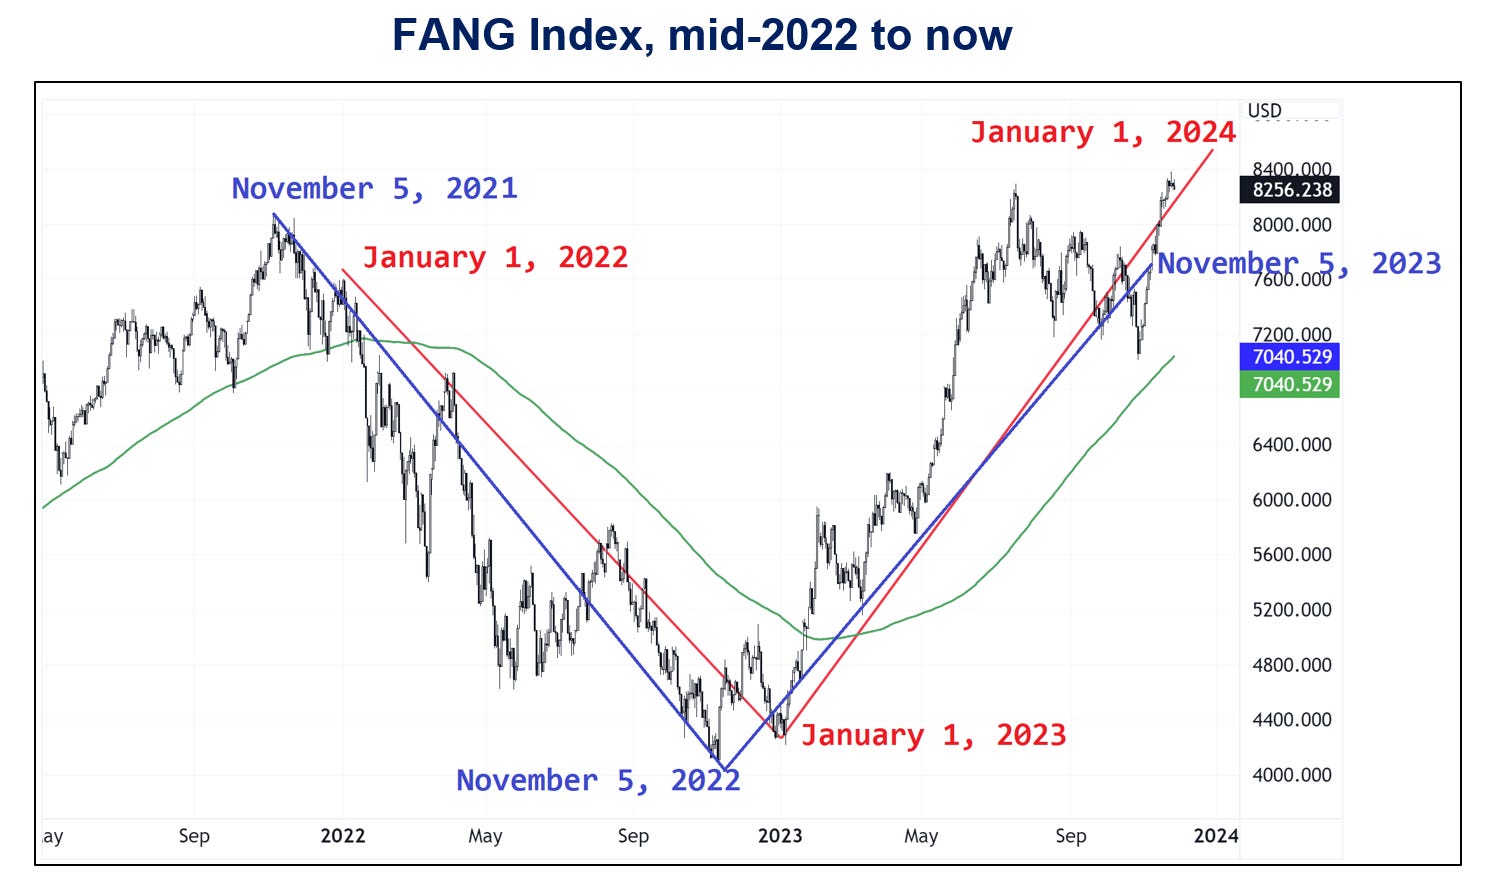
One year down, one year up! So if we apply symmetry to US yields, but assume we are not going back to a zero rates regime or total collapse of the economy… We might come up with something like this:
US 10-year yield, late 2021 to now
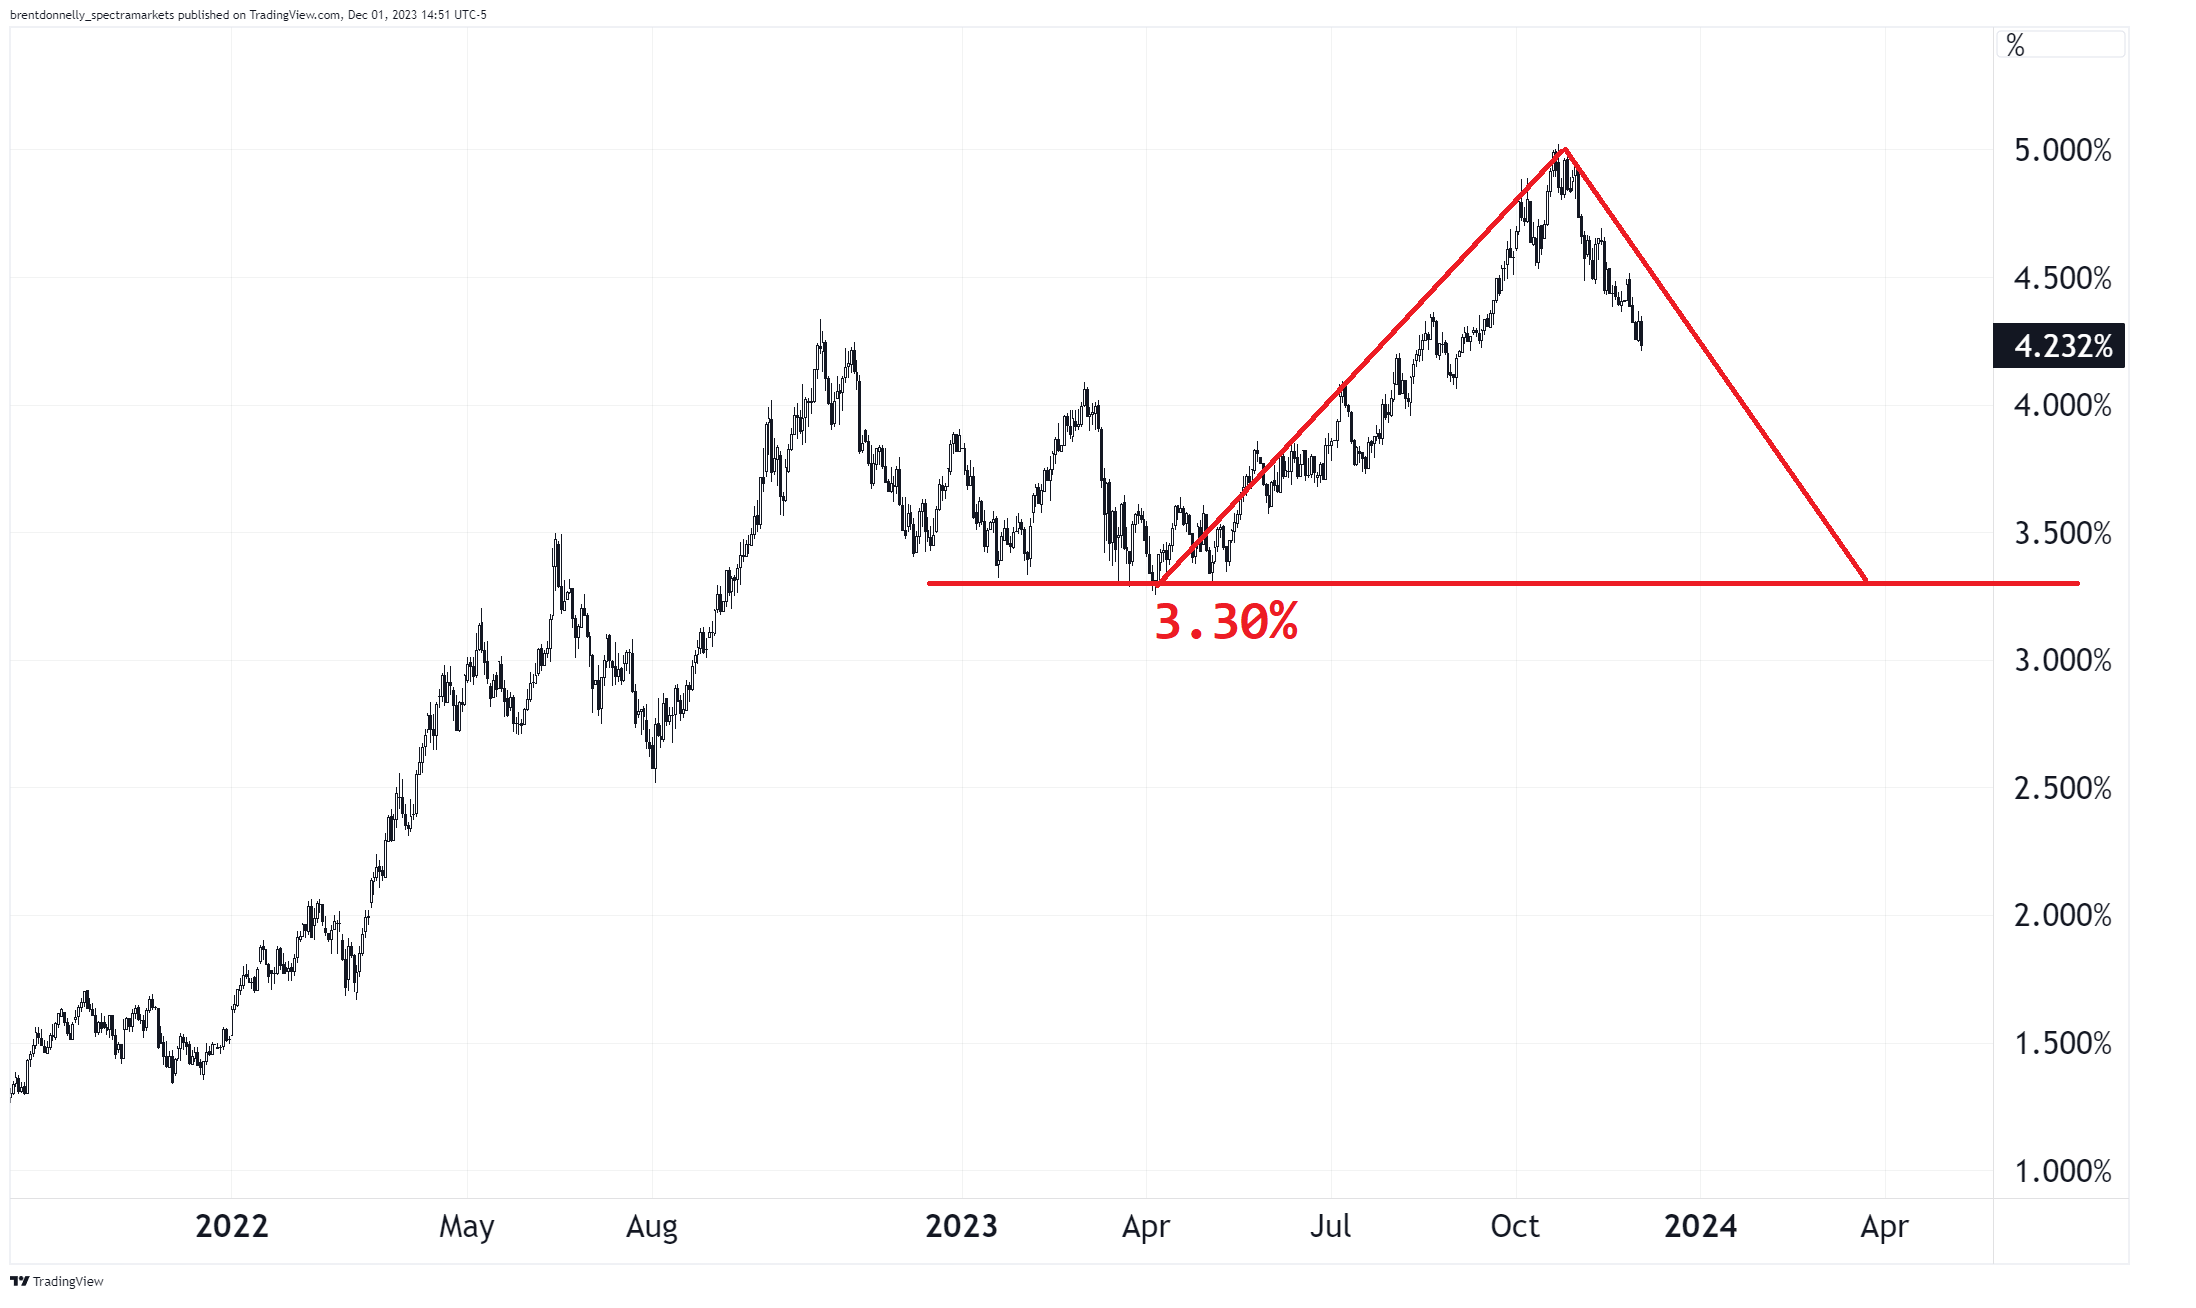
This might seem like sorcery or numerology or whatever, but it’s not. It’s simply an assumption of stable volatility and a similar slope of trend. And it happens very often because markets very often tend to operate symmetrically. This would suggest 3.30% in 10s by April. That’s an aggressive target but if GDP is printing sub-2% and 3-month annualized inflation is below 2% in Q1, it’s possible. The market always thinks too much is priced in and yet rarely is too much priced in ever, in any cycle.
Fiat Currencies
The turn in the dollar has coincided with the turn in global yields, and that makes sense. But there is much more nuance here because if the Fed is cutting in Q2 2024, the ECB will probably be cutting more. Inflation in Europe is in freefall and their economy is not strong. The ECB could be facing below-target inflation before Major League Baseball season opens in April 2024.
The lower inflation, crappy growth story in Europe has been capturing a lot of attention this week as many well-known Europe experts (Jens, Alf, and George, for example) have been talking up the prospects of European weakness in 2024. The market has decimated the EUR crosses this week in response to rapidly repricing ECB expectations
Hourly charts this week. Goodnight euro…
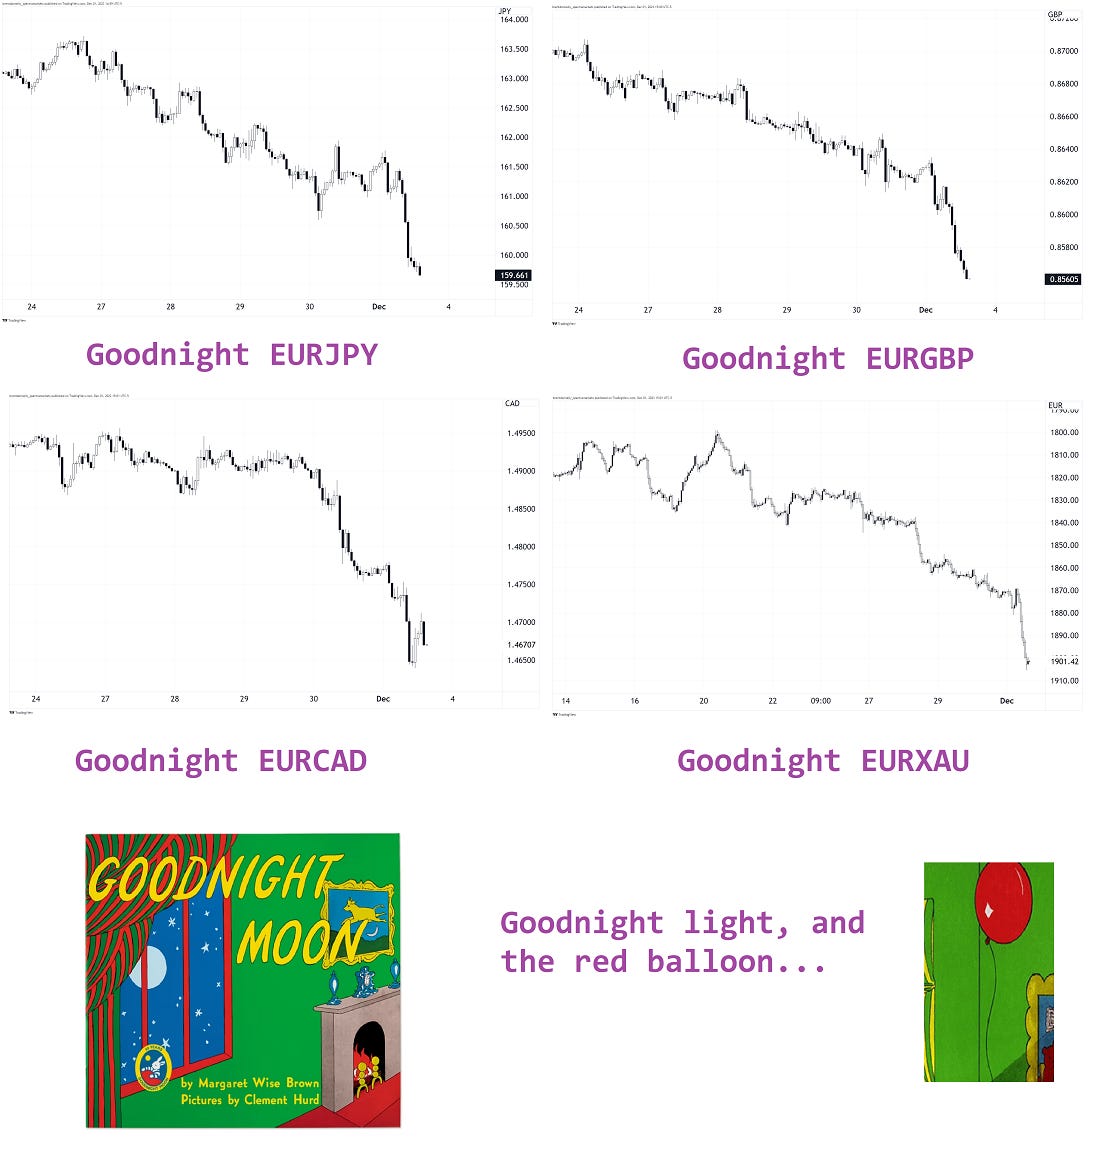
The path of least resistance is lower USD and lower EUR as global yields continue to fall. Payrolls next week will be important, but it will take a lot to knock back these disinflationary boomtype vibes.
Crypto
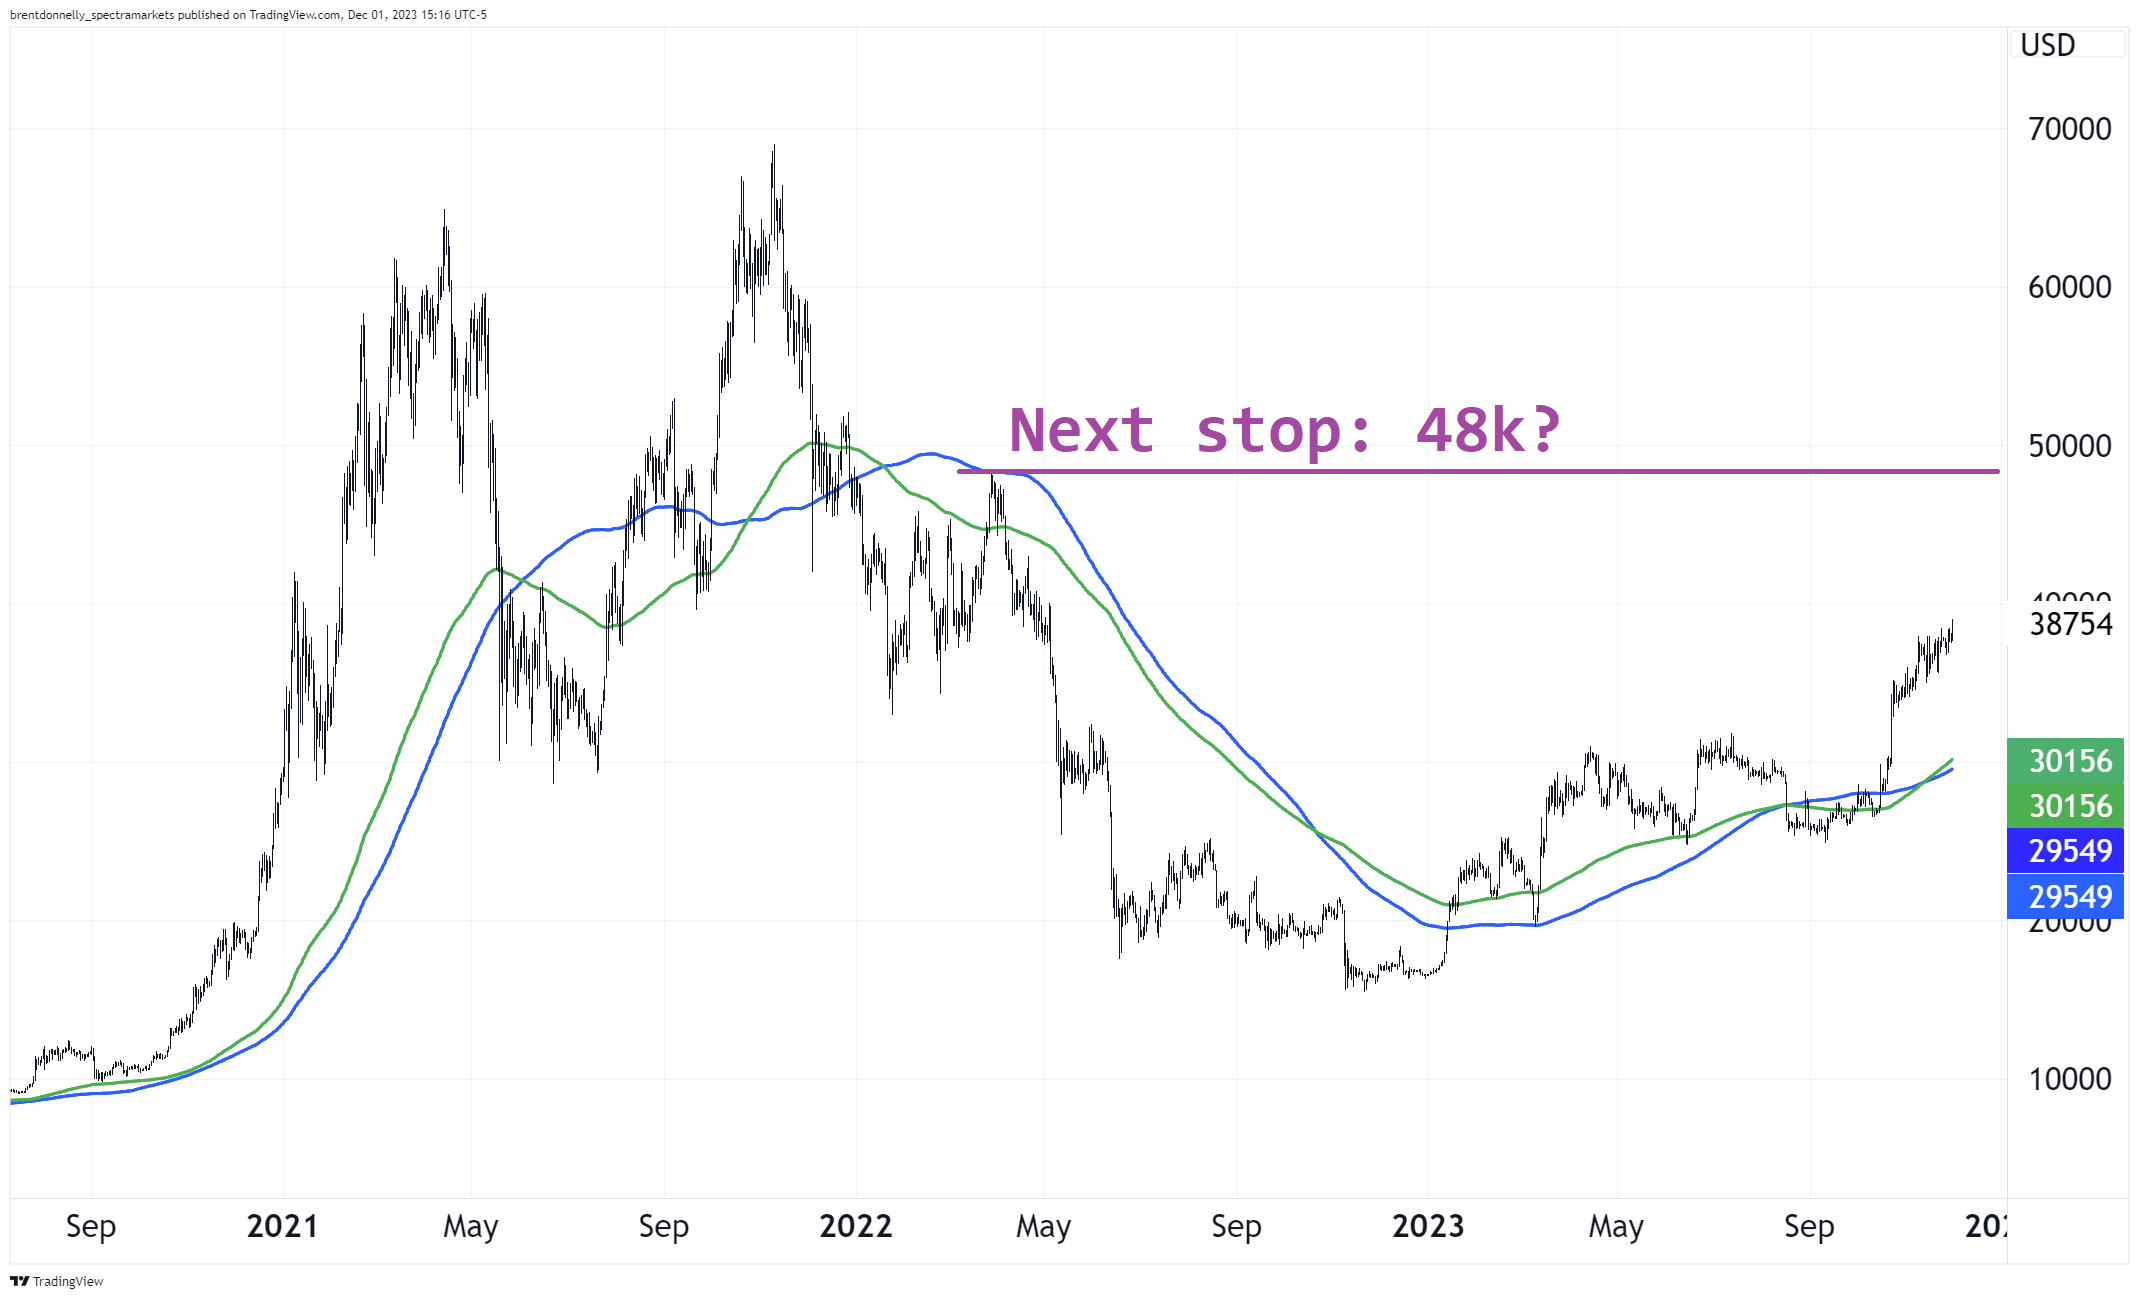
Michael Saylor is perhaps the happiest man in the world right now as he continues to hoover up all the bitcorns. While his average price isn’t that far off current spot, he’s gone from Atlantian underwaterness to something more like the Galapagos now and MSTR, the scoreboard on his life’s videogame, is spinning higher. The greatest moral hazard trade of all time flirted with annihilation post-SBF and is now back like Lazarus.

There was some concern that a bitcoin ETF would make MSTR less useful as a bitcoin proxy but the truth is that they own a ton of BTC and so while the premium on MSTR can fall as people substitute out of it and into the inevitably coming soon BTC ETF, the underlying asset is more important than the basis—and it’s rising.
We are back in a world where there is a shortage of assets to buy as the money sloshing around the system remains tsunami-like despite 2022’s low tide event and so people are gobbling up anything that moves. That includes crypto.
Bitcoin Daily
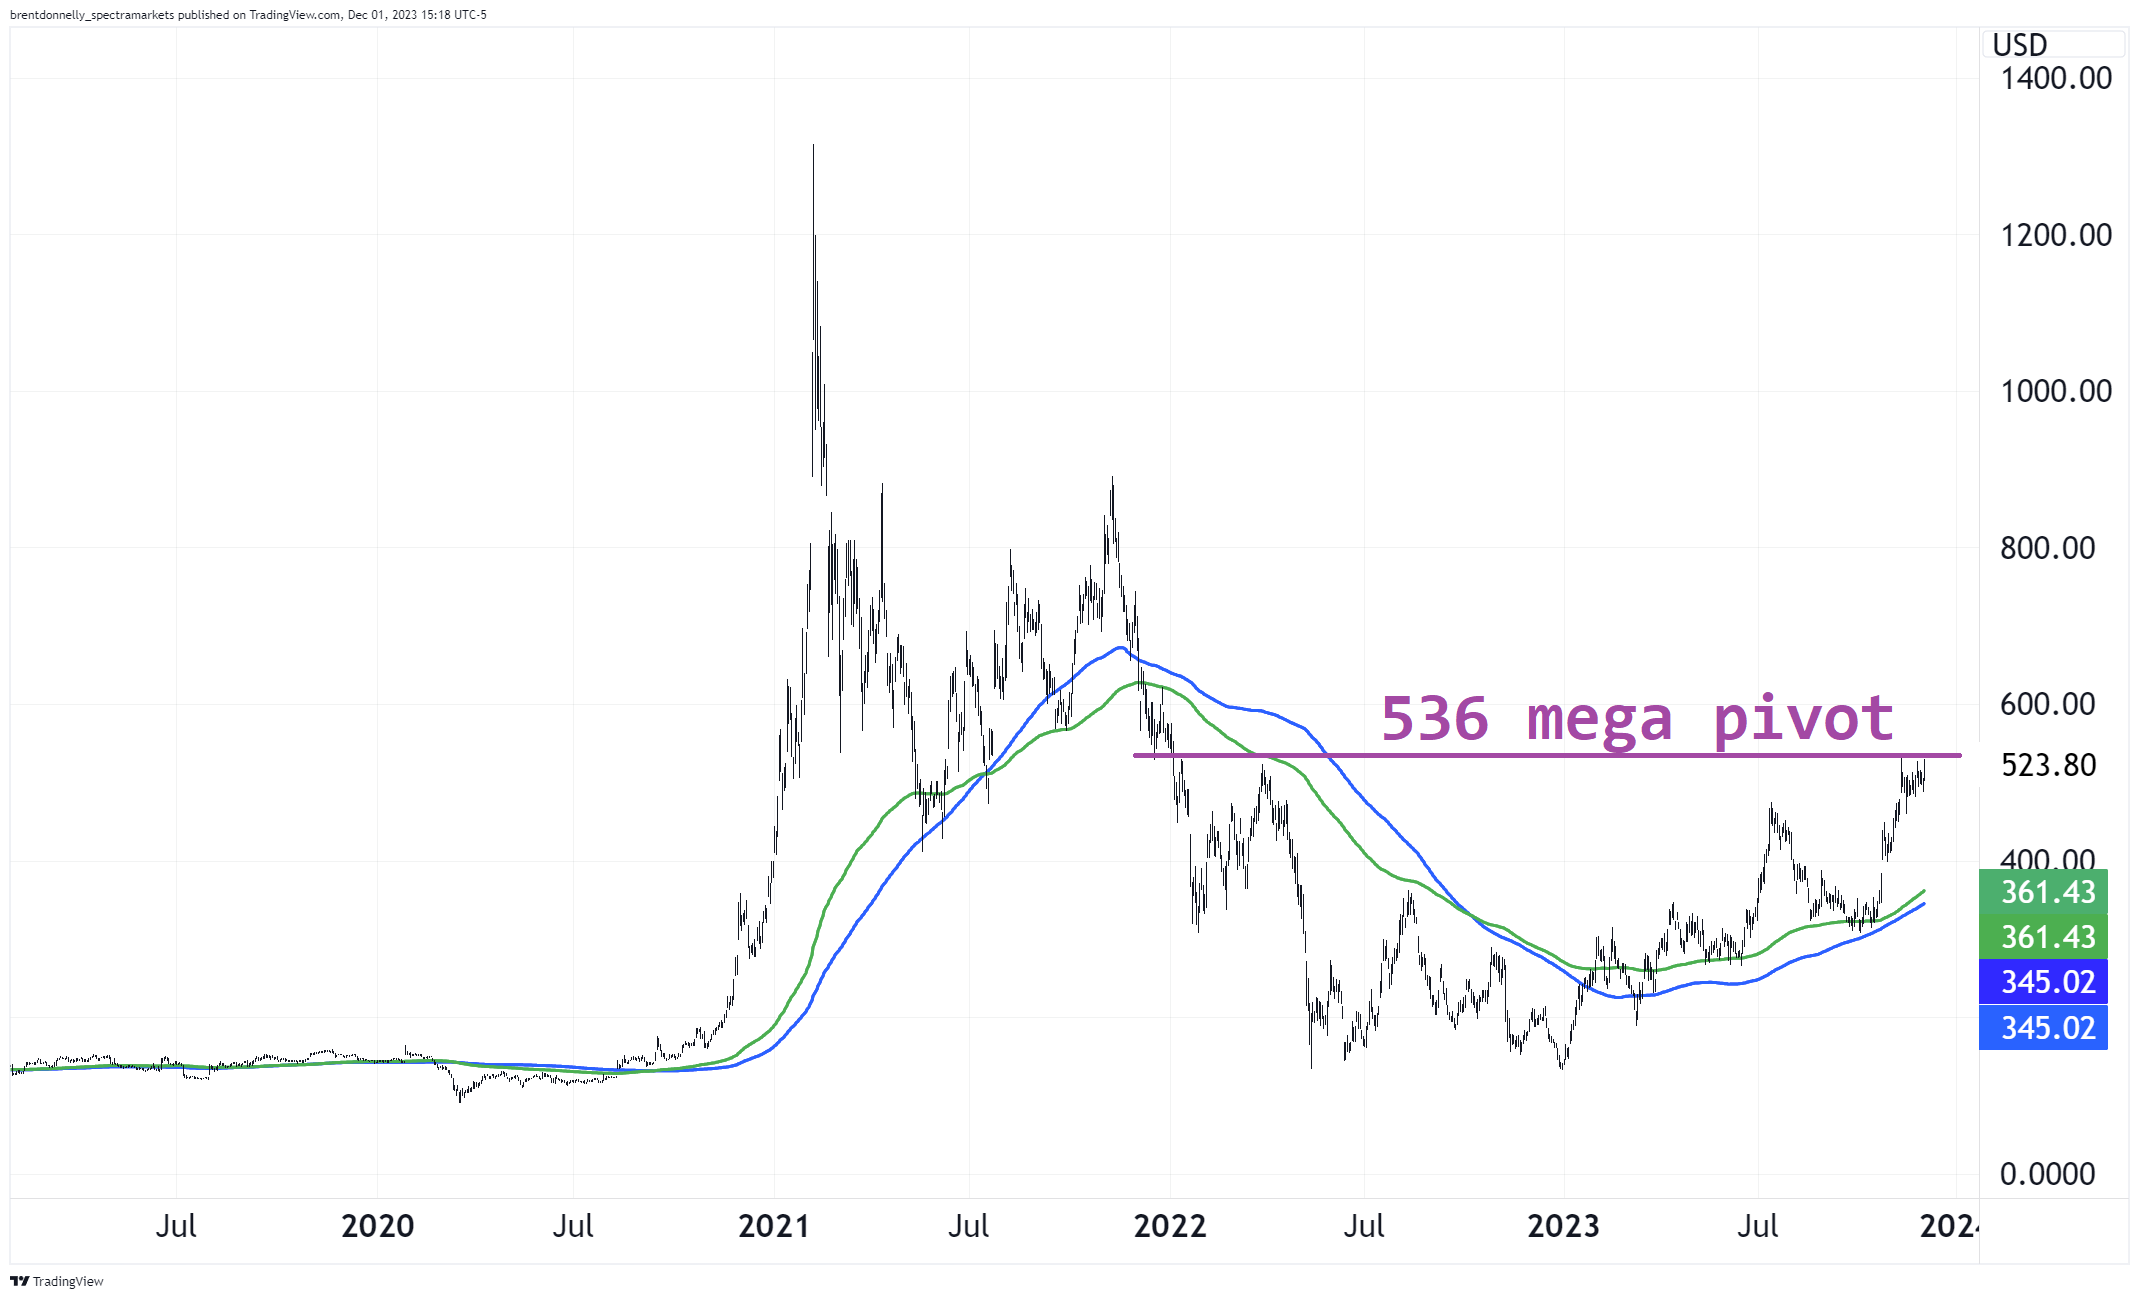
The big level in MSTR is 536 and we’re just about right there.
MSTR Daily back to 2019
Commodities
On November 29, I wrote a big bullish piece about gold. If you want trade ideas and real-time macro commentary, you can subscribe here. The gist of the piece was this:
- There is a shortage of attractive assets.
- Gold should have sold off when real rates spiked and it didn’t.
- Returns from buying gold at the all-time highs are excellent.
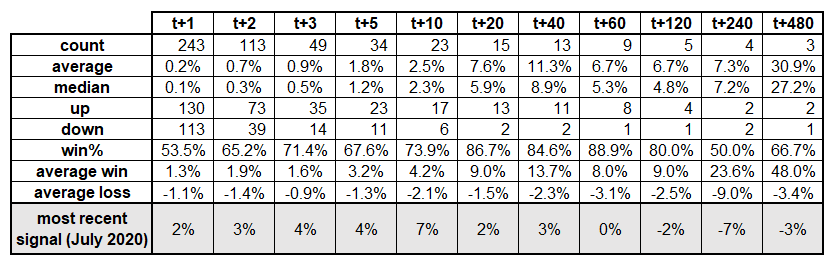
In a world where there is a shortage of assets and a short supply of trust in institutions, gold has been rock solid despite horrendous negative carry. I like gold higher, as a trade. I looked at the returns of buying gold when it makes an all-time high, and they are very good. Here is the grid. I had to remove duplicates, so that’s why you will see fewer trades with a 2-year time horizon than trades with a 1-day time horizon. If gold makes a new high five days in a row, there are five one-day trades there, but the first new high triggers the 2-year hold and you don’t register another signal until two years have passed.
Here are the returns overall, note the bottom row shows that buying gold in July 2020 at the all-time high was fine for a while but negative after 120 days. These returns do not include negative carry or the opportunity cost of holding risk free T-bills, and those are important omissions to keep in mind. Gold needs to go up pretty fast to beat T-bills.
Returns from buying gold at the all-time highs, 1976 to now
I wouldn’t be surprised if gold closes this year at $2200. Nothing in here is ever investment advice. Trade your own view. My view could change at any time. That’s a good reason to subscribe to am/FX. :]
Oil is pretty boring. I think as we head back to a less panicky world where economic volatility is lower and the market is fully bored with geopolitical stories that end up having no lasting impact on price… $65/$85 covers it for the next few months. If anything, a downside break is more likely at this point.
OK! That was 5.7446 minutes. Please share this newsletter with any aspiring finance professionals that you know and destroy the like button to increase traction and algorithmic happiness. Thanks!
Get rich or have fun trying.
Links of the week
Interesting / smart
The Better Letter
A striking if unsurprising data point on NFTs
https://x.com/datarade/status/1729416261149340002?s=51&t=Z-boW5UHRWKGTmYteOnSkA
Nature is lit
https://x.com/gunsnrosesgirl3/status/1729470486394831157?s=51&t=Z-boW5UHRWKGTmYteOnSkA
One of the funniest tweets of the year
https://x.com/historiographos/status/1729493204666577359?s=51&t=Z-boW5UHRWKGTmYteOnSkA
Sad song
Here is a sad and beautiful song to get you through December.
I first heard this song on headphones, walking out of Grand Central Terminal and into a mega snowstorm on December 16, 2020. As I trudged through the freezing, horizontally traveling snowflakes on the way to work through the morning darkness, the weird surreal fear and sadness of 2020 got all mixed up inside my head with the certain hope that 2021 would be better. It almost made me cry.
But I only cry when I cut onions without safety goggles.
Happy song
The happiest song ever recorded (in my opinion).
Clark says this one is the happiest but I find it dissonant / almost a bit nauseating lol. First time Clark has been wrong about anything important tho.
