
Markets are on fire. This does not mean there will never be another recession ever again. Obviously. But the soft landing is here. You’re living in it.
Here’s what you need to know about markets and macro this week
Some Important(ish) Information
With the launch of the new Spectra Markets look and feel, we have moved Friday Speedrun off Substack and onto our new website. You will receive Friday Speedrun directly from me, via email, and it will be available free on the web as usual. If you want to make sure it doesn’t go to spam, just respond to the email and say “Hi” (or whatever!) and/or add me to your contacts.
Every Friday Speedrun in the future will be here. You can also search for keywords etc.
https://www.spectramarkets.com/library/
Global Macro
Goldilocks remains at the helm of the risky asset starship as it forges deeper into the stratosphere. Data continues to support the soft landing, as it has for most of the past 12 months and bond yields are lower, stocks are higher, and crypto is doing a perfect repeat of 2021. Maybe we’re gonna get Summer of Solana part deux.
The US data was pretty close to perfect for the Goldilocks camp as ISM came in flat with falling prices paid, ADP and JOLTS thread the needle, and NFP was mixed with very weak earnings.
Earnings and inflation are key as the US jobs market continues to hum along. Initial Claims are low and Continuing Claims are exactly where they were throughout the 2017 to 2019 US expansion and rate hike cycle. Strong and rebalanced jobs market, falling inflation, OK but not explosive GDP and sentiment. You could barely imagine a healthier dataset. I’m sure there is something to gripe about (downward revisions and household survey, as usual) but the mosaic of labor data points to a successfully rebalanced labor market that is a lot like the one we experienced pre-pandemic.
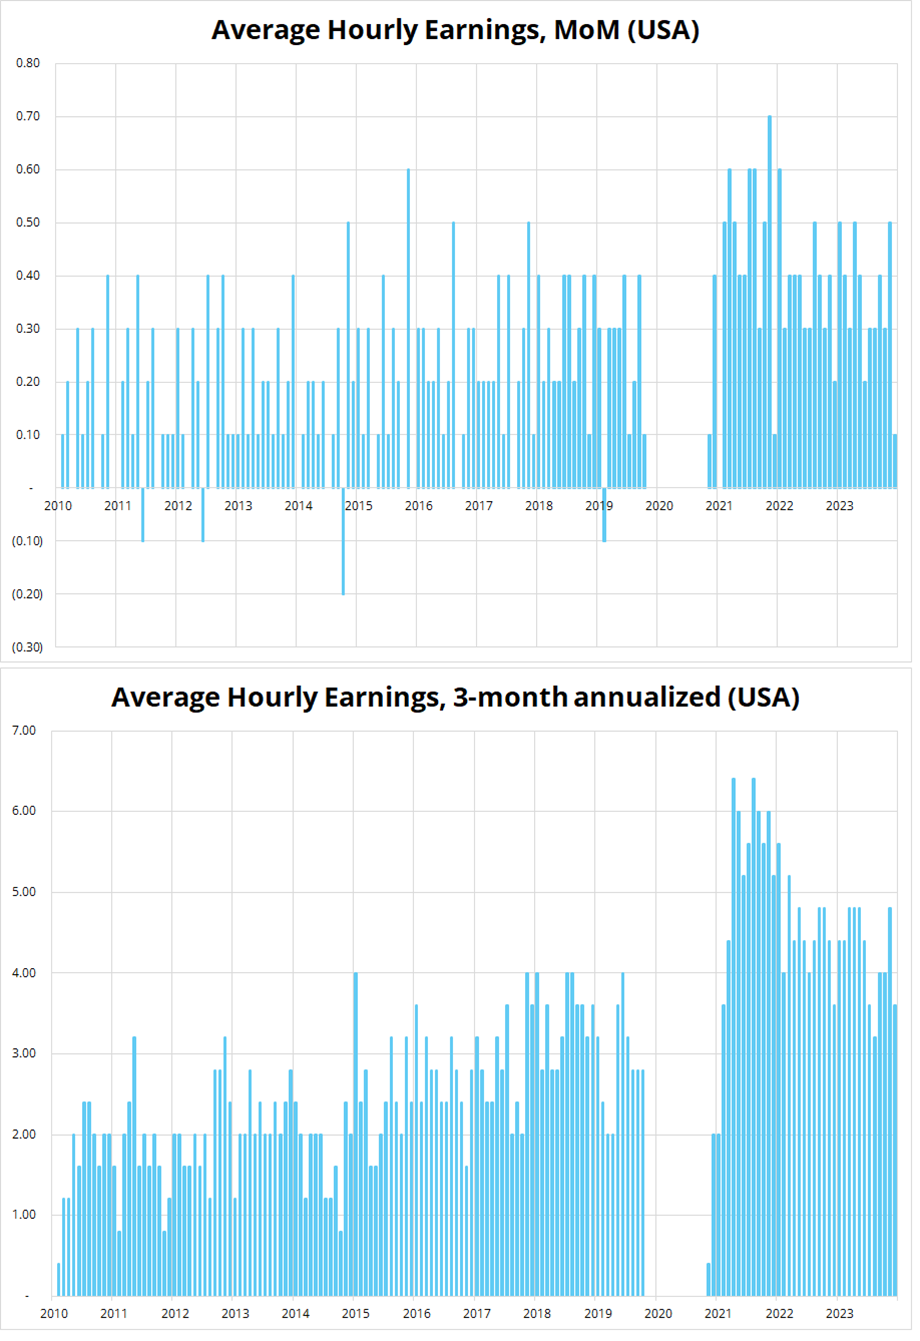
US month-over-month hourly earnings have dropped off a cliff, coming in lower than expected and last month was revised down. This is exactly what Waller and the Fed are hoping for. Look at the far right of the first chart and you can see the tiny print today (0.1% MoM). If you look at 3-month annualized, it has not yet made new cycle lows because the last two months were pretty hot, even after revisions.
In the context of this from Waller:
In judging whether January inflation was noise or a sign of slowing progress, one thing I will be looking at are measures of wages and compensation. I mentioned the increase in average hourly earnings last month. It is true that there was some moderation in average wages over the second half of last year, but I still consider them to be somewhat elevated to achieve our 2 percent goal. Other measures of compensation show slow but continuing progress toward that target. The Bureau of Labor Statistics’ quarterly Employment Cost Index showed moderation in both salaries and bonuses in the final three months of 2023. And the Atlanta Fed’s Wage Growth Tracker continued its very gradual decline in January. Payroll costs are the largest expense for most businesses, and I will be watching to see whether wages and other compensation continue to moderate or if they become a factor preventing progress toward our inflation goal.
The earnings today matter.
That said, we’re not all clear yet. Wednesday’s ADP report sent the exact opposite message:
ADP: While employment growth remained steady, pay gains for job-changers accelerated for the first time in more than a year, rising to 7.6 percent from 7.2 percent.
Still, in the end, it’s the CPI number released next week that will either ratify the USD down trade, or not. If CPI is low, the seasonal quirk story wins and the immaculate disinflation / Goldilocks regime accelerates.
If CPI is unambiguously strong, the market will start to wonder if inflation has bottomed and there’s nefarious inflationary reacceleration going on here.
I discuss the dollar down trade and much more with Alfonso Peccatiello in this week’s podcast. I hope that listening to our conversations will become part of your weekend routine. There is a hard stop on the podcast at 40 minutes, so that’s the most time you’ll ever need to commit. I am less awkward this week than I was last week, though there is one awkward exchange at the end when Van Halen comes up. I like Alf, but his knowledge of popular music is atrocious.

Stocks
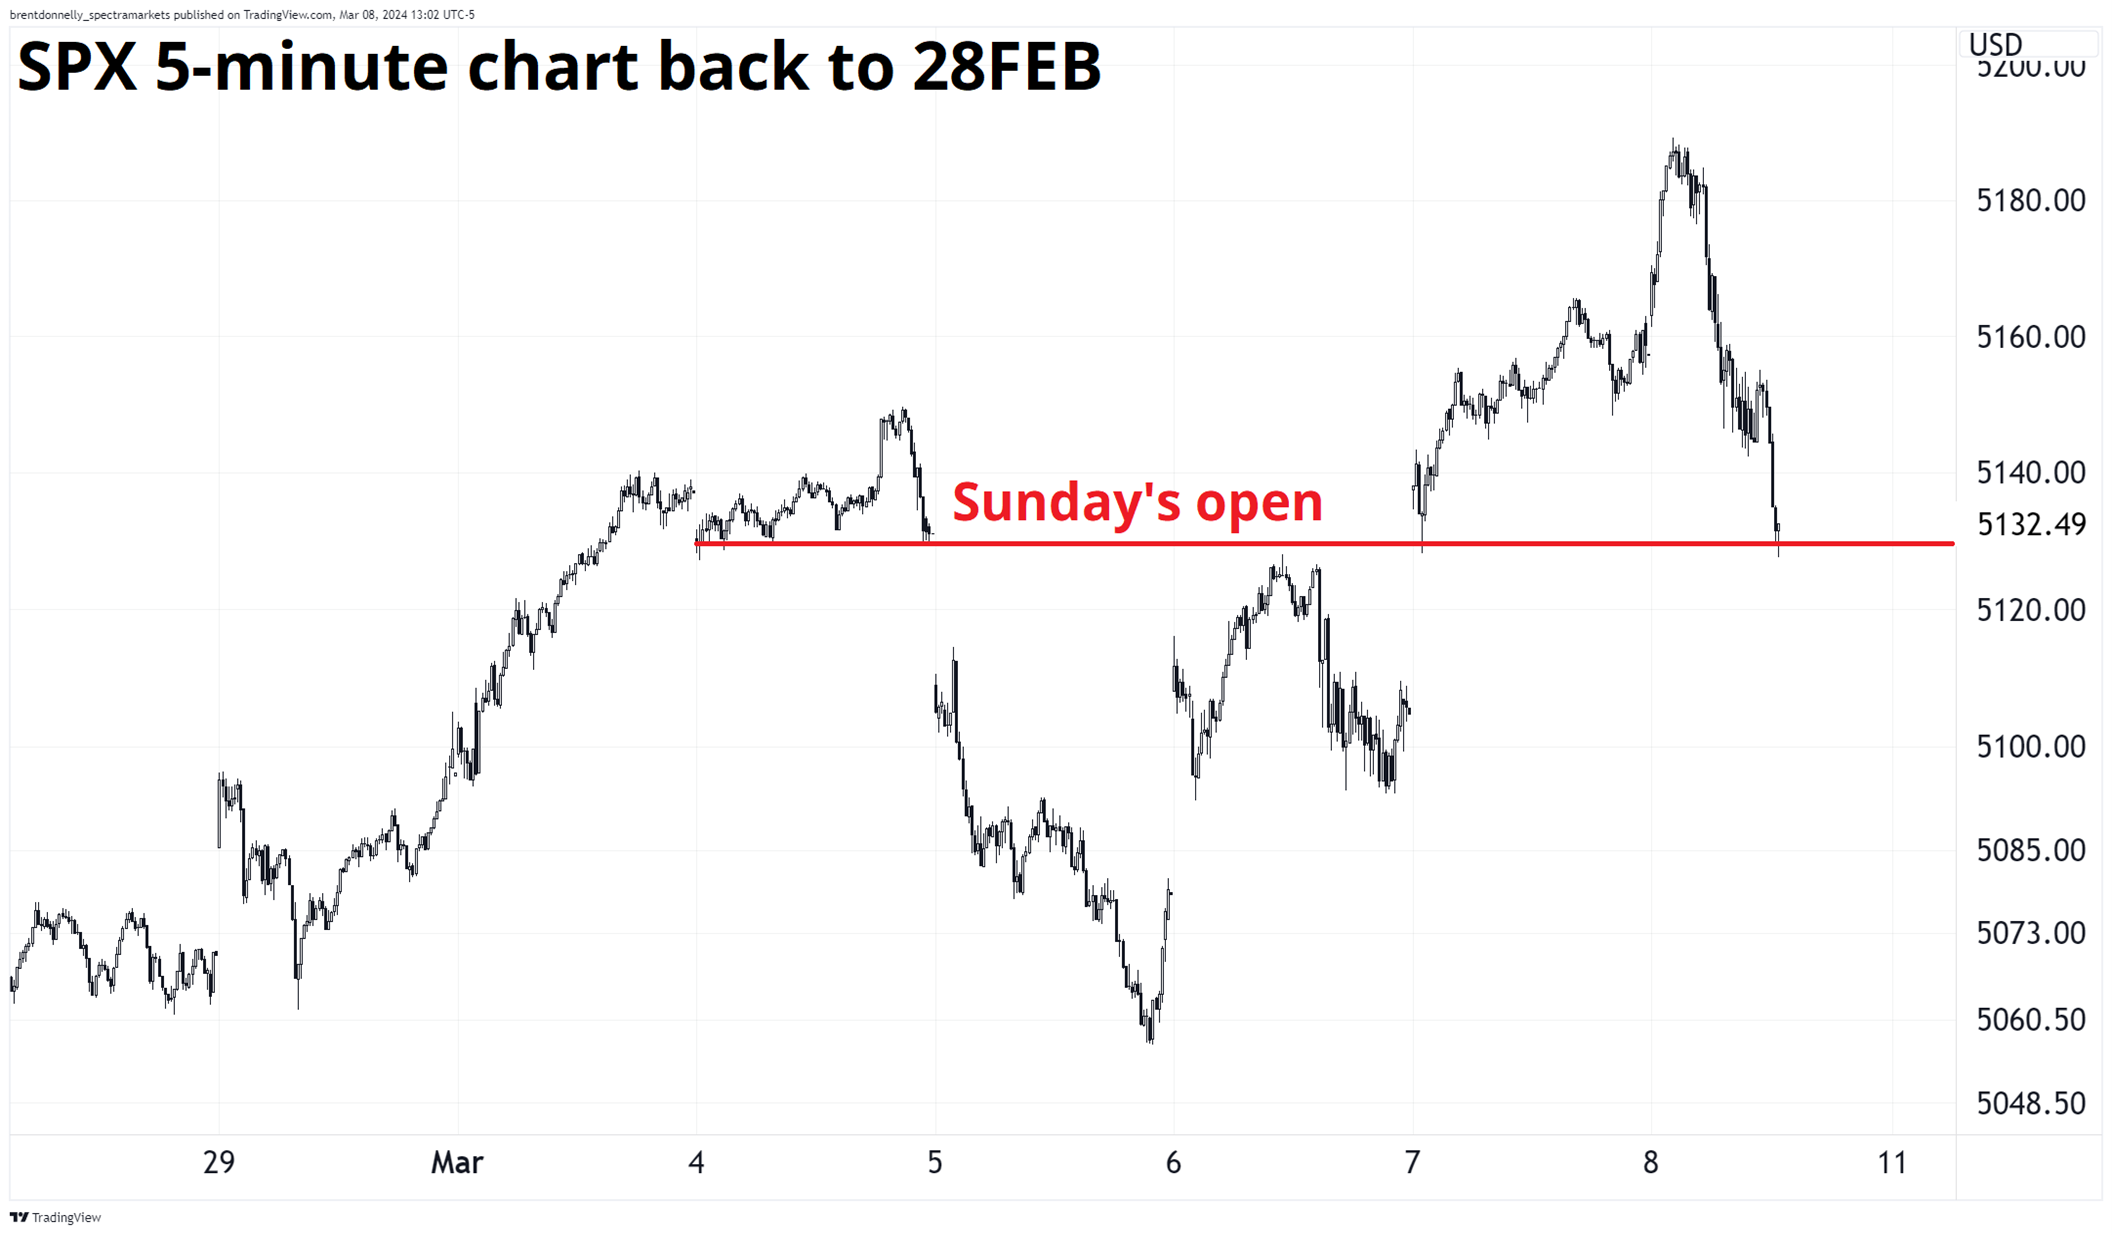
Stocks hit a brick wall after the data today, and have generally had a choppy week. While this isn’t anything to freak out about, it does suggest that underweights and shorts have largely been decimated and there is two-way risk into CPI next week. This chart shows how we have oscillated around the 5130 level all week. That was the Sunday open and is current equilibrium. In a week with mostly OK economic news and not much else, this is a pedestrian result that is not scary, but not exactly encouraging for the bulls. Good news / bad price as they say.
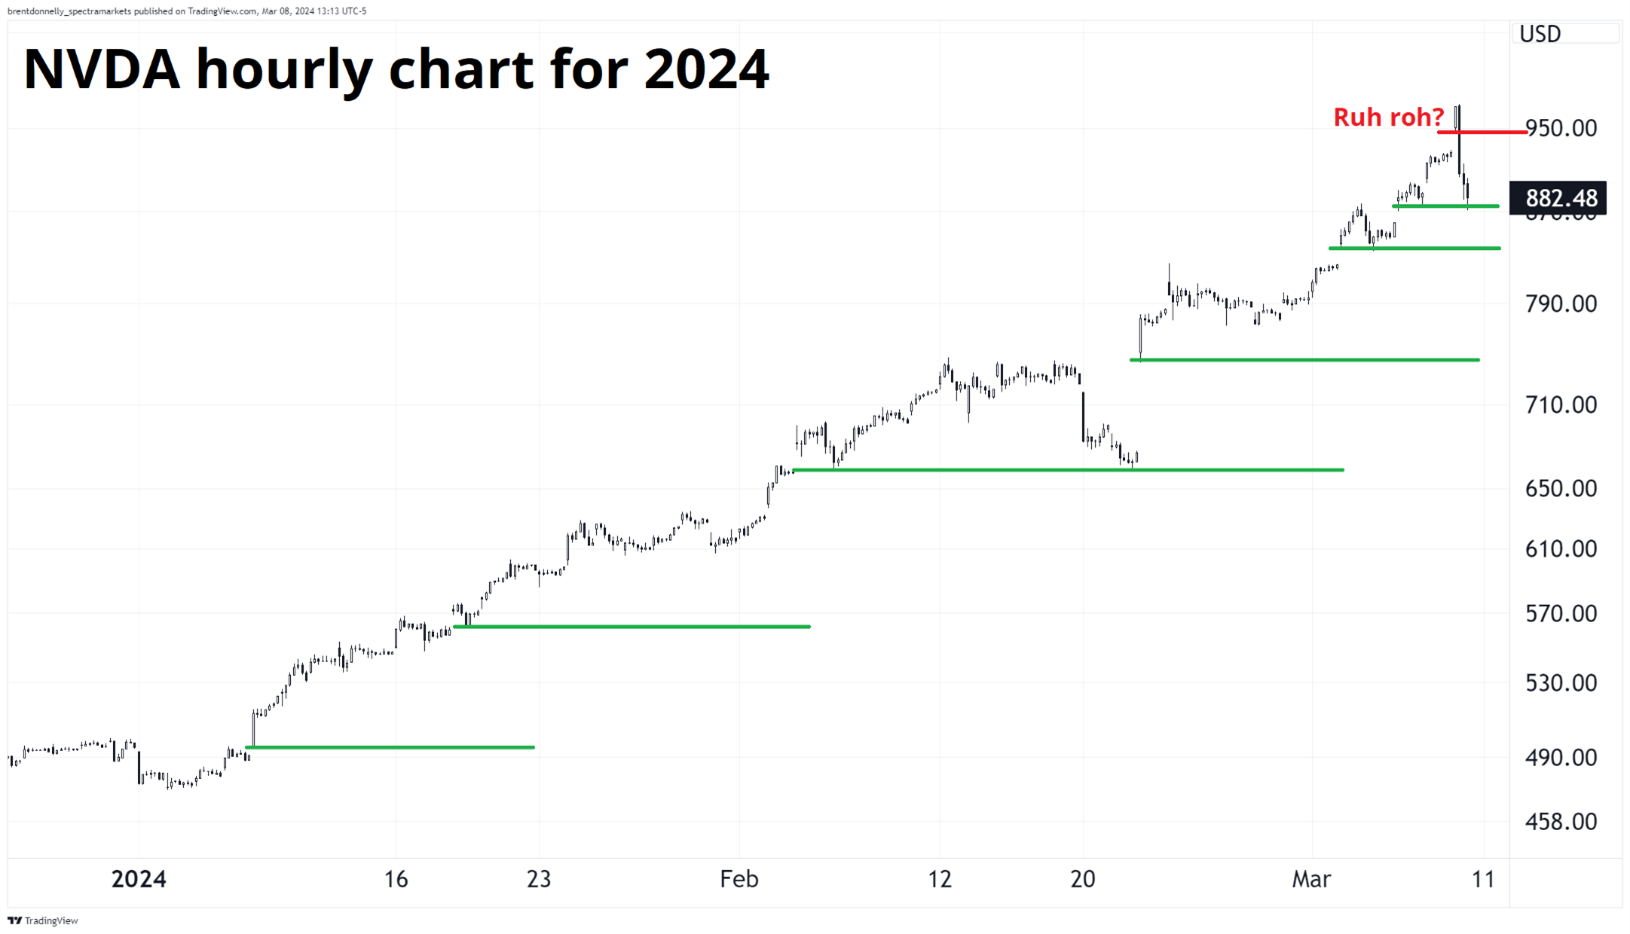
NVDA put in quite the failure pattern today, too, which is worth noting. It has not broken back below any opening gap higher in 2024. Until today. I struggle to maintain rationality when it comes to NVDA because it just reminds me so much of CSCO in 1999. Like Cisco, it’s the picks and shovels play that is heavily reliant on massive tech capex. And like CSCO, it trades at 40X sales. And like CSCO, it keeps roaring higher in the face of many skeptics (including me).
But if you just showed me this chart and I didn’t know what the stock was, I would be short with a stop at $1011. The green lines on the chart show all the opening gaps higher and you can see that every single one, NVDA never went back below the gap. The red line and hilarious (not-at-all-Boomer) Scooby Doo reference shows today, where it gapped higher and failed. Bearish.
And here is this week’s 14-word stock market summary:
Soggy price action and a bearish reversal in the leader of the leaders. 
Editor’s note: We consider this emoji to represent one word: Hmmm. Not 1,000 words as a picture might.
Interest Rates
Global yields tracked lower all week, and there are plenty of after-the-fact rationalizations for the moves, but not much else. In a time of nervous bond markets and rising yields, higher odds of a March hike from the Bank of Japan plus a hawkish Bank of Canada meeting would trickle through to global yields and send them higher. But this week, we got both of those things and yields went down. Overall, the noise from the BOJ, ECB and BoC this week don’t tell you much.
All the central banks are lined up at the edge of the cliff looking down at rate cuts and then looking at each other and saying:
“You go first!”
“No. You go first!”
Then everyone looks at the Fed. And they blink.

Waller set the stage for a March cut last November, but that has not come to fruition and now we could be in the aggravating situation where there is always a rate cut coming four months from now, but never a rate cut. That is, this could be the FSD of rate cuts.
The base case for now remains a cycle similar to 1995, where the US achieved a soft landing, the Fed cut three times, and everything went to the moon and then higher and higher again. You have probably read many times that “there is no such thing as a soft landing.” That’s not true, empirically (1995 + others) and it doesn’t seem to be true this time either. Inflation started falling hard in mid-2022 while US growth and labor markets remained solid. This does not mean there will never be another recession ever again. Obviously. But the soft landing is here. You’re living in it.
Fiat Currencies
While I have written extensively in recent months about how the dollar feels like an all-weather currency because of the US innovation story combined with US energy independence, there is still a place for the dollar smile in your framework. We have seen this recently as rest of world equities have outperformed SPX. The idea that There Is No Alternative (TINA) is not valid when DAX, NKY, and other indices are ripping faster than US stocks.
If you don’t know what the dollar smile is, we discuss it in more detail in the podcast this week.
Over the last 20 days, the DAX, NKY, FTSE combo has outperformed the SPX by about 2%. I am taking the average performance of those three indexes minus SPX performance over the past 20 days. While this is pretty obviously dollar bearish in real time (and the stats back that up in the chart that follows), I was wondering if it is dollar bearish going forward. That is, does the Rest of World outperformance translate to future dollar selling perhaps as the currency flows are not timed to coincide exactly with the equity flows. Or maybe there is an echo or after effect. Answer: No.
I took all the SPX vs. Rest of World 20-day performances and bucketed them into 10 deciles. So, bucket 1 is SPX massively outperforming Rest of World and Bucket 10 is Rest of World outperforming. Then, I looked at 20-day DXY performance, coincident, and forward. The chart is here.
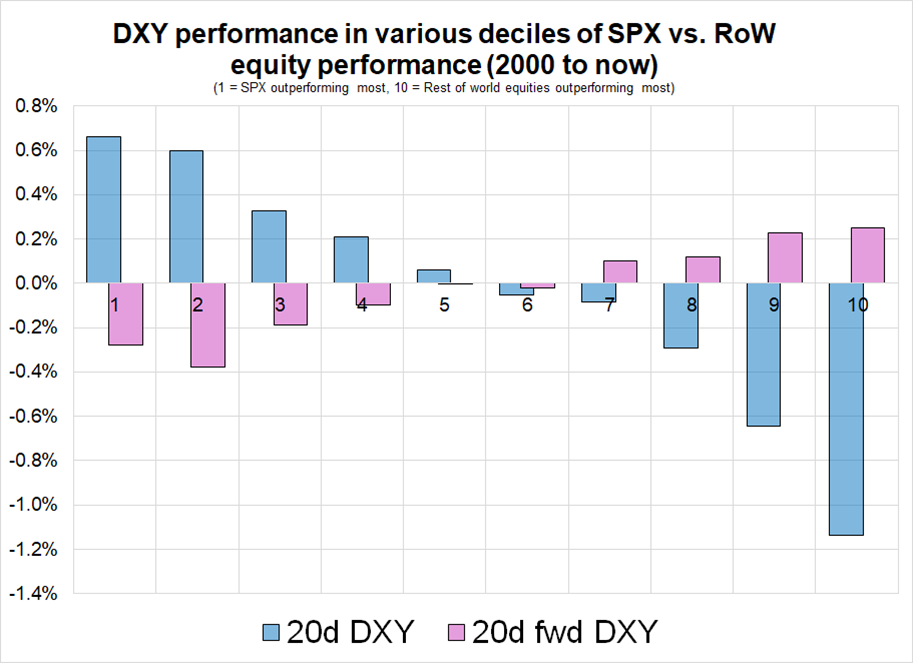
So the reality is that if you are able to predict whether SPX will over- or underperform the rest of the world, you can make money on a USD view. But you can’t look at what is happening now and extrapolate. In fact, the dollar mean reverts.
As a way to see what has happened this year, so far, I looked at 20-day relative equity performance (USA vs. RoW) and mapped it against 20-day changes in the DXY to see if this backtest back to 2000 is still relevant today.
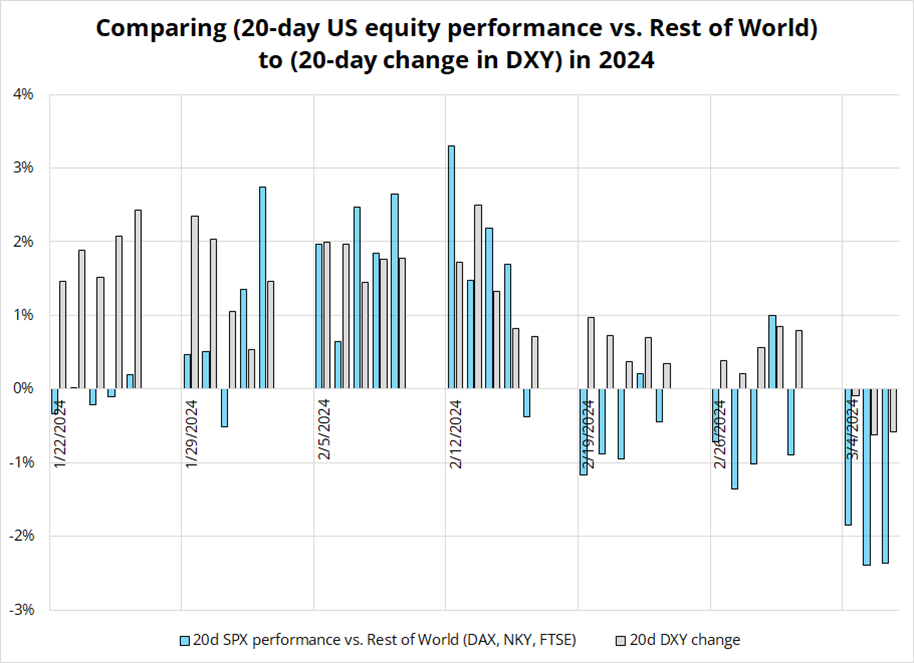
Yep! You can see that as US relative equity performance rolled over, so did the DXY.
The market has spent all week selling USD as the “TINA is dead” trade is in vogue. People also see BTC and gold ripping and that gives them USD-bearish vibes. People are starting to get short dollars as a theme. Now, next week’s CPI becomes somewhat of a watershed, imo.
If CPI comes in low, the seasonality quirk theory wins, and we could see a true USD down theme emerge next week with a multi-percent, multi-week move lower into the end of March.
Crypto
Crypto is in full 2021 mode as altcoins rip, people are looking for 1000X plays, and my guess is that sports gambling websites have seen a huge drop in parlay volumes as the altcoin market provides a perfect substitute to the same demographic. Bitcoin is slamming against the all-time highs but can’t quite breach exospheric resistance at 69,420.
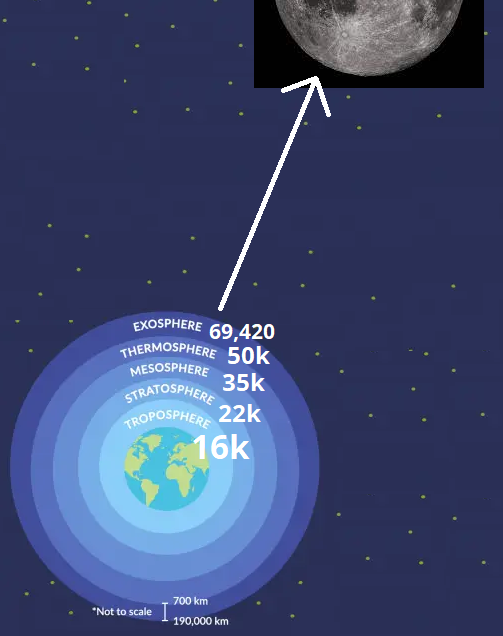
Human beings love round numbers and the only thing rounder than a round number is a meme number nested within another meme number. The pullbacks after failing at 69,420 have been eye-watering but not even close to fatal. By the way, as you admire that insanely beautiful piece of art that I created there with the moon and stuff… Revel in this fact: The two pieces of software we use most at Spectra Markets were invented in 1985 and 1987. That makes me so happy, though I can’t explain why.
While we’re obviously in the greed phase of the game here, whether it’s BTC or NVDA or TQQQ or SOXL, or whatever (they are all similar high beta risky tech assets that go up and down together)… I can’t really say we’re in the final innings. This could just be halftime.
Speaking of mixed sports metaphors… I always loved this t-shirt. It makes me dizzy.

A quick excerpt from am/FX this week…
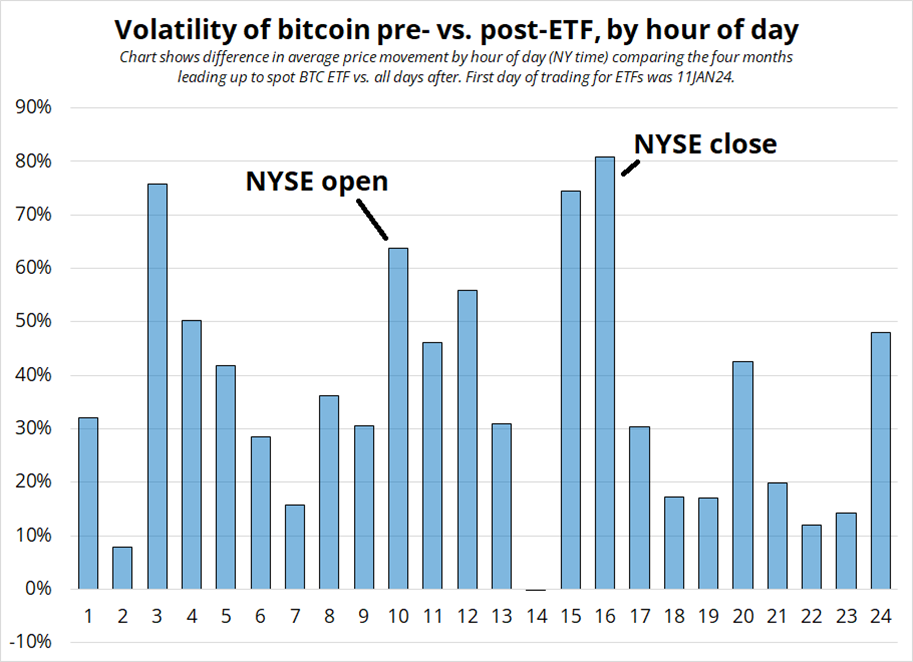
Does bitcoin trade strong at the equity open?
I have been curious about the microstructure impact of the spot ETFs on BTC as the OG coin morphs from initial visions of a libertarian peer-to-peer electronic cash system into mostly a Wall Street flow object / liquidity and risk appetite thermometer. In theory, one would expect a rise in volatility during NY hours and a spike at the open and close as NYSE flows tend to cluster at those key times. That’s what happened!
The chart shows the increase in volatility by hour of day for the pre- and post-ETF eras. I am simply taking the average hourly move (absolute value of change) for each hour and calculating the change for regime 1 vs. regime 2. The pre period (regime 1) is 01SEP23 to 31DEC23 and the post (regime 2) is 11JAN24 to now. I would have thought the NYSE open at 9:30 a.m., i.e., 9-10 a.m. (i.e., 10 on the chart) would be most affected but it’s the close (15:00 and 16:00) that saw the biggest jump in movement. 3 a.m. NY is BTC option expiry, so perhaps the ETF launch has led to more options strategies and hedging? That one I find harder to explain.
Commodities
Like its digital little brother, gold is moonbound as it makes new all-time highs. While you will often see people cheering for their most-loved asset on Twitter, keep in mind that basically every asset is making new all-time highs right now.
So tech bulls, gold bulls, and bitcoin bulls, while all sporting different narratives and different personality types, are all benefiting from the same surge in risk appetite fueled by the Fed’s decision to declare mission accomplished before accomplishing the mission. The Fed’s target is 2%. They’re doing victory laps with inflation now above target for 24 straight months and their primary target (PCE) at 2.8%. Yes, I know, I know. They can’t just set policy based on current inflation. Yeah yeah. But for now, the market is debasing the currency and ripping anything not nailed down because there is a non-zero chance that policy is way too loose.
All that said, it is interesting that many consumable commodities like lumber, oil, soybeans, and corn are trading at multi-year lows. There is more ebullience in financial assets than there is in broad commodity markets overall.
OK! That was 7 minutes. Please share this newsletter with any aspiring finance professionals that you know. Thanks!
Get rich or have fun trying.
Links of the week
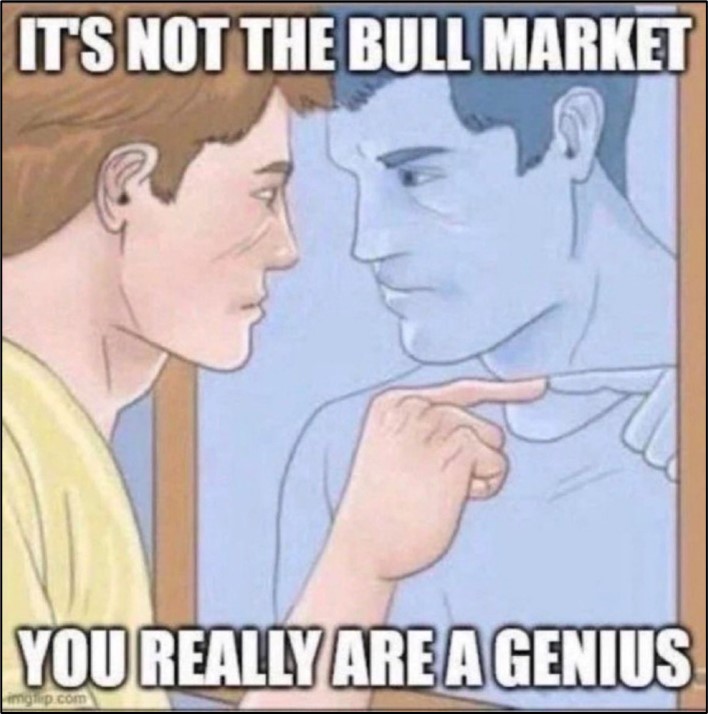
That meme of the kid telling himself he’s a genius in the mirror reminded me of one of the greatest moments in film history, ever. You just need to watch the first 22 seconds.
Smart / interesting
https://www.theintrinsicperspective.com/p/here-lies-the-internet-murdered-by
Music
If you were not at least a young adult in the mid-1990s, you missed an amazing and diverse time in popular music. There was full-on irony, like Alanis’ Jagged Little Pill. There was tragedy, like Mellon Collie and the Infinite Sadness (Smashing Pumpkins). But there was still room for full-on earnest romantic optimism. Like this song from Jewel.
Which included these lyrics:
I hear the clock, it’s six A.M
I feel so far from where I’ve been
I got my eggs, I got my pancakes too
I got my maple syrup, everything but you
I break the yolks and make a smiley face
I kinda like it in my brand new place
Wipe the spots off of the mirror
Don’t leave my keys in the door
I never put wet towels on the floor anymore…
In 2024, you cringe!
And yet most people could listen to this with minimal cynicism in 1995 and be touched by the everyday life of this beautiful yodeling everywoman from Utah, or Alaska, or San Diego, or wherever. And we could enjoy that before switching back to smashing shit while Bullet With Butterfly Wings played at 11/10 volume.
2024 needs more earnest people like Jewel circa 1995. Cynicism is easy.
https://navalsarchive.substack.com/p/cynicism-is-easy-mimicry-is-easy
