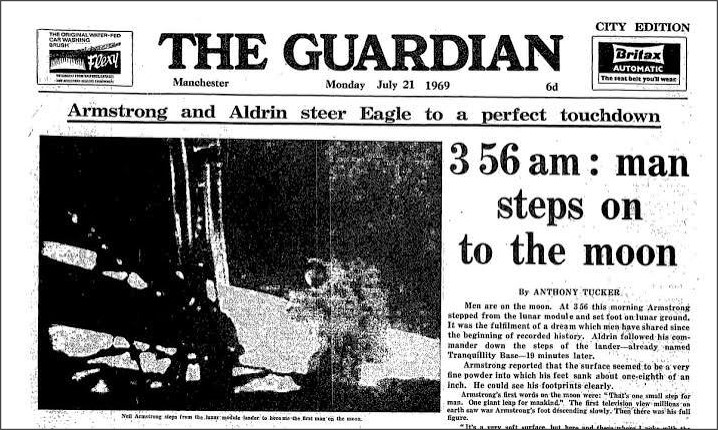
War is ongoing
Markets now show essentially no chance of a rate hike in July and less than 50/50 for September. As discussed on Friday, animal spirits are not fully alive and well despite the more rate-friendly outlook as there is too much uncertainty around the AI Capex boom and energy markets. While oil momentarily returned to pre-war levels, it is now back up in the 80s while crack spreads and other products remain uber-bid.
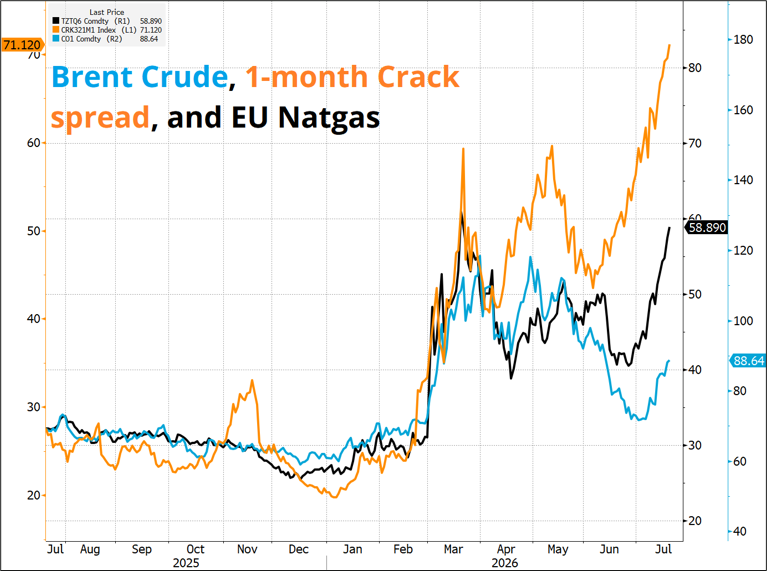
We sit in a lull where no significant new macro information is set to arrive for a bit given July FOMC and META earnings both drop on 29JUL and there is not that much new tradable information set to arrive between now and then. I have fully ditched the bullish risky asset view given the non-reaction to CPI (good news/bad price) and while the call to buy the MU dip has worked okay so far, I am out of that, too.
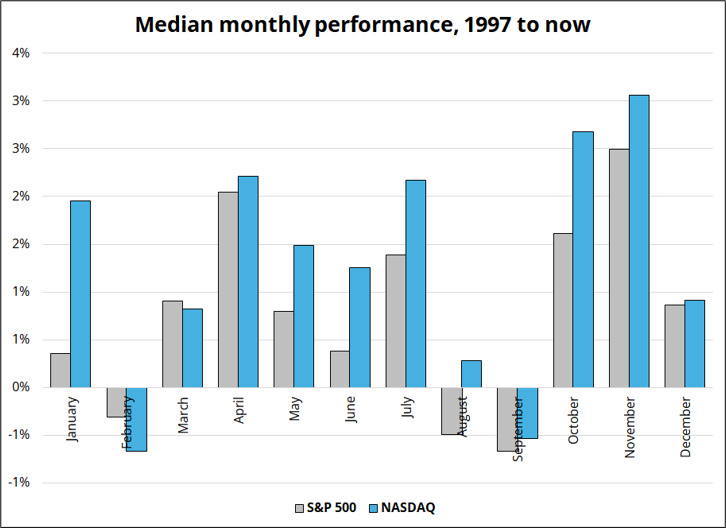
I simply feel that there are too many mixed messages from markets in the short-term and while the hold of support $800 in MU was impressive, it’s not enough to convince me that everything is alright out there. Retail has taken their ball and gone home, and July is supposed to be a seasonally strong month for equities and yet here we are. And the war rages on with no end in sight.
Here is the median monthly performance of stocks 1997 to now.
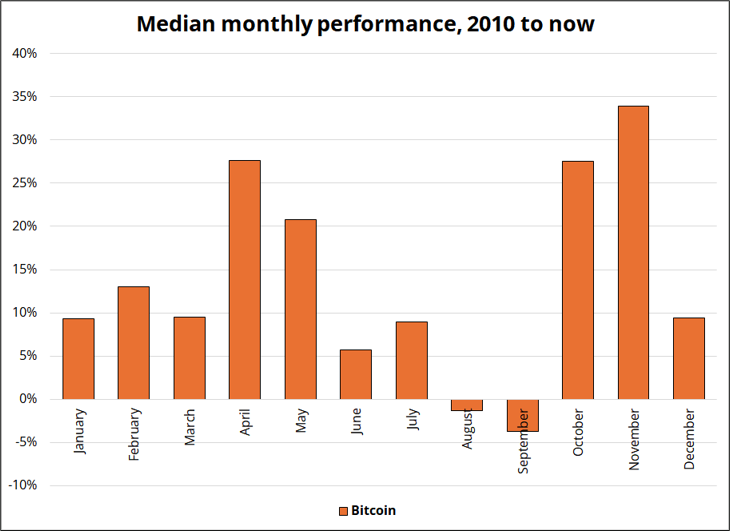
And because bitcoin traded as a risky asset throughout most of its existence, its seasonality looks nearly identical.
And here is the average seasonal path of SPX, to give you another view of the standard pattern:
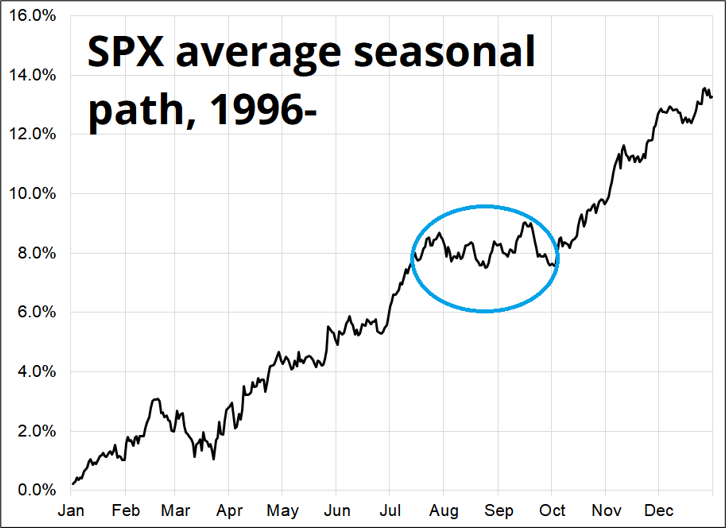
OK, but does a negative July cancel out the bearish August seasonality? A bit, maybe? Hard to say given the small sample. Here is how the NASDAQ did in August after trading negative in July. I would rate this as a nothing.
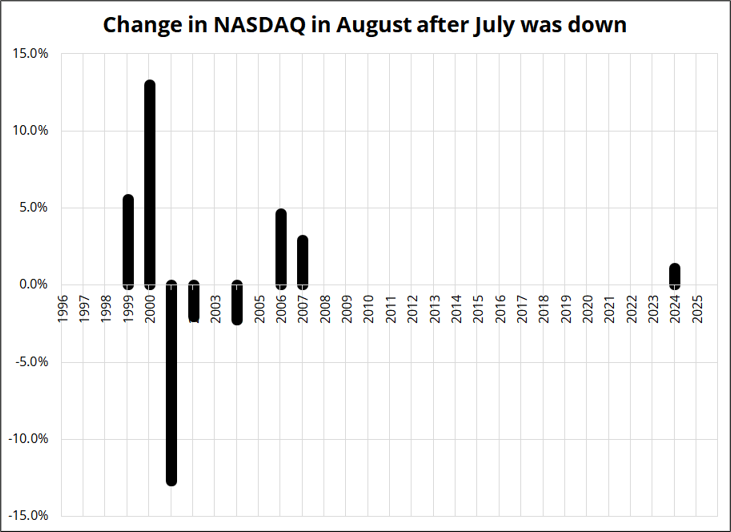
To me, this all lines up as a situation where I am better off doing nothing because there is no clear macro trend, no tradable macro story, no strong seasonal bias, and no clear or exciting high EV macro narrative developing.
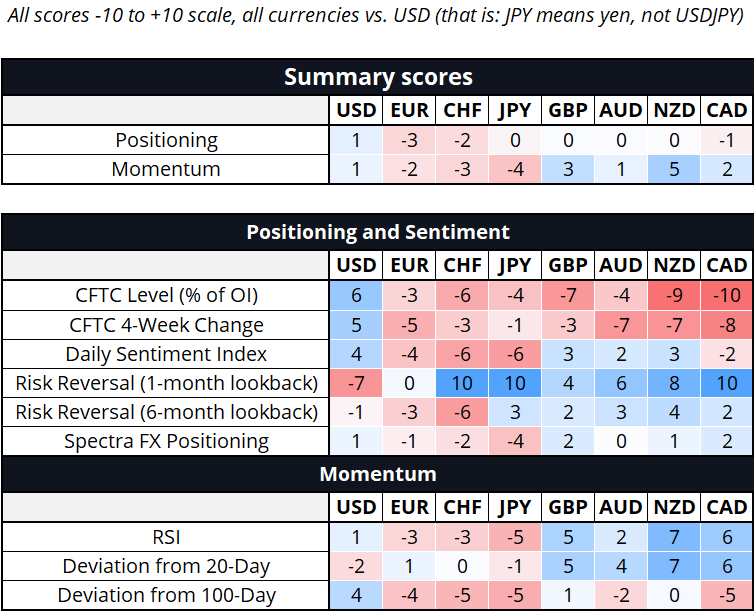
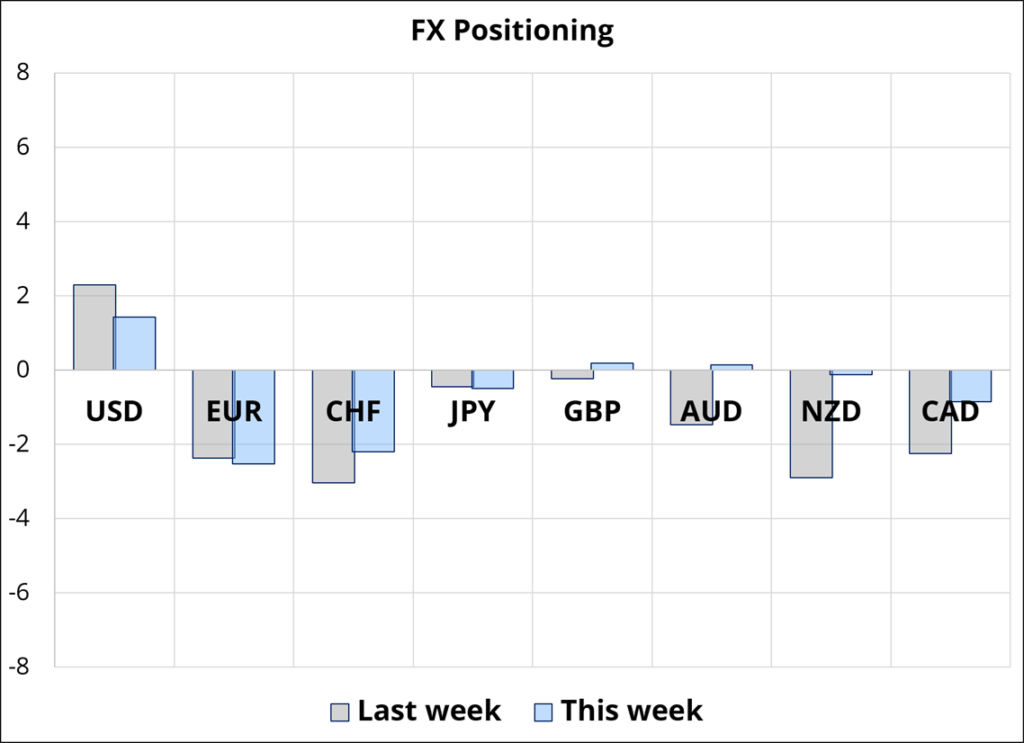
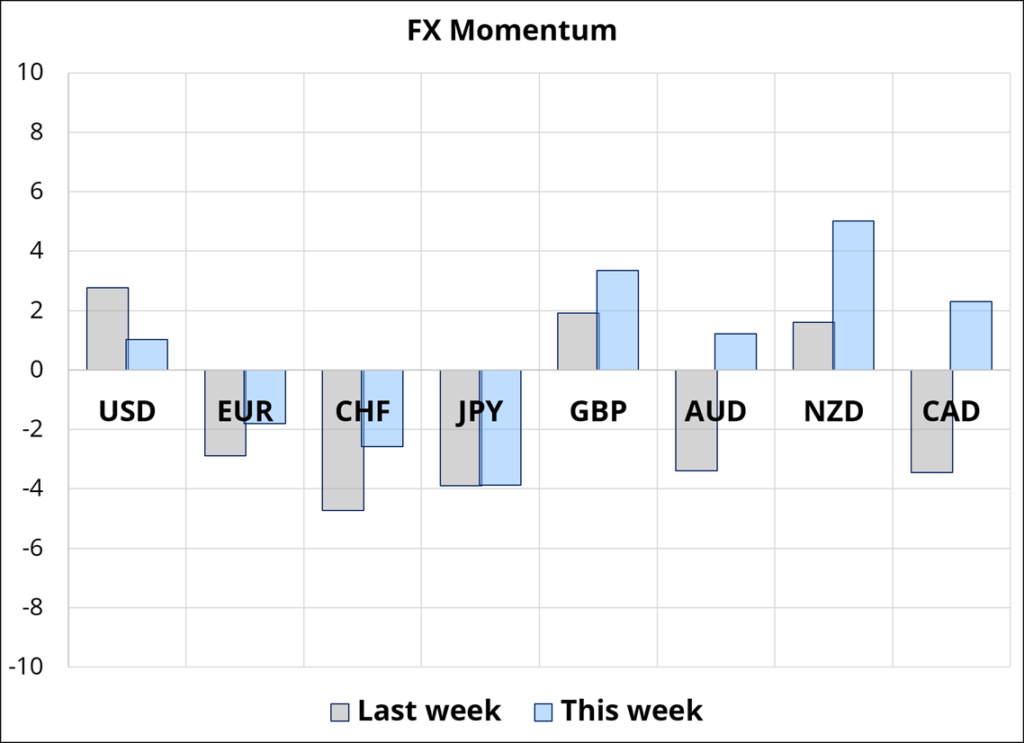
Weak CPI and the Fed reprice should have unlocked a disinflationary boom trade, at least for a week or two, and it didn’t. Gold and silver still can’t rally. Semis have bounced, but there is no all-clear signal there. And sadly, my bearish USD view is getting stale as long USD positioning has burned off. Long a bunch of FX vol for the next ten days could be painful. As such, I am going to take profit on the GBPUSD call and the USDMXN put fly. The GBP made money and the MXN will be a small loss. Sure, it kind of looks like maybe GBP is just getting started, but the energy crisis isn’t over, the Fed has already repriced, Burnham is now PM, EURGBP has collapsed, and I am not sure if there are any remaining topside catalyst for the pound.
This is kind of a boring conclusion to reach here today, but I would rather admit there is nothing and get closer to home, not sit on a bunch of negative bleed for ten days due to the endowment effect. Cable tried its luck above 1.35 and failed. MXN is going nowhere. The two option structures are worth a lot of money and in my view have gone from positive EV to negative EV. I do still like the CHFJPY trade as I believe there is still a good chance USDJPY flows turn more bearish here in time.
Also, for what it’s worth, today we enter the most bearish period of the year for cross/JPY. The next chart shows the P&L of trading four JPY crosses from the long side for the 20 days starting July 20th. These are incredibly bearish outputs given the data series starts with USDJPY at 101 (up 60%), CHFJPY at 65 (it has tripled!), and so on. When you do any backtest on cross/JPY back to 2000, you would expect to find almost exclusively bullish results because of the massive upward trend in the data. And yet here are the results:
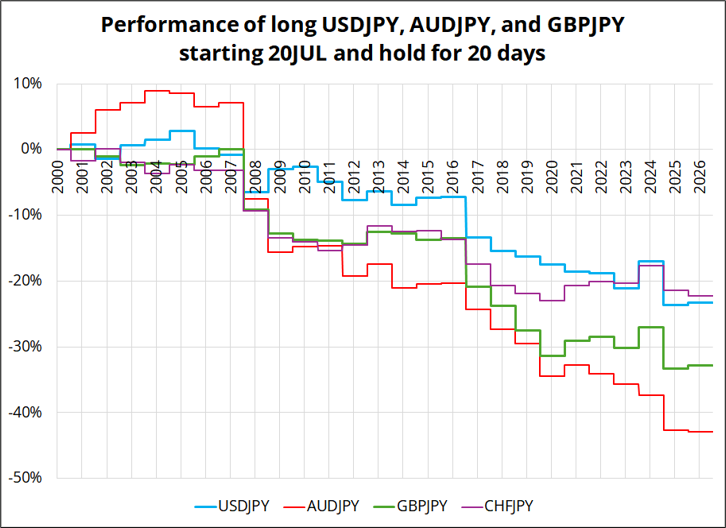
Calendar
A dud of a calendar this week.
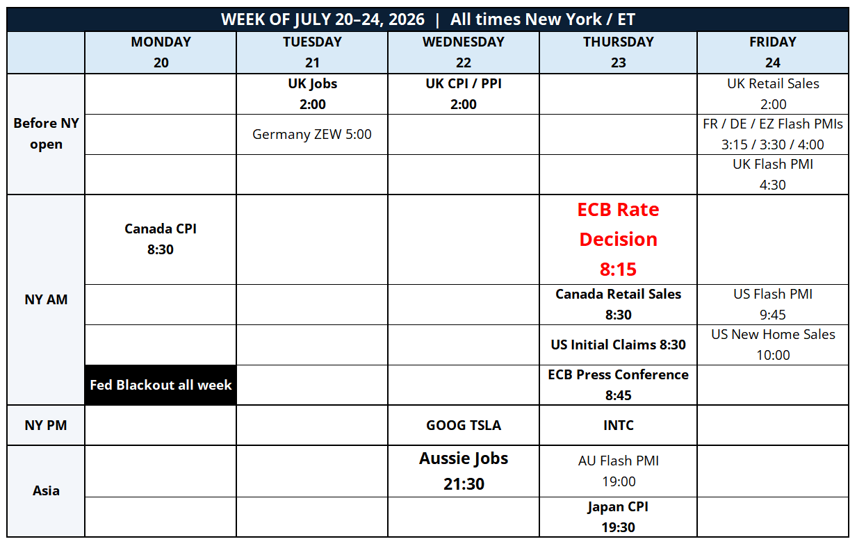
May you choose to do something this week not because it’s easy, but because it’s hard.