
I see three reasons for an asymmetry to the strong side in CAD CPI. And the setup to go long CAD as a tactical trade is attractive.

Is a single molecule of water wet?

I see three reasons for an asymmetry to the strong side in CAD CPI. And the setup to go long CAD as a tactical trade is attractive.

Is a single molecule of water wet?
Short EURCAD @ 1.4808
Stop loss 1.4871
Take profit EOD
(if not stopped out)
Buy Overnight 1.3610 USDCAD puts
~12.5bps off 1.3625 spot
Canada CPI comes out today and I see four reasons to be long CAD into it. Three of the reasons relate to my bias for CPI and one relates to the setup in the context of this CPI release. I’m going to go in reverse order of importance.
1. The first thing I would point out is that there has been a lot of uncaptured seasonality in the data after COVID. This has been true in the US and Canada, too. The main issue with any analysis like this is the sample sizes are tiny, but the underlying logic of data seasonality being distorted after a pandemic is strong enough that I think you can still look at these small samples and try to find some signal in the noise.
Canada CPI is not seasonally adjusted. Here are the misses (actual vs. Bloomberg consensus) after COVID.
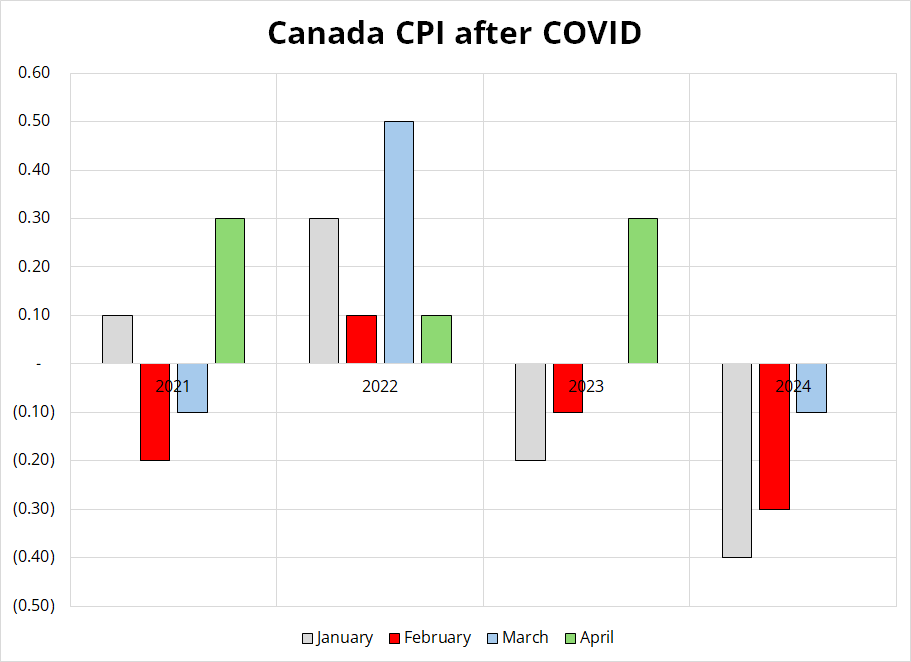
Again: This is a tiny sample, but February has leaned a bit weak, and April has leaned rather strong (green bars). This is a signal strength of maybe 15 out of 100, but it’s something to consider.
2. The second thing I’ll point out is that State Street’s Price Stats Index, which scrapes websites to find millions of prices daily, shows a big jump in Canadian prices in April.
While the PriceStats skews towards goods, it does cover many services like healthcare, recreation, and transportation. And online and offline prices have an extremely high correlation and therefore the series offers some insight. Here’s the chart:
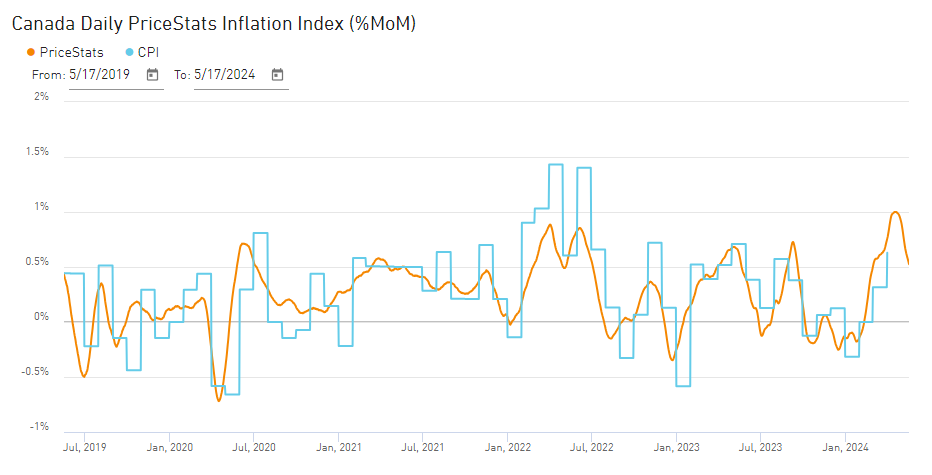
That zip up higher in the orange line peaks on April 23, so you could say the figure is contemplating something up around 90bps while the median economist is forecasting 0.5%. The big wildcard will be shelter, as that is not captured in the PriceStats measure.
3. Third, and final point on the CPI data: My intuition would suggest that Canadian and US Inflation can only diverge so much given there are so many common factors (like commodity prices) driving both. Both economies feature strong jobs markets, high Immigration, a shortage of housing, and booming equity markets. There is more slack, softer GDP, and more mortgage resets in Canada, but historically the two economies are tied together. Rents continue to rise in Canada while home prices flatline. For context here are the two series. I put little blue sticks where there was a divergence. You can see usually orange (USA) leads and black (Canada follows.)
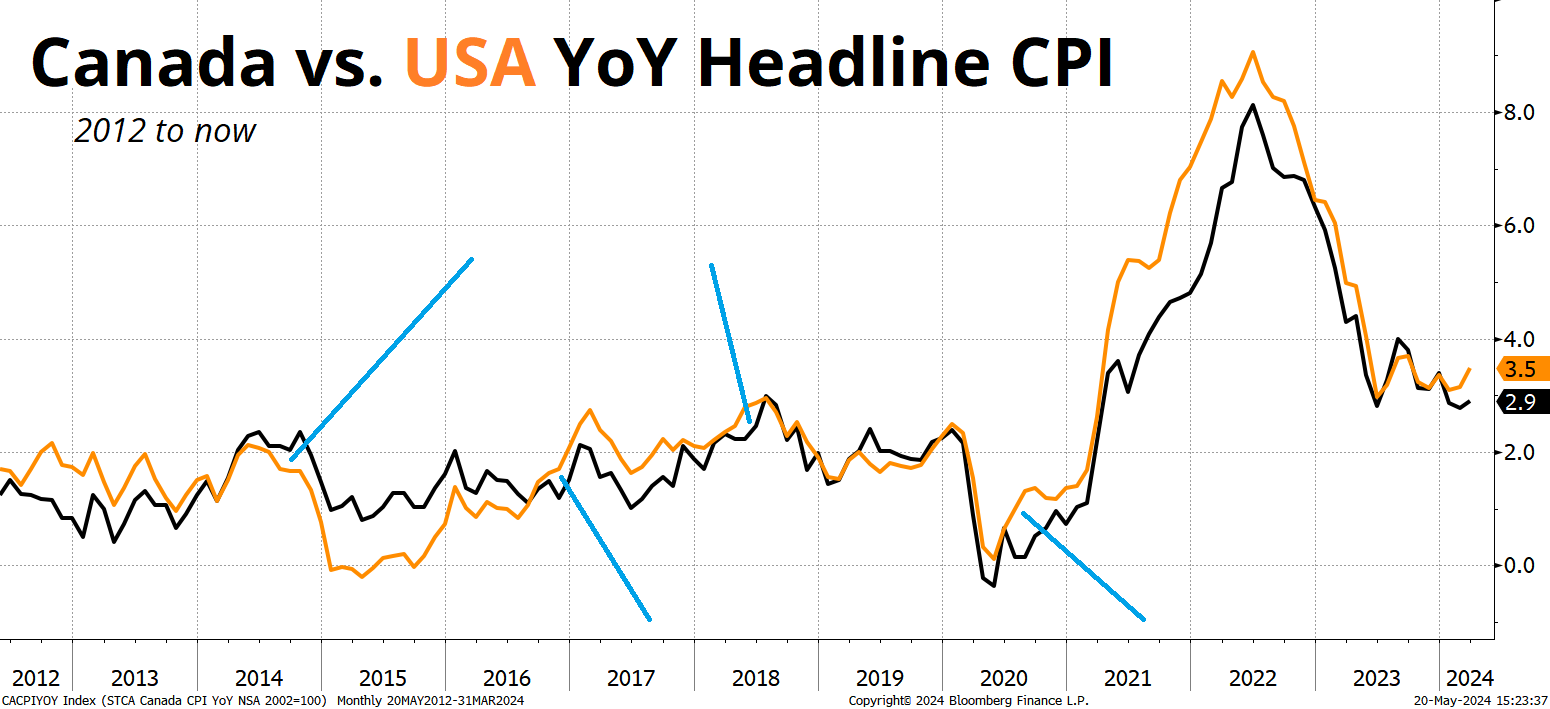
YoY inflation in Canada has dropped 0.5% over the last three months while rising 0.1% in the United States, for a difference in travel of -0.6% in favor of lower inflation in Canada. I looked at any time this metric got more than 0.5% out of line in either direction, and the results are here:
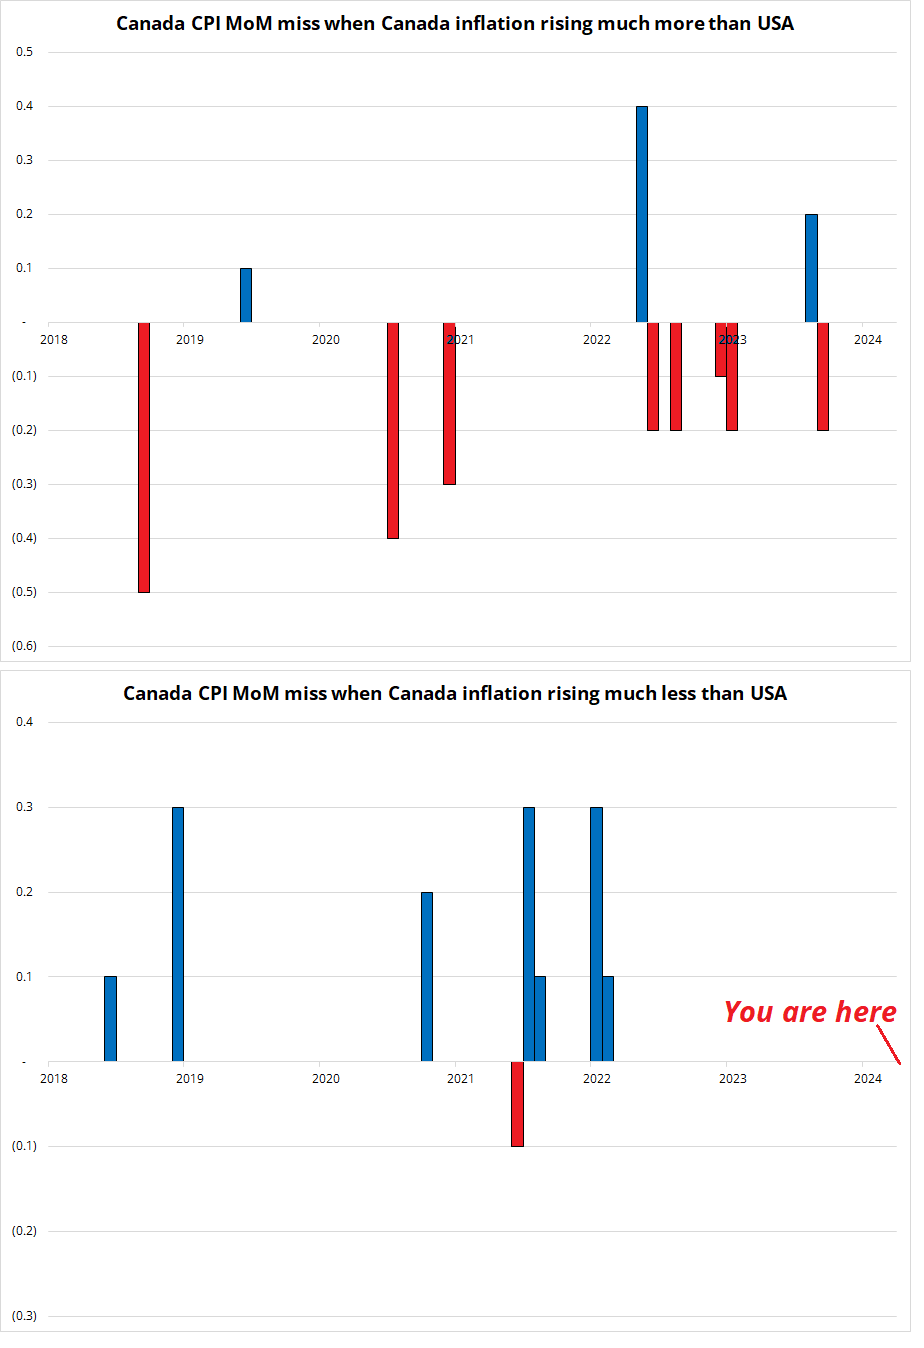
Long story short is that if US inflation is stable and/or rising, I am suspicious about falling Canadian inflation. This is point three steering me in favor of long CAD into CPI. The first three points all relate to why I think CAD CPI leans to the strong side. The final one is more about the market setup.
4. There is around a 40% chance of a rate cut priced for the June Bank of Canada meeting. I think that is too high based on what Macklem has been saying, what the Fed is doing, and where Canadian wage growth sits (+4.8%). Early rate cuts could light a fire under housing and there just looks to be no rush to cut. Chart of current pricing here.
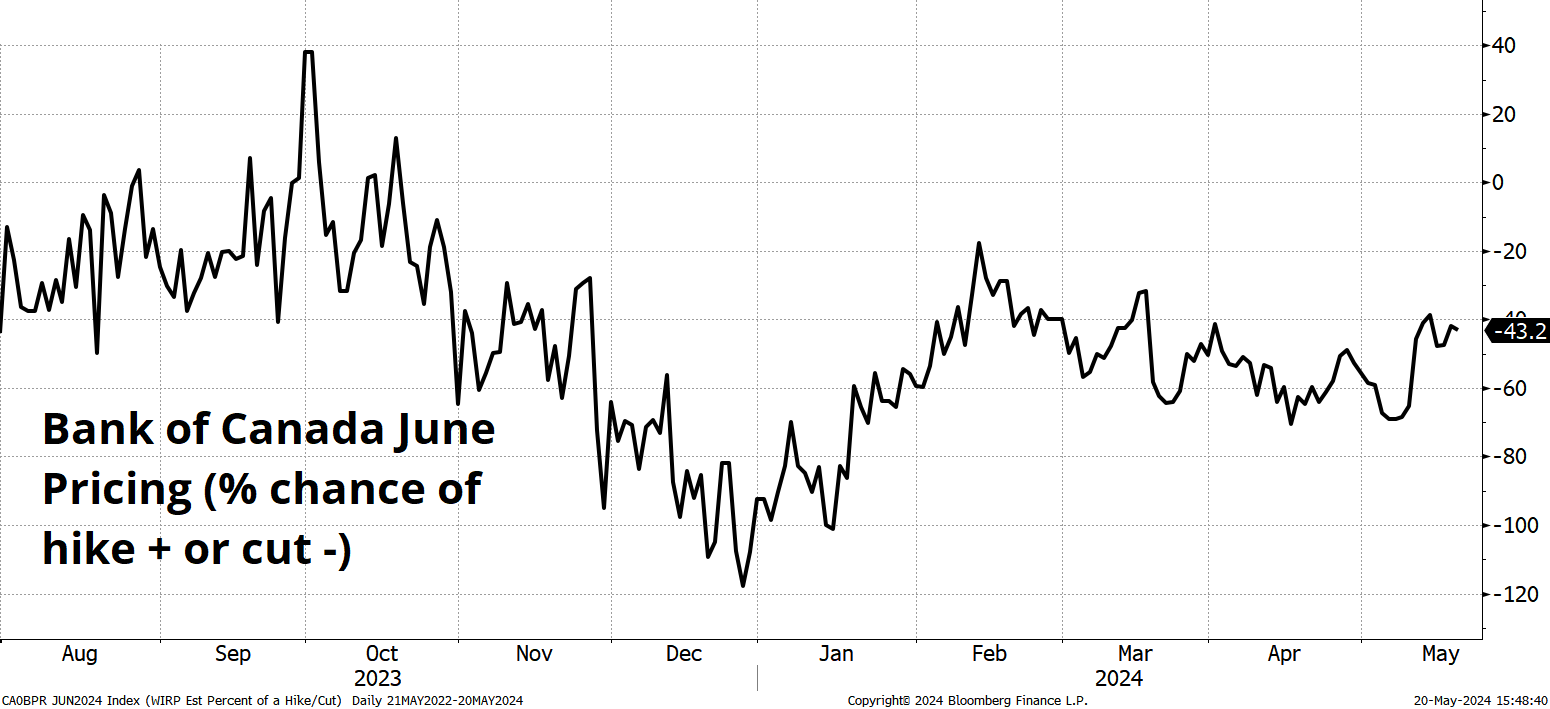
Today’s figure is the last CPI or jobs release before the June 5th meeting and a strong number, if it were to transpire, should take rate cut odds close to zero. Data matters more when it directly impacts market pricing and, in this case, you can’t get more sensitive than a key release a few weeks before a central bank meeting priced close to 50/50. Finally, the BoC has a Monetary Policy Report meeting in July, so that’s one last reason for them to wait for more data.
I like splitting the risk 50/50 between short EURCAD spot (to take the USD out of it with Waller at 9:00 a.m.) and overnight 1.3610 USD puts in USDCAD. The overnight put gives you leverage and the EURCAD expression protects you if Waller is super hawkish. The 30-minute moves in EURCAD and USDCAD following CPI tend to be 20 to 30bps. My plan is to cover the EURCAD towards the end of the day no matter what (if it’s not stopped out) and play the USDCAD by ear depending on the CPI + Waller exacta. I expect this trade to last 12 to 36 hours. See sidebar for details.
A useful list of free finance newsletters to consider from Sam Ro.
Have a moist day.
Carry On
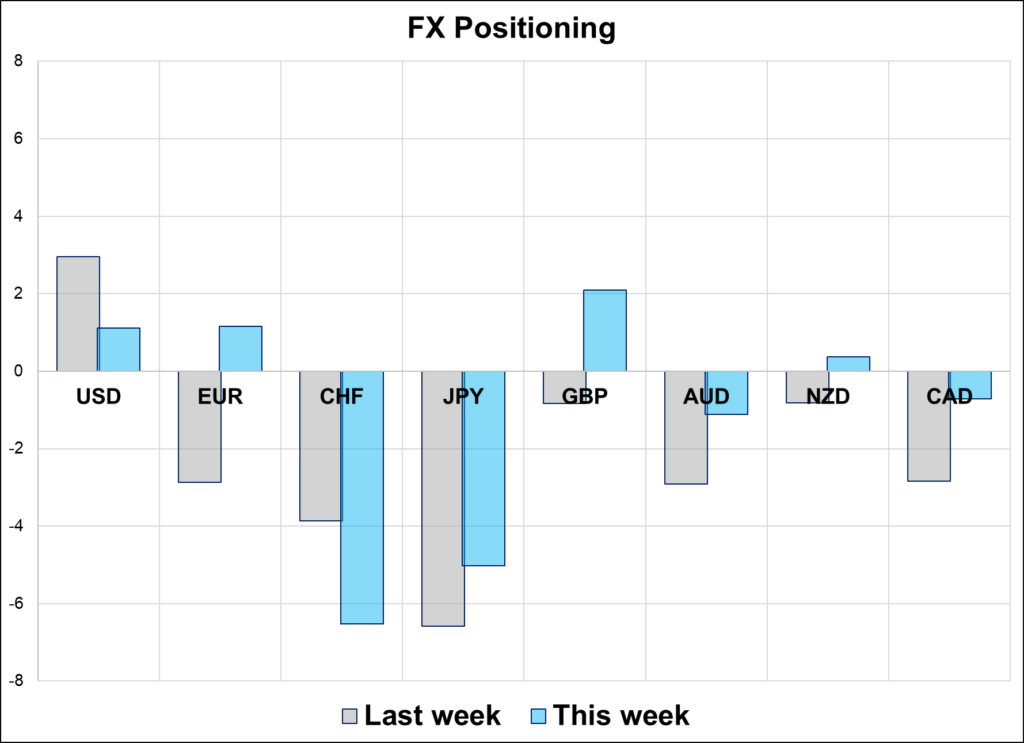
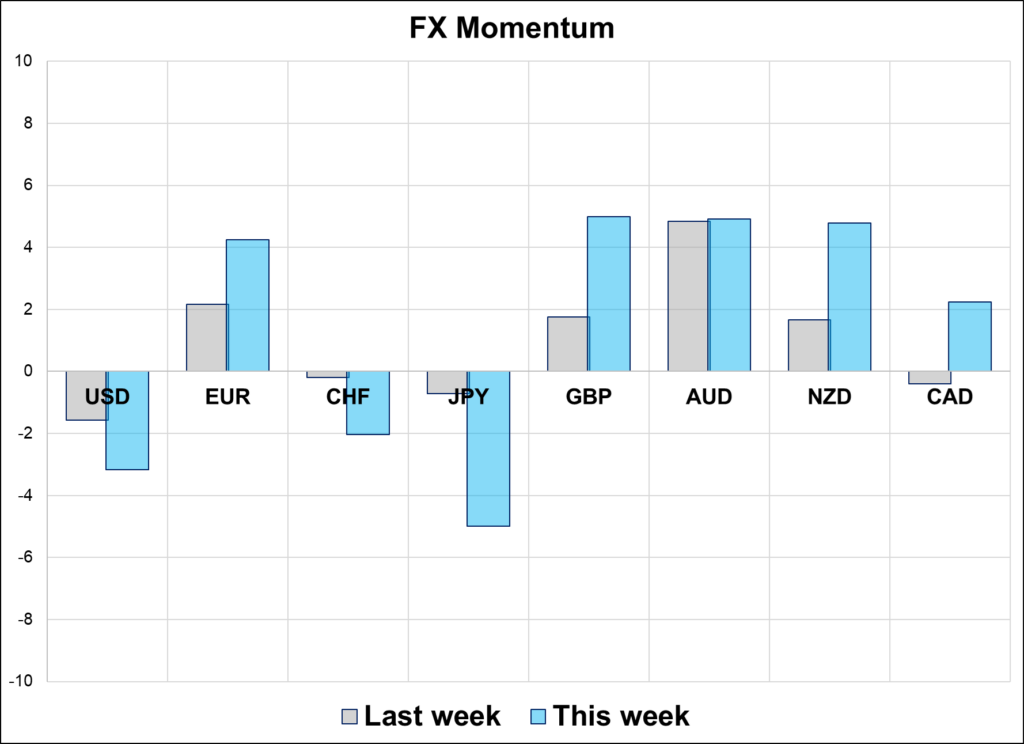
As one might presume, the market is short funding currencies and reducing shorts in cyclical currencies as the USD loses momentum and volatility is pinned to the floor. A world of 12 VIX, every stock index at the ATH, and the Fed out of play on modestly slowing data is Goldilocks for carry. The large USD long that featured prominently about a month ago is gone.
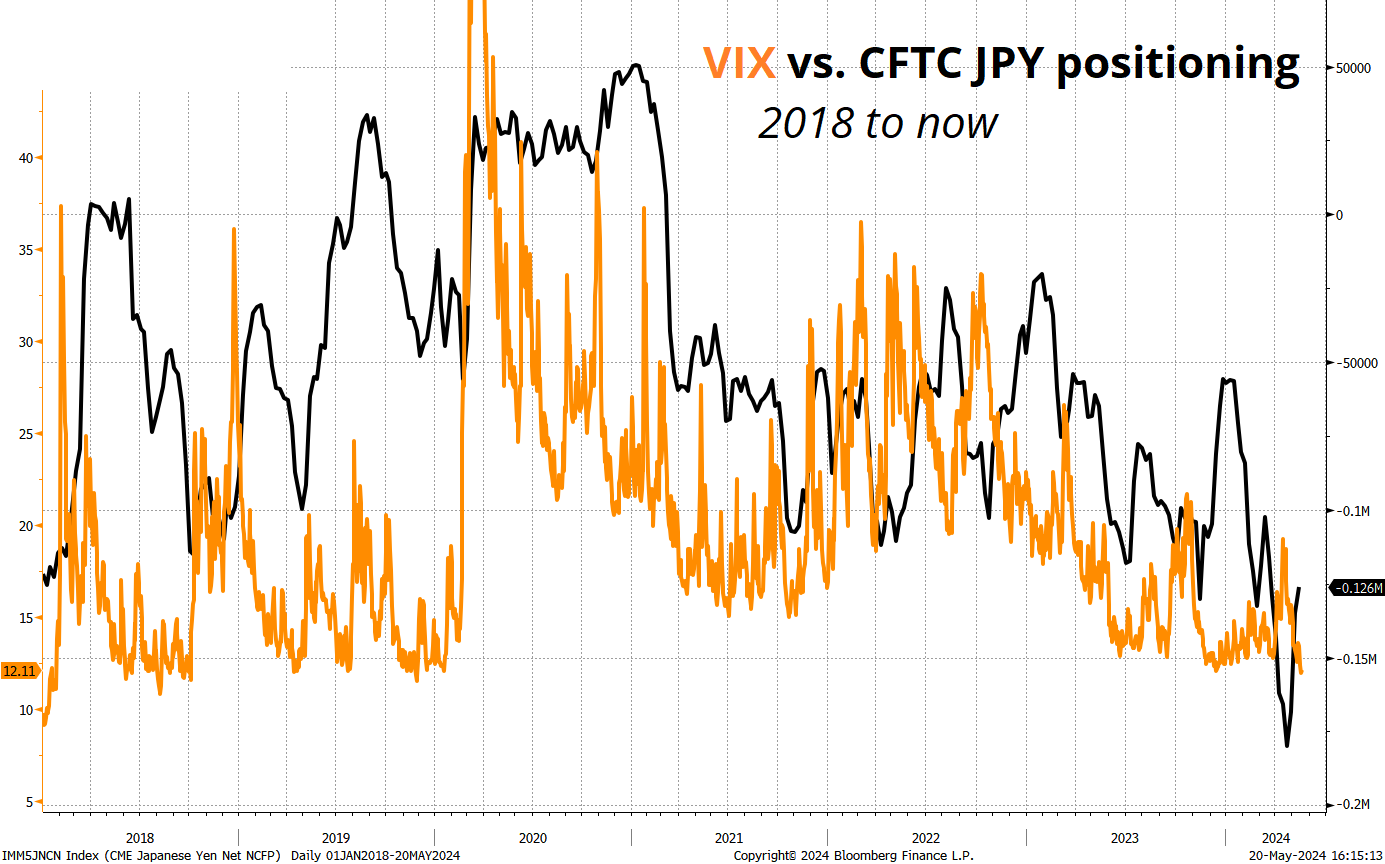
USDJPY became a worthwhile carry trade again around the start of 2018 as the Fed was hiking rates meaningfully higher while the BoJ kept things pinned toward the ZLB. As such, there has been a tight stimulus/response function where higher VIX makes carry and carry/vol less attractive and so the CFTC reduces JPY shorts. You can see it in the chart here, keeping in mind that the VIX is real-time while the CFTC data is released with a delay.
See how each time the orange line spikes, CFTC positioning reacts shortly after. This is consistent with how a safe haven might react, but the JPY was not a safe haven in 2022 (bonds down, JPY down, stocks down) and yet the CFTC still reacted to shifts in the VIX because presumably similar jumps occurred in JPY volatility and carry is always adjusted for vol.
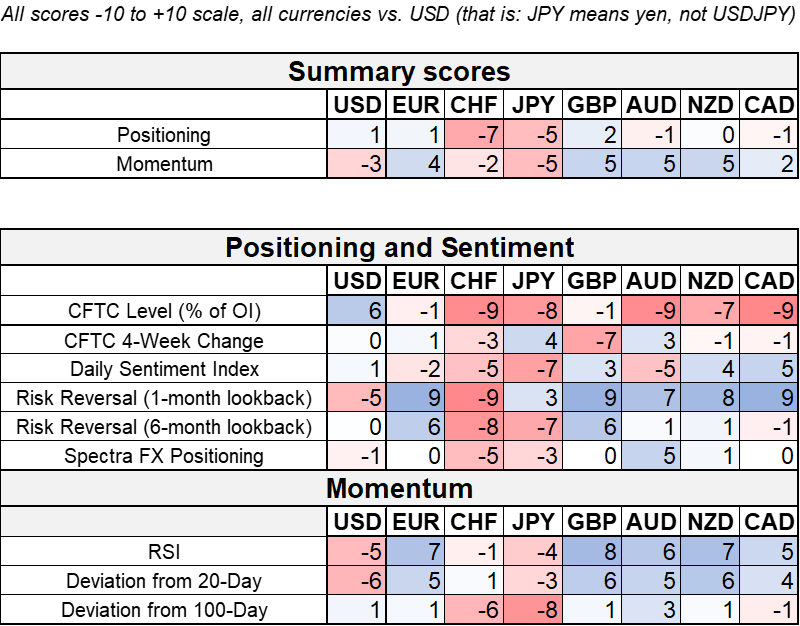
Final note: I discussed in am/FX how positioning is a reverse indicator in some products, and it is not in others. See am/FX here, near the end. In carry currencies, positioning and the currency tend to trend for long periods (in contrast to CAD and GBP which are more mean reverting). Therefore, extreme long SPX or short CHF or short JPY positioning is not contrarian, generally. It’s just a trend indicator that represents potential kindling for an exogenous shock.
Today’s -7 positioning score for CHF is the lowest we have seen in the history of this report (back to October 2022). So, if VIX turns higher, there is plenty of kindling for a CHF rally, but it’s not tradable in isolation. The short CHF position has been remarkably resilient throughout 2024.
Water molecules are too small to visualize with light waves, but here’s what they might look like
https://www.newscientist.com/article/mg15320693-200-science-what-really-makes-water-wet/
David Clary and his student Jon Gregory probed “wateriness” by using a complex mathematical model called the quantum Monte Carlo method. They investigated clusters ranging in size from two to six molecules in order to evaluate their properties and compare them with the familiar properties of bulk water.
They found that groups of five water molecules or fewer have planar structures. These would form films one molecule thick, rather than puddles. But, add a sixth molecule to the group, and the cluster switches to a three-dimensional cage-like structure which mimics the familiar properties of bulk water. “As soon as you get six, it flips over to three dimensions, and that’s why it suddenly has the properties of water,” says Clary.


This piece is mostly for people who are interested in backtesting

