June 9, 2023
Into ECB
Into next week, I think there will be a runup trade selling euros because the data in Europe, and particularly Germany, has turned down hard. This is not just a matter of soft sentiment data maybe kinda pointing to weakness; the hard data in Europe is soggy like forgotten Cheerios and therefore the market will want to position for a dovish outcome where the ECB signals they are almost at the finish line as risks tilt from inflationary hellfire to disinflationary manufacturing bust.
Citibank economic and inflation surprise indexes for Europe, 2010 to now
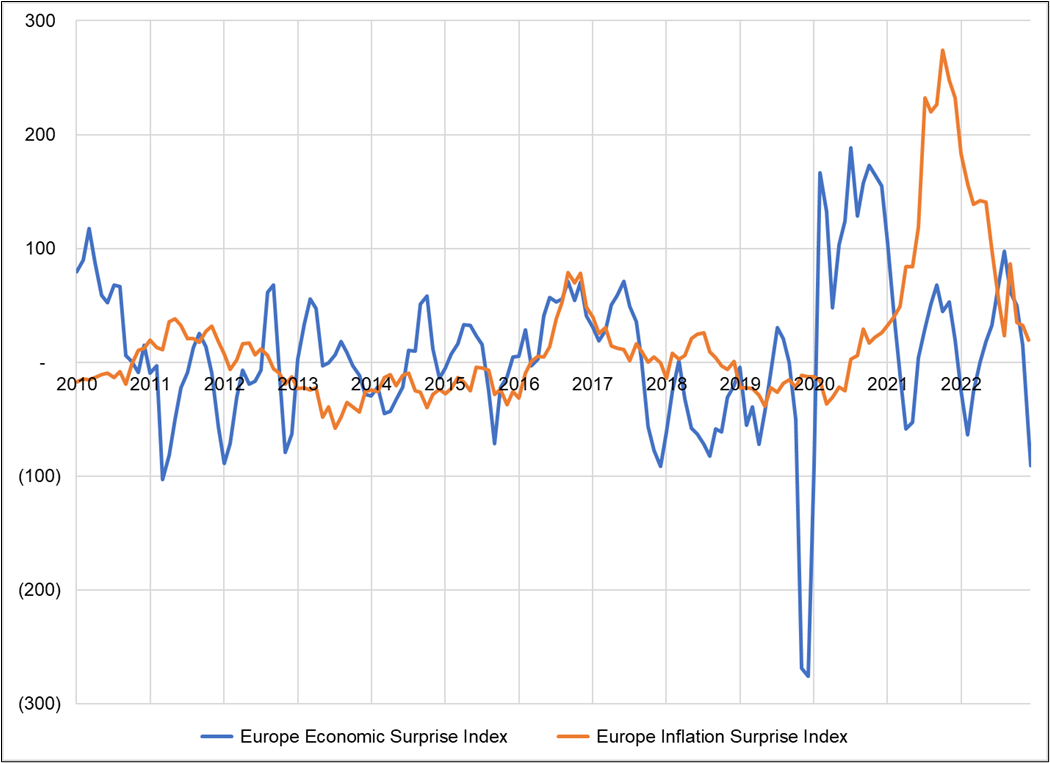
The methodology of the Citi surprise indexes is inherently mean reverting as you can see from the sin wave look of the blue line, but the only times we go below the current level of -91 on that chart are peak COVID, the Global Financial Crisis, and the Eurozone Crisis. This series, of course, represents deviation from economists’ expectations, not an absolute figure, but the headline data is also bad. Export figures out of Asia also paint a consistent picture that suggests trouble ahead for the German export machine.
With the economic data weak, the Fed near the finish line (maybe), and EU inflation rapidly falling, the market should lean towards a dovish ECB and a lower EUR between now and next Thursday. Whether this assessment is true or not does not really matter as what I’m talking about is price action going in. My dream scenario is EURGBP is on the lows Thursday morning, and I can cover before the ECB meeting. I will now drag the stop down to 0.8656.
If you are flat EUR, you might consider selling EUR against your favorite currency. EURAUD, EURMXN, EURJPY, etc… Depending on your risky asset and yield view. Or do a basket of those three 1/3 1/3 1/3 and cover before the meeting.
Naz
I have been wrong on the NASDAQ and neither right nor wrong on NVDA so far, but I continue to believe this is the zone where you take a shot at being bearish both.
The fight right now seems to be between momentum flows and short-term people like me that see a lot of interesting red flags and a good place to fade the rocket ship. The bubble in everything that started with the seismic fiscal and monetary response to COVID played out much like the 1999/2000 bubble, but in slow motion. Here are the two charts.
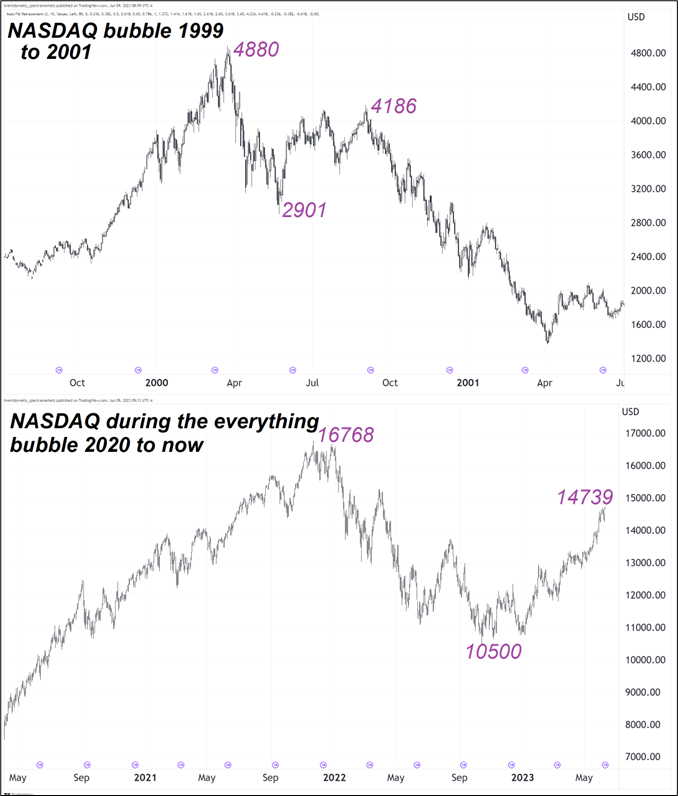
While the magnitudes are comparable, the 1999/2000 bubble happened at light speed compared to the 2021 bubble. Here is how they played out, using the start day as 50% of the high.
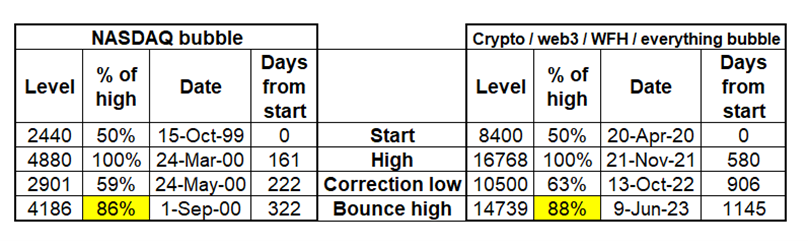
You can see they both doubled, then dropped around 60% and in 1999 the last rally was 86% of the high while the current rally is right there at 88% of the 16768 high printed in 2021. It’s just a bunch of numbers, and may have no predictive value, but the parallels have been pretty striking throughout, whether it was the stadium naming or the Superbowl ads, or “Company X gonna change the world” language, etc. So I think it’s worth considering that this wave here in the NASDAQ is the equivalent of the year 2000 rally from 2901 to 4186.
One mind-blowing aspect of the ’99 vs ’21 comparison is the rapidity of the 1999/2001 bubble in both directions. Never before and never again will so many day traders have so much fun. If you weren’t around in 1999, and you thought 2021 was stupid or fun… 1999 was 3X that.
Risk managing a bearish view based on an analog like this can be tricky because the analog is never going to be perfect. For me, if NQ takes out 15,000 or NVDA makes a new high, my view is wrong and I’m out.
BOJ
Expectations for the timing of a BOJ policy change keep moving to the right as you can see in that Bloomberg graphic. The best time own USDJPY downside is when nobody else does, like December 2022. Not much is priced in for this meeting as the implied overnight vol is about ½ of what it was at prior meetings, when expectations ran hot.
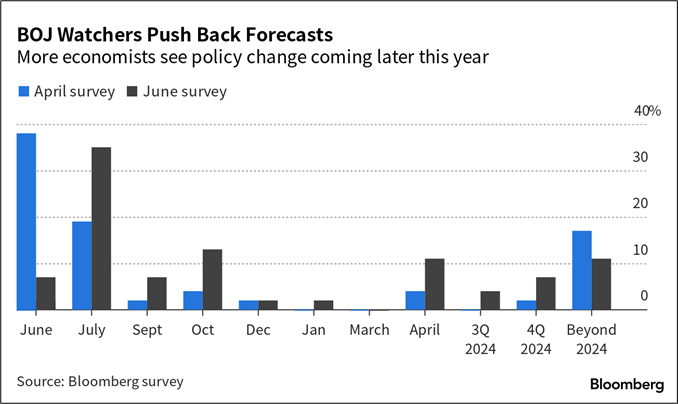
It’s probably worth owning some downside optionality in USDJPY next week, but as I said yesterday, CPI and FOMC make it prohibitively expensive for now and you would be paying for big events you don’t want. We will circle back to this next week.
I don’t care if Monday’s blue
A client asked me to chart SPX performance by day of the week and it’s kind of interesting so I’m sharing it with y’all. The obvious standout is Turnaround Tuesday. Stocks went down 56% in 2008 but if you were only long on Tuesdays in 2008, you made serious money. That is probably one of the craziest stats in finance.
Monday and Friday are the worst days. My guess is that is because people are in a bad mood on Monday and like to reduce risk on Fridays. The world runs a large net long at all times and so any kind of risk reduction into scary weekend risk would usually mean selling.
Equity performance by day of the week, 2000 to now
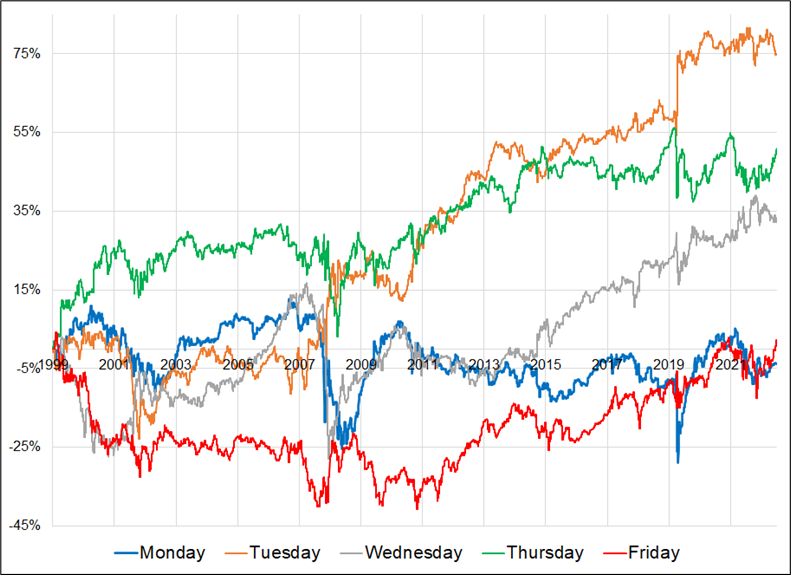
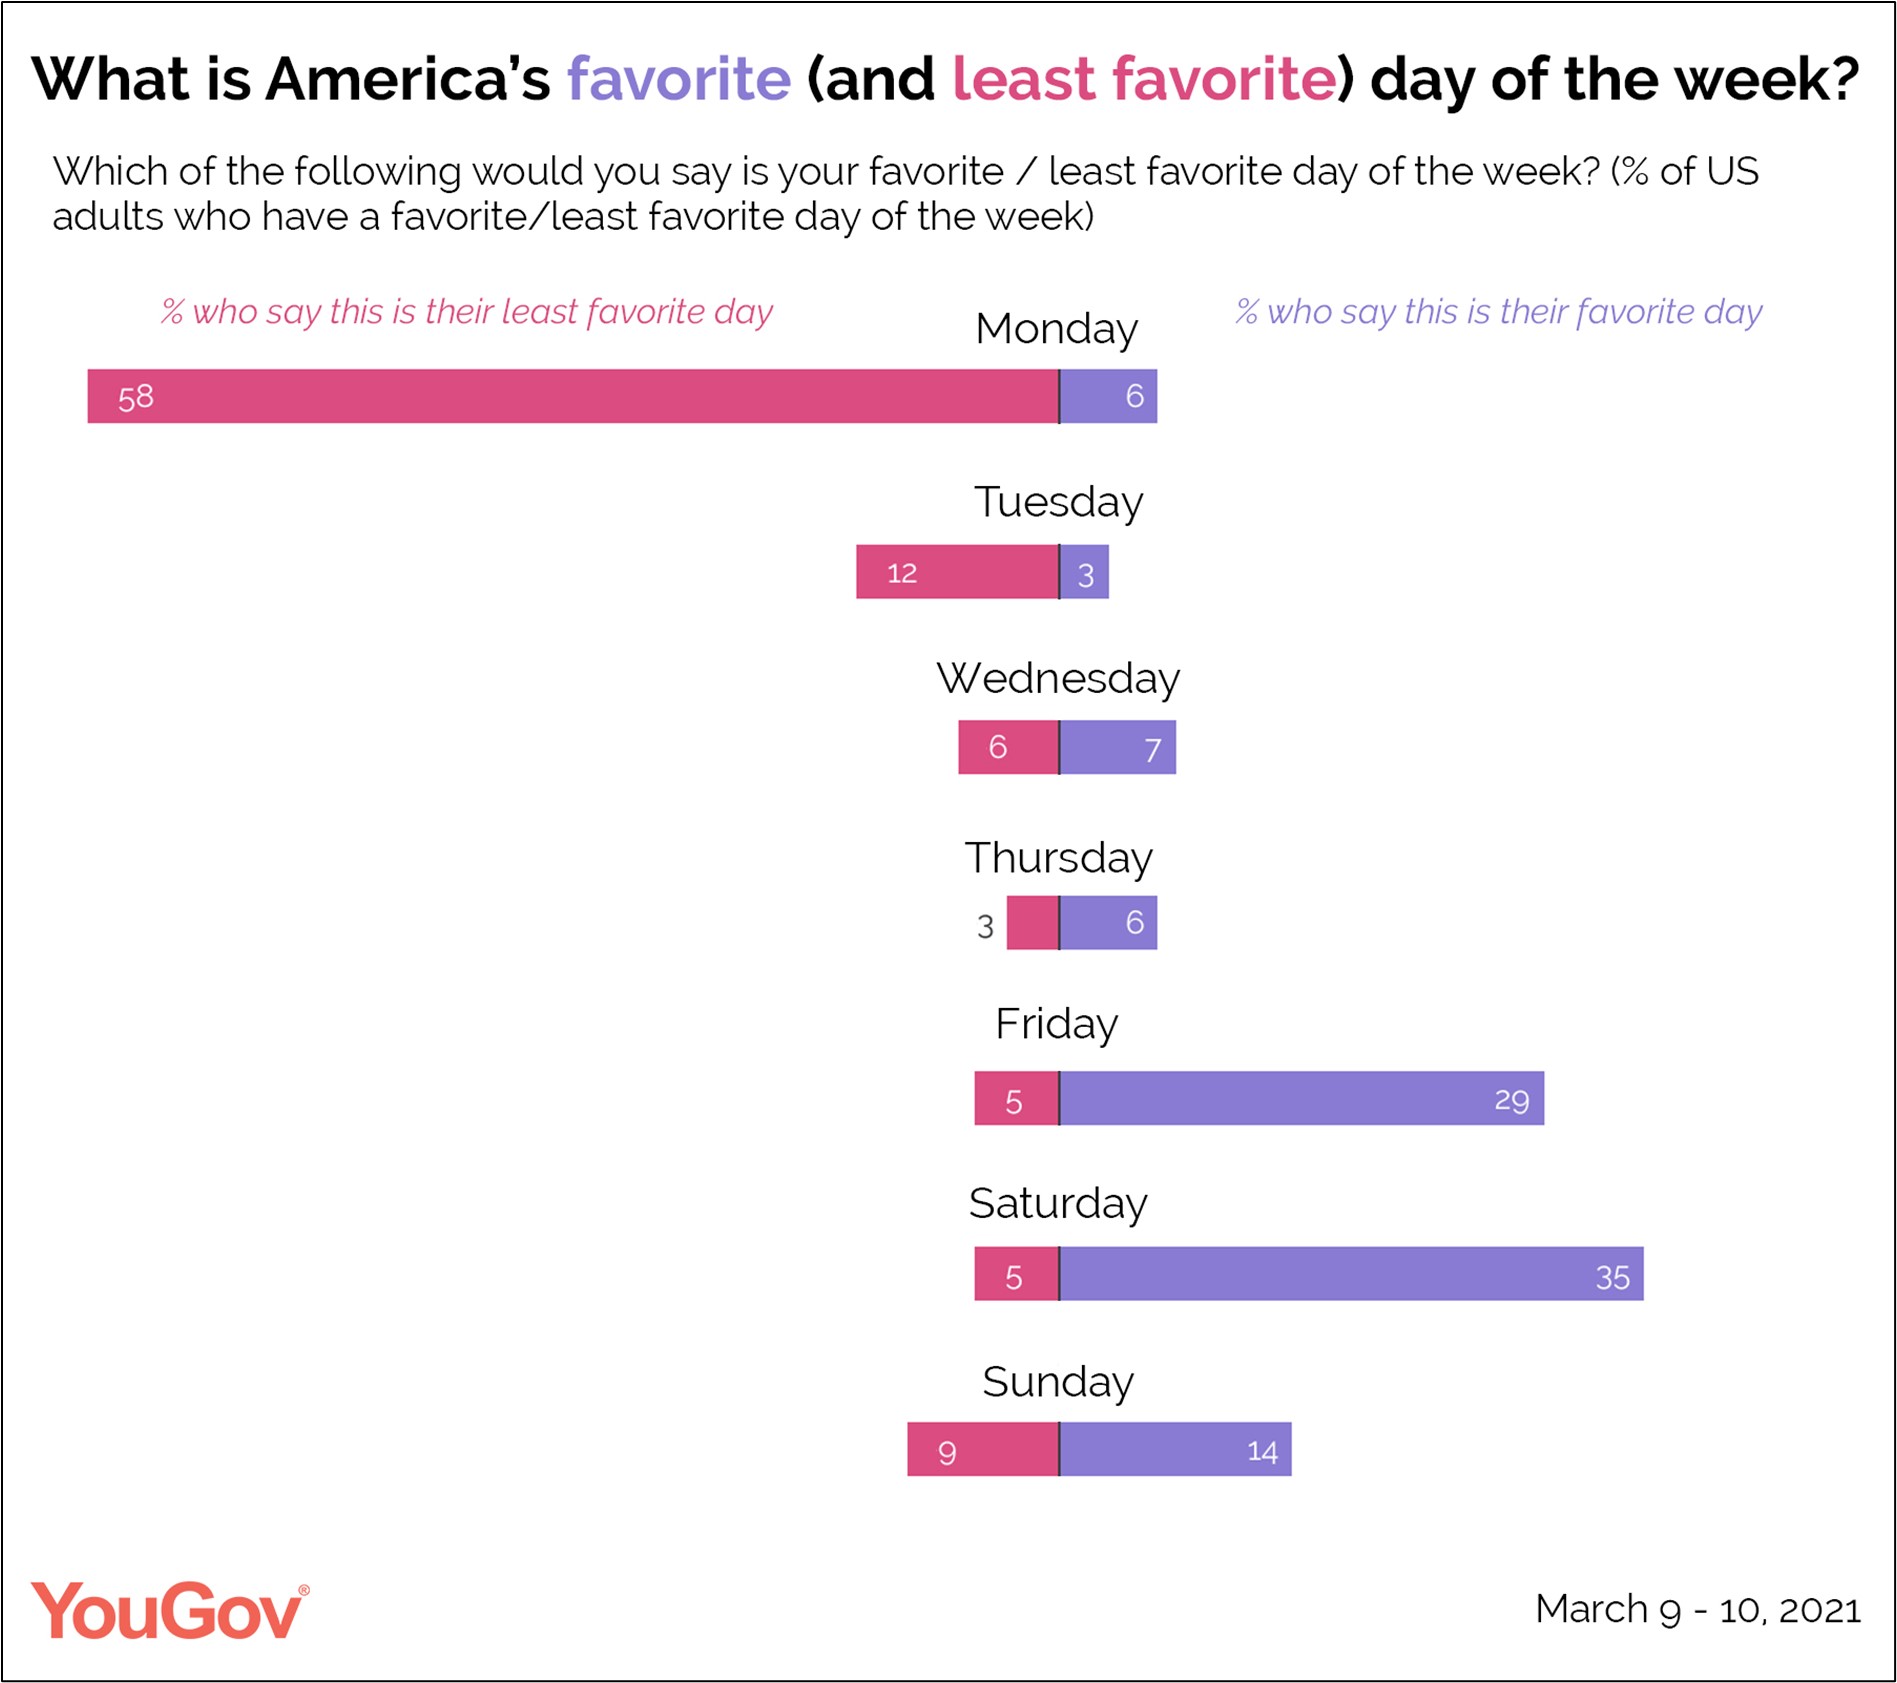
Obviously if it was only about mood, Fridays would be bullish, but my guess is that the risk reduction effect offsets the TGIF-i-tude. Also, the media has a strong negative bias, so perhaps people gobble up all that bad news all weekend and then come in not just grumpy but bearish on Monday. Less news consumption = happier life and better returns.
Final thoughts
Norway CPI through the roof and NOKSEK too. This move from 0.9700 to 1.000 is one of those rare times where the logical thing is happening in NOKSEK. Nice to see that. USDCAD good news, bad price on the jobs data but really not much has changed there. I may have an issue if it doesn’t rally before US CPI because that’s a big risk event and I don’t have a view on CPI direction yet. I’ll worry about that on Monday.
Hope you get a chance to have two bowls of too chilly chili in Chile this weekend.
good luck ⇅ be nimble