When there’s a big move in oil, SPX is a critical second variable
highlights
It’s not just about oil in isolation


Current Views
23MAR 158.30 USDJPY put 22bps off 159.65 spot
Hedged 55% 157.50/158.30
2APR .69/.68 AUD put spread
21.7bps off 0.7025 spot
Short EURUSD 1.1527
Stop loss 1.1677
Take profit 1.1367
Short 07APR EURCHF 0.9010/0.8960 put spread +
long 07MAY 0.9110/0.9160 call spread for 2bps
Zippy
Yesterday we saw price action of the sort we used to see much more often when humans traded events more aggressively. In the olden days of 2000 to 2015 or so, every market event, central bank meeting, and economic data release was a battle of fast money and algorithms and occasionally every human being and computer would end up on the same side of a trade. This would lead to egregious reversals and blowups, usually about one or two hours after the event itself.
These crazy reversals have not been as commonplace in recent years as economic events just haven’t had the fury they used to. I am not sure why this is the case, but the market just doesn’t trade events as aggressively as it used to. Anyway, yesterday, the market got into its head that the monster moves in rates, and the central bank hawkishness was bad for EUR and GBP particularly. I thought this too, selling EURUSD at 1.1527 as per my view described yesterday in am/FX. We had everyone on one side of the boat and so this happened:
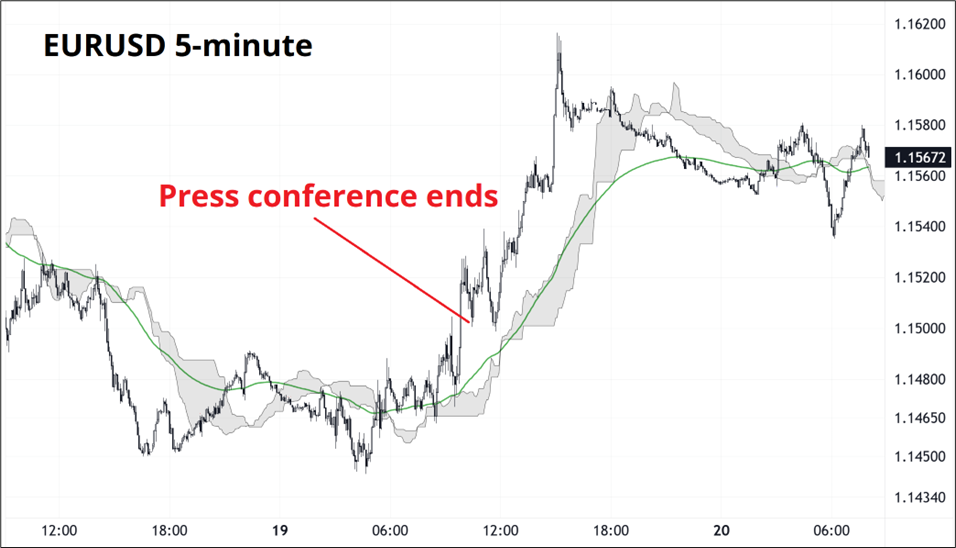
There was no real macro explanation here. The market sold too many euros and bought them back. I also don’t believe this has much meaning going forward. The mixture of news on central banks and the moves in rates are all driven by the current oil shock and nobody knows how that will end. If you think it’s going to be done soon, you receive rates and sell dollars. If you don’t, you do the opposite.
Here’s a chart:
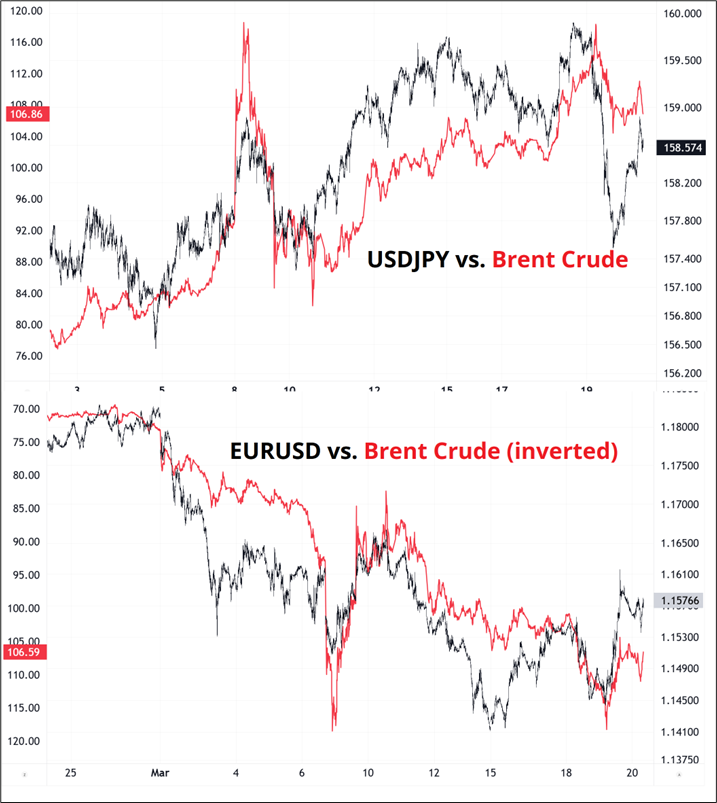
Whatever you are trading, you are trading oil. Actually, that’s not completely true. I think what we are trading here is a combination of oil and equities. The regime of OIL UP/STOCKS DOWN is a radically different one from OIL UP/STOCKS FLAT or OIL UP/STOCKS UP. Bigger picture macro, this is pretty obvious because in a regime where global demand is strong, you have a happy story and assets perform well. In a supply shock, you have a bad story, and risky assets tend to suffer. The current situation is somewhere in the middle as it’s clearly of the bad variety in theory, but if it’s binary and temporary, there’s no reason to sell stocks or be scared. Everything will mean revert and anyone who sells the hole will be disappointed.
Nowhere is this regime-dependent disparity of performance more evident than EURNOK. While higher oil prices should benefit Norway, in theory, that’s not how currency markets behave. Hedging of Norwegian foreign asset holdings dominates if U.S. equities sell off hard. Here is a matrix showing four-week win% for EURNOK in various oil vs. SPX regime combos.
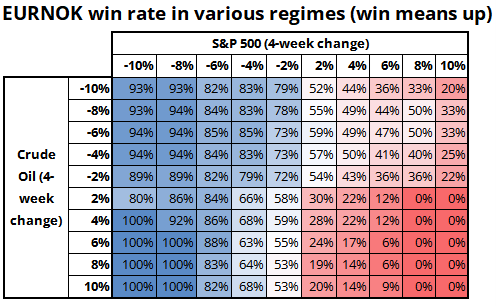
Most of the time, raw correlation numbers don’t mean much. It’s not usually that simple. It’s either non-linear, or there’s a second critical variable, or both. I think this is an important thing that not everyone always understands. Now you may look at that table and wonder about the sample size when you see numbers like 0% and 100%. The sample sizes are mostly quite good.
For example, the regime where oil is up 6% or more and SPX is up 6% or more in the same 4-week period, EURNOK is up 2 times and down 34 times. It’s remarkably consistent. The lessons here apply to many correlation observations. If you look at one variable (oil) in isolation against another asset, you miss the complexity of the oil vs. risk appetite interaction. You can’t just overlay oil and EURNOK, you need to be aware of the fact that higher oil is good for NOK but only when equities are stable. If equities crap out, NOK selling by equity hedgers completely dominates the oil-positive story. Note: When I say “crap out,” the meaning is “fail” as in, rolling a 2, 3, or 12 in craps. It has nothing to do with anything scatalogical.
Looking at single variable correlations to FX or to any other asset class very often misses all the nuance and is completely useless. Those huge correlation grids are an okay starting point, but they are overused. Digression complete.
The market is still trading this as if it will be over soon and the price impact of higher crude will be temporary. Or, the market is saying that the global economy is strong enough to handle higher energy prices. This second assertion is not completely insane given that gas and oil prices, adjusted for inflation and wage growth over the past 10 or 20 years, are not particularly high. The share of consumer spending going to gasoline and energy has been in a down trend for ages and this provides a buffer for a while. See chart.
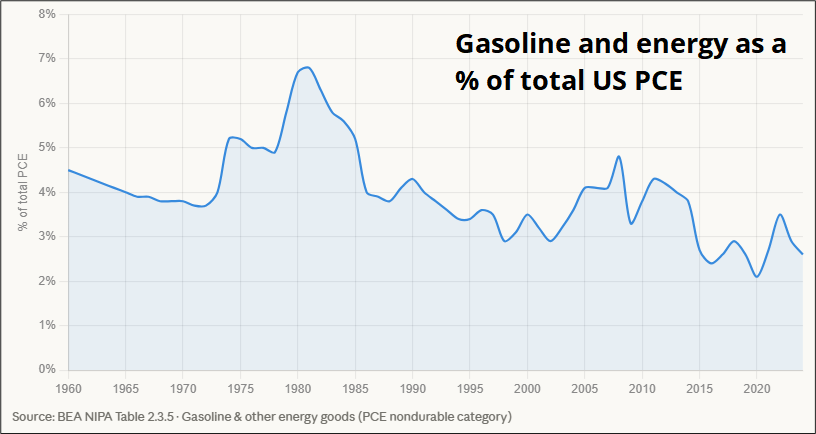
$4 gas is not scary like it used to be.
Still, this all feels a bit overly optimistic to me as the offramps don’t look obvious for the war, and other micro factors suggest stocks might release to the downside soon. Quad witch is today, tax refunds are mostly in the bank and haven’t moved retail favorites or crypto very much. Concerns on corporate credit remain, while gold and silver show there isn’t that much liquidity in the system right now.
I think this is the rare moment where stocks have negative drift and topside convexity over the next few weeks. Each day that passes without some sort of resolution is a drag on consumers and confidence and should lead to tigher and tighter financial conditions. At some point, this will trigger a capitulation by CTAs and those most hopeful of a clean end to the war. This is much less binary than we all wish it is because even if the US and/or Israel decide they’re done, Iran doesn’t necessarily have to agree.
So for now, I am sticking with the bearish EURUSD and AUDUSD view for a retest of the highs in oil and rising risk aversion next week as the SPX gamma rolls off and more bulls fold. The USDJPY trade has worked well so far as we got a deep move through the strike and have now hedged 55% of the notional. That thing expires Monday.
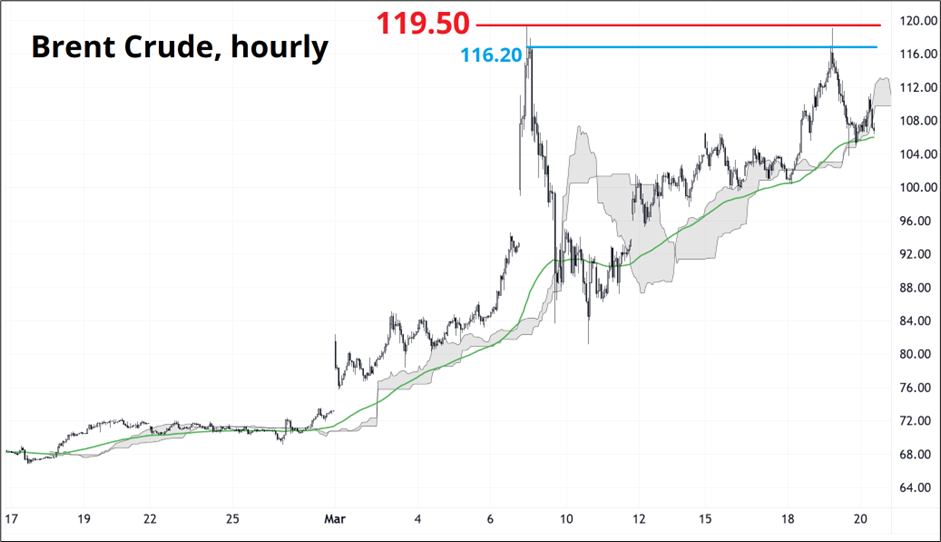
The Brent crude chart is interesting because when Russia went into Ukraine (again) in 2022, oil never took out the highs after the initial explosion. That is true now, too, as we have made a huge double top at 119.50 so far. If the experts are right and this is the biggest shutdown of oil capacity, ever, we are going to make new highs barring a rapid de-escalation. Problem is that de-escalation doesn’t guarantee how far energy prices will fall. There is permanent damage to some facilities, with LNG capacity in Qatar, for example, unlikely to come back to previous levels for years and reopening of Hormuz likely to take weeks or months.
Final Thoughts
Few things on Twitter are more boring than the debate over whether oil shocks are inflationary or deflationary. It’s regime dependent, and the correct answer is mostly: BOTH. Here is a Google Deep Research analysis of the question. It’s pretty good, overall.
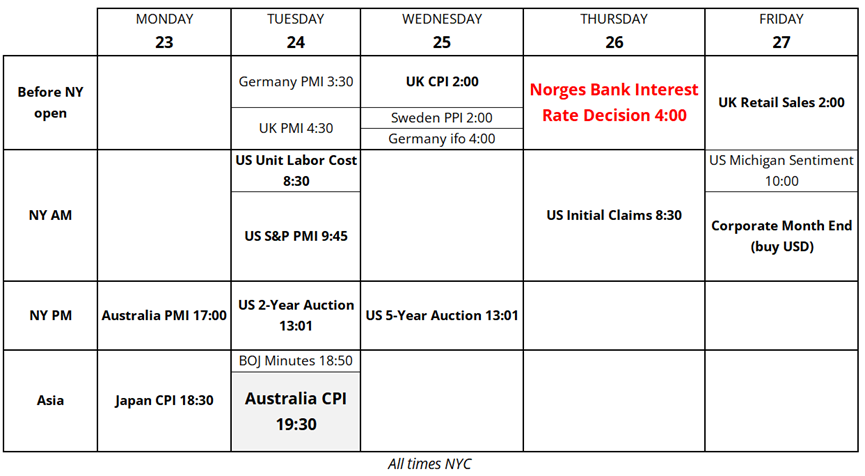
Have a sunny weekend. Calendar below.
Trading calendar for next week