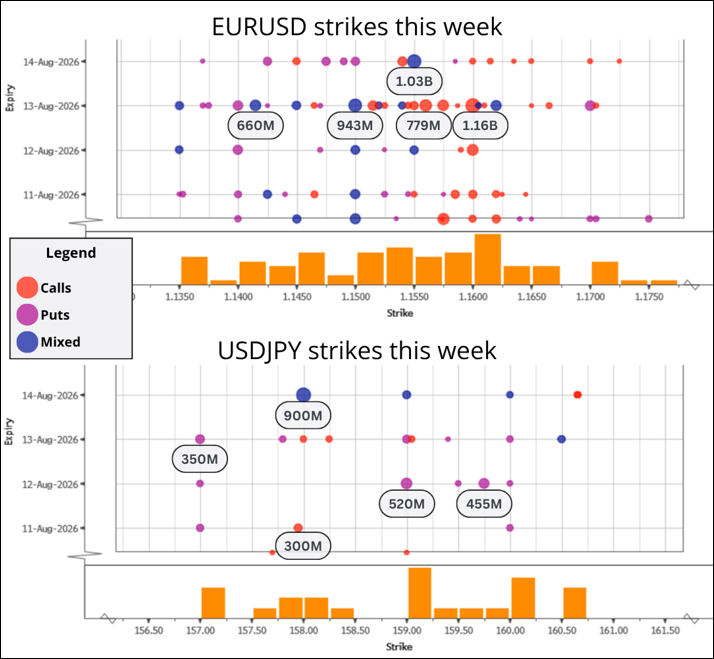
JPY
The U.S. and Japanese authorities are running into a bit of an issue because:
- Coordinated intervention has a history of working out, but not without some severe pain first. See August 3 am/FX.
- Bessent credibility not super high for reasons I have outlined in past issues. See Friday Speedrun for the full discussion.
- S. yields not backing off.
- Market went short USDJPY at not great levels on the excitement around coordinated intervention, so positioning is quite mixed now, not mega short yen.
- BOJ, which is priced at 63% for a hike in September, seems to be more like 80% in the mind of the market.
To dig a bit more into that final bullet. The reason USDJPY has been so bid for so many years is the combination of permanently loose monetary policy and loose fiscal policy. We are probably at the point of maximally loose fiscal in Japan as Takaichi’s approval rating falls and she is less able to stuff through new fiscal initiatives. Her approval is falling on a variety of factors, but number one is the inflation/cost of living problem. To stabilize popular support, she needs to stop with the JPY-negative policies.
If you believe that the delta of loose fiscal has peaked, which I do, then the question is whether monetary policy might become less banana-like. September is somewhat expected now, and this has been reinforced by this Kyodo article this morning:
★BOJ hints at September rate hike, key factor in coordinated intervention
It was learned on the 10th that the coordinated yen-buying intervention carried out by the Japanese and US governments on July 31st (Eastern Time) was decided by Bank of Japan Governor Kazuo Ueda’s strong indication of an interest rate hike in September. The US side appreciated this and aligned its efforts to prevent the yen from depreciating further. This was revealed by a Japanese government official.
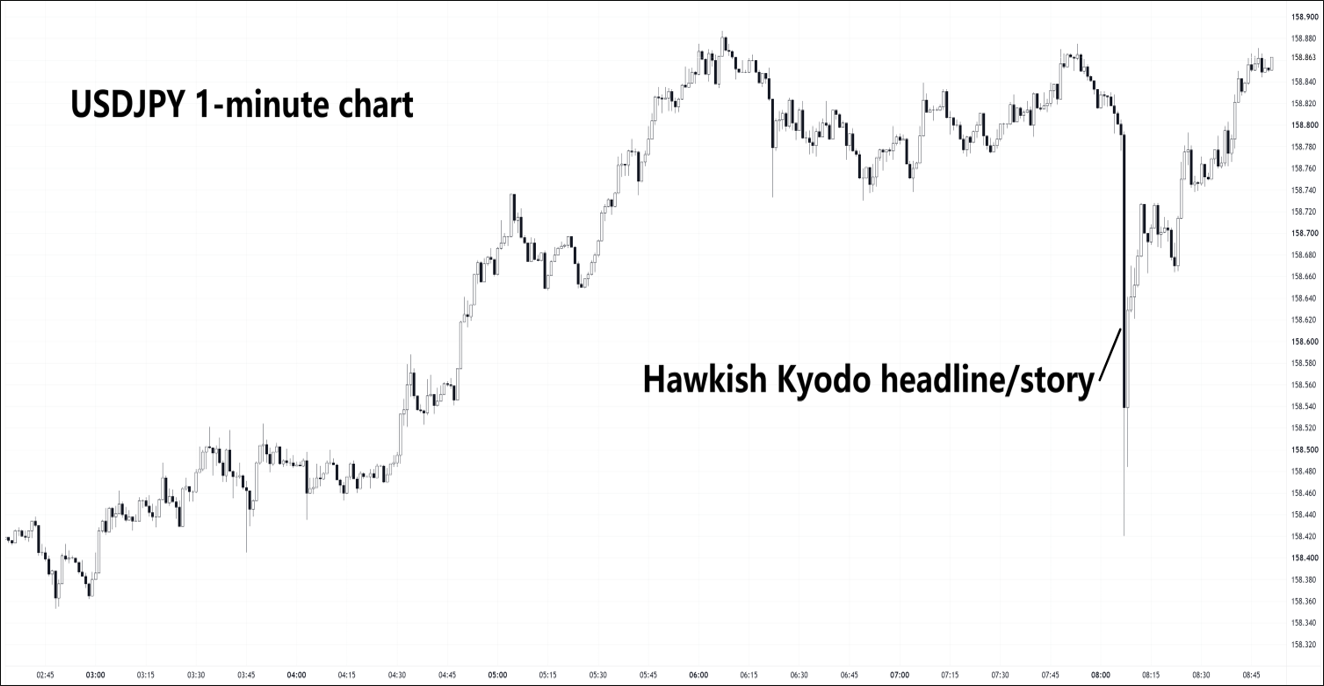
This is great, in theory, but look at what USDJPY did on this headline. The price action unequivocally shows that the September rate hike is kinda mostly priced in.
This all leaves policymakers in a tricky spot. The real game changer would be back-to-back hikes from the BOJ in September and October because this would show the market it’s not the same old BOJ. To give you a sense of the history, there has not been a back-to-back rate hike since the 1980s.
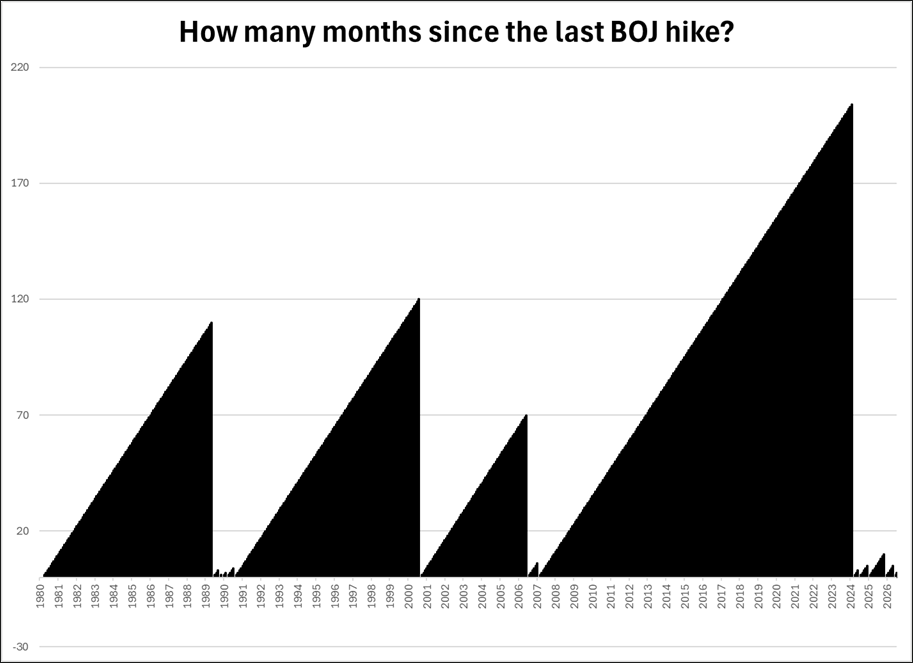
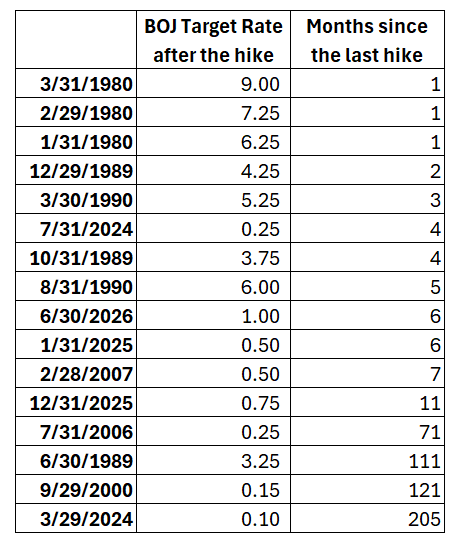
You can see in the first chart that this is already not the same old BOJ. Perhaps relative to peers, it is the same old BOJ, but they have lost their fear of hiking, and you can see that the current period looks nothing like any other period, including the 2006 hike “cycle”. But going back-to-back September/October would be a big deal and show that the BOJ is becoming increasingly orthodox as interest rates and the economy normalize.
In the meantime, USDJPY is right at the top end of the range I was expecting to dominate after the intervention (155/159). While it’s tempting to go short based purely on that ex-ante call, there isn’t much tactical or even macro reasoning for a USDJPY short right here right now. The seasonals are still bearish, the price is entering the sell zone, but the JPY bears are in control for now as far as I can see. So maybe better to wait until 160.00/50.
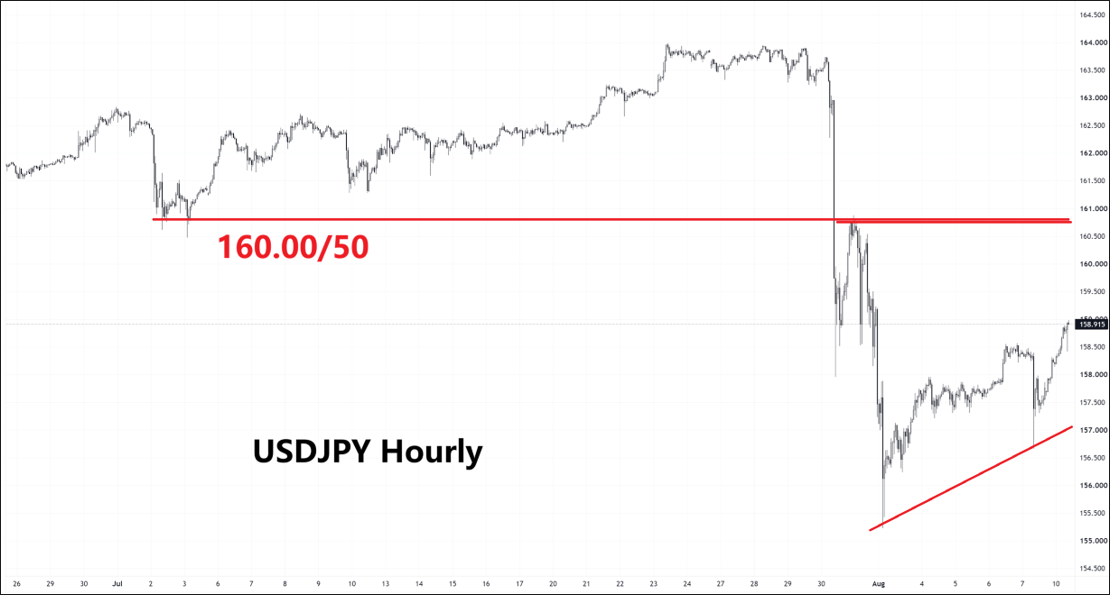
You can see the old lows became mega resistance and if you are patient the ideal sell zone is 160.00/50. People will now say every day that the MOF needs to intervene or they will lose credibility, but the simple fact is they cannot intervene every day. They have many, but not infinite bullets. My view is that both tails are fairly small and the base case is we chop in a big range either 155/160 or 152.50/160.50 on the wide.
RSI Mania
We are adding a new feature to the weekly positioning report[1]. Starting next Monday, an RSI grid will appear in the Monday report, along with discussion and backtest results for any items at the extremes, when applicable. For example, the heatmap here shows the current RSI for the 100 macro products we track.
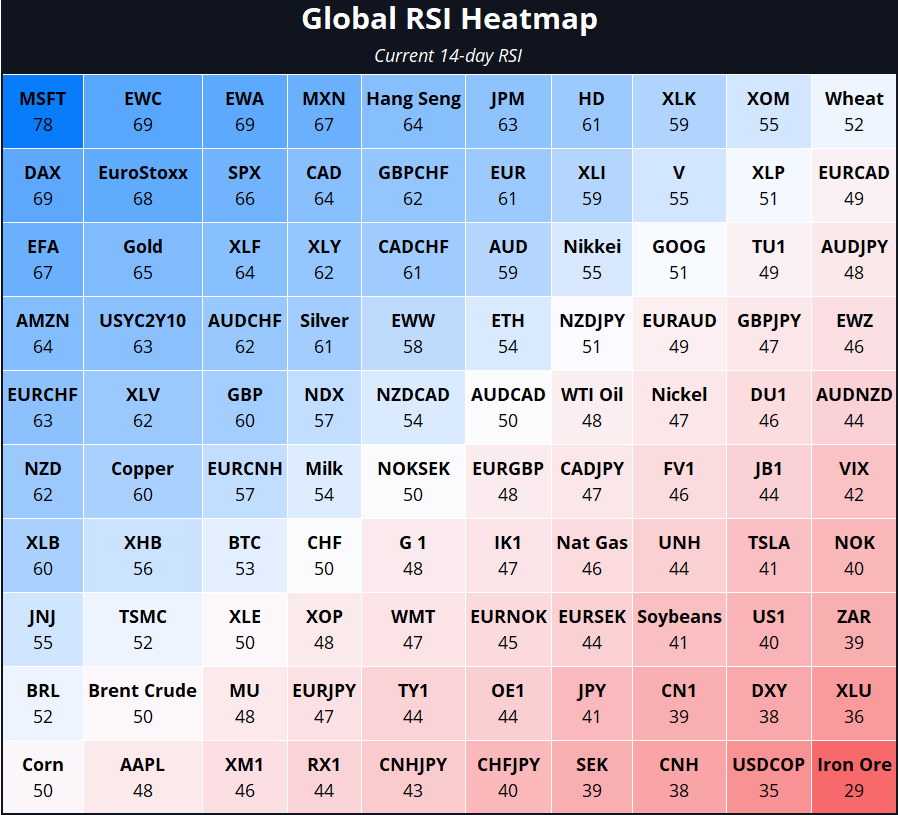
My experience with this stuff makes me most interested in the megaextremes. I have never found much alpha in “it went over 70 and now is back below 70” but when an RSI hits a figure that is multi-standard-deviations high or low, there is usually a story there. And quite often, if you have some other smart inputs, you can get to a great mean reversion trade.
I generally filter for levels of RSI that happen once or twice per year. As an example, below is MSFT backtested for RSI >75 and >80 overbought and megaoverbought. And <25 or <20 for the oversold and megaoversold readings.
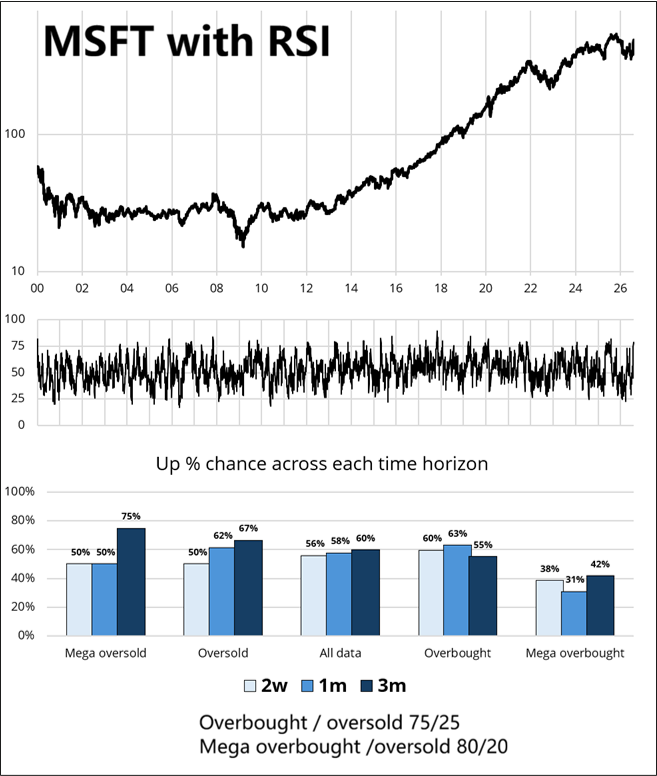
Sample sizes for the five regimes along the bottom panel of the MSFT with RSI image are 4, 16, 6662, 47 and 13. You can see that MSFT above 80 has been bearish, which is saying something for a stock that has gone from $20 to $440 split adjusted.
Every Monday, we will present the huge grid, then offer up any views or backtests that make sense. No signal here, but MSFT is getting close to a bearish setup.
Calendar
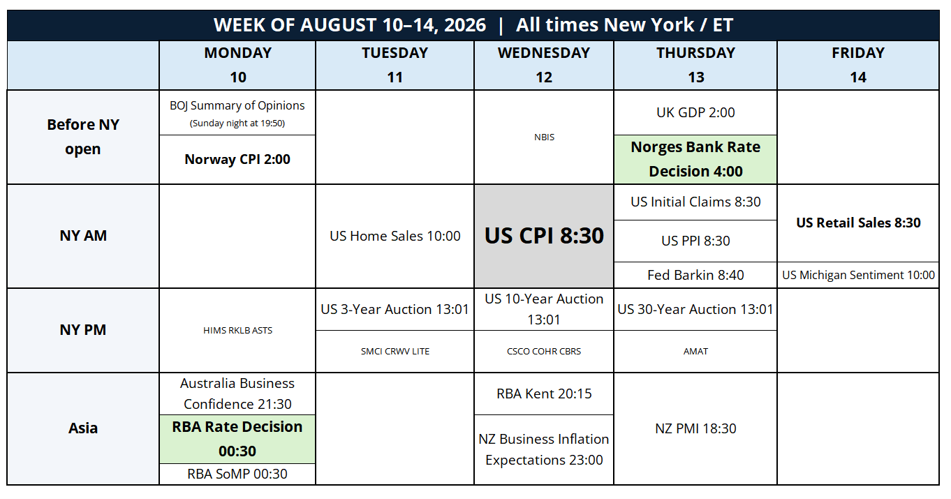
CPI Wednesday is obviously the big number this week as we continue to watch the Fed sound hawkish while they refuse to hike interest rates. Another weak data point would probably finish the job on Warsh’s June FOMC bluster and put the Fed back on permahold.
Here is the calendar.
Final thoughts
- This is one of the best things I have read on macro in quite some time. Some excellent and useful insights plus great writing.
https://www.aitkenadvisors.com/blog/forward-guidance-cold-turkey-comes-with-withdrawal-symptoms-but-the-patient-investor-always-recovers
- The SPCX trade was a humdinger. I do not allow “runners” when I trade so I got out just below $130. A 20% gain in 28 hours is enough. My belief is that the ex-ante plan is always best and fiddling with parameters once the trade on usually leads to suboptimal results. What’s your theory on leaving runners?
- The USDCNH trade has started out fairly well. The base case is USDCNH goes nowhere, so any day that it goes higher is a good day when you are long carry and 30-day realized vol is 1.65%. Just getting started obv.