AUDCNH? Ok!
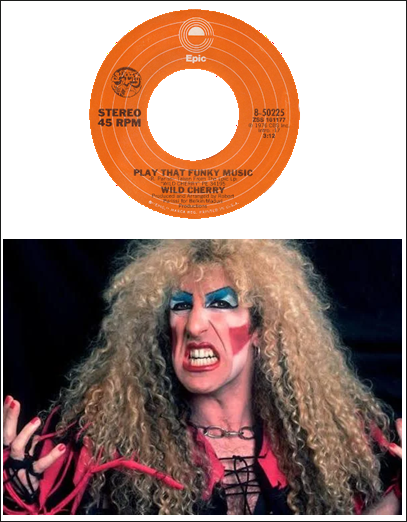
Cowbell : Spotify Stream ratios at bottom of page.

AUDCNH? Ok!

Cowbell : Spotify Stream ratios at bottom of page.
09SEP USDCNH call spread
6.7300/6.7400 for 33 CNH pips
Risking 33 to make 67 off 6.7430 spot
10SEP CHFJPY put spread
199/196 for ~37bps off 200.50 spot
The FX setup into CPI looks symmetrical to me as market positioning is not extreme and conviction is low. Out of office replies are near their seasonal maximum and then we will soon enter the period where everyone starts to gear up for the stretch run and markets re-engage and look for themes. Right now, the macro themes are somewhat familiar.
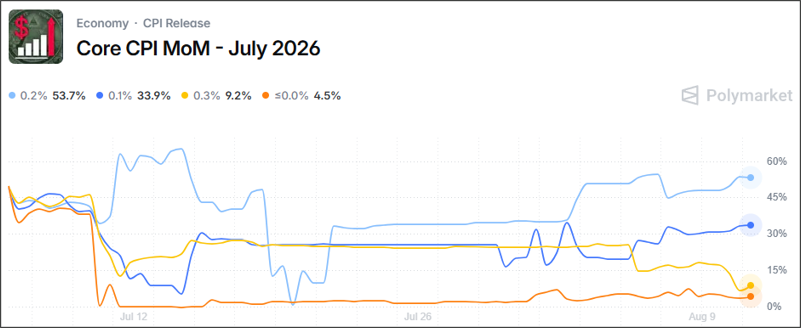
So that is the basic setup here going into CPI. September is priced 60/40 for no change, which is quite something given July got near 50% at one point. In other words, we could have had two hikes by the end of September and now we’re probably getting zero. The entire “new sheriff in town” story was a red herring. In the next section, I will go through some thoughts about CPI.
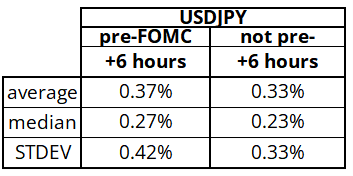
Sadly, my theory is not wrong, but it’s not right enough to make a difference. Here is the average move in USDJPY and in the six hours after a CPI release, split by pre-FOMC CPIs or not pre-FOMC CPIs. You can see there is no meaningful difference whether CPI is right before FOMC, or not. Just thought you should know. Same deal with gold.
FX carry is boring to talk about at parties, but it can generate significant uncorrelated returns for patient investors. For example, there is the quite stunning fact that MXNJPY (including carry) outperformed the NASDAQ over the past five years. Most of this outperformance came when the Fed was hiking, but it’s still a crazy factoid (via Tim Power).
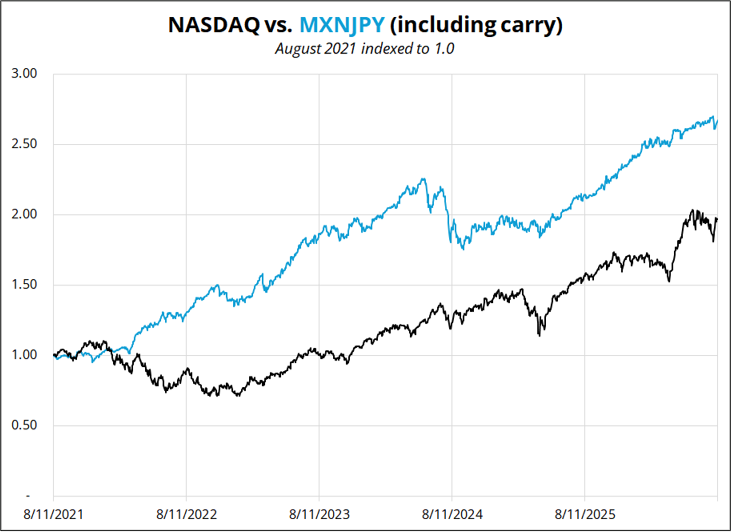
This analysis comes with the benefit of hindsight, of course, and the yen carry trade could be over as the BOJ hikes rates and the powers that be attempt to defend the JPY. Moving forward, what might be the next high-Sharpe carry trade that you can add to your portfolio for diversification and high nominal returns? Here are some very quick thoughts on some funders and high-yielders.
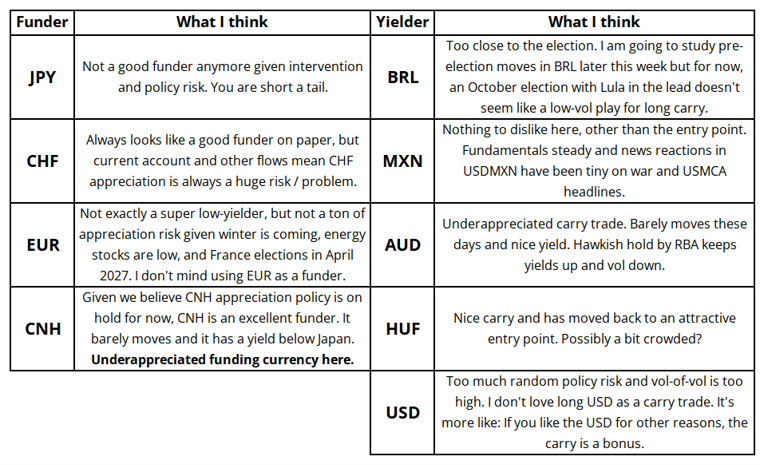
This is another good example of: I write to find out what I think. Two hours ago, I had no view on AUD and certainly no view on AUDCNH. Now, I like that pair as a nice carry trade and you can do 2-month AUDCNH options (for example) if you work at a hedge fund. This view will always be subject to change if PBoC policy preferences change, but for now CNH is a low-vol, low-yielding thing that isn’t going anywhere, and AUD is a high-yielding thing that probably isn’t going anywhere but could easily go higher.
1. If you are a short-term trader, collect daily data on your trading. That’s the best way to really, truly understand variance. But this table might help a tiny bit. If you have a 50% daily win rate and trade 252 days/year, there is a 99% chance you will have a 5-day losing streak in a given year. There is a 63% chance you will have a 7-day losing streak. One in ten years, you will have a 10-day losing streak.
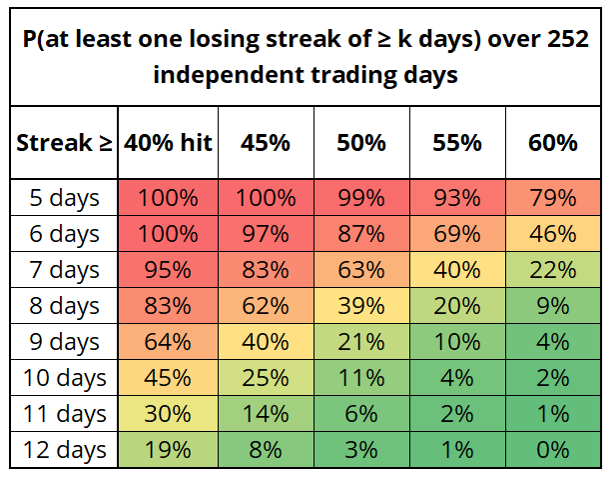
Two things. First, a 5-day drawdown is essentially guaranteed at any hit rate below 60%. It carries zero information about whether your edge is broken. It’s guaranteed variance. Second, the curve is brutally sensitive: dropping from a 60% win rate to 40% doubles the expected worst streak, but the tail moves much more. A 12-day skid is a 1-in-400 event at 60% and a 1-in-5 event at 40%.
Caveat on the independence assumption: P&L streaks can cluster if your trading is regime-dependent. Empirical streaks can run longer than this table implies in that case. Treat these as a floor on what to expect. If you have enough data, you can eventually figure out if your trading has serial correlation or if each day is truly independent. Some people even have negative serial correlation because they trade better when they are in drawdown.
That is the case for me. I trade better when in drawdown because I stick to my process and I am more selective. When I am overearning, or at high water, I sometimes take negative EV risks for fun, or oversize due to having cartoon dollar sign eyeballs. So, my losing streaks are shorter than math would suggest, but my winning streaks often end with a bang.
2. If you have been following the VCX law of one price violation story… The lockup on that stock expires August 13. Unlike SPCX, there is no reason for VCX to bounce once the lockup expires—it should simply compress right towards NAV and stay there. NAV is around $18/$20. Wild ride for that thing as it peaked once above $500, once above $300 and now trades at $32. Daft.
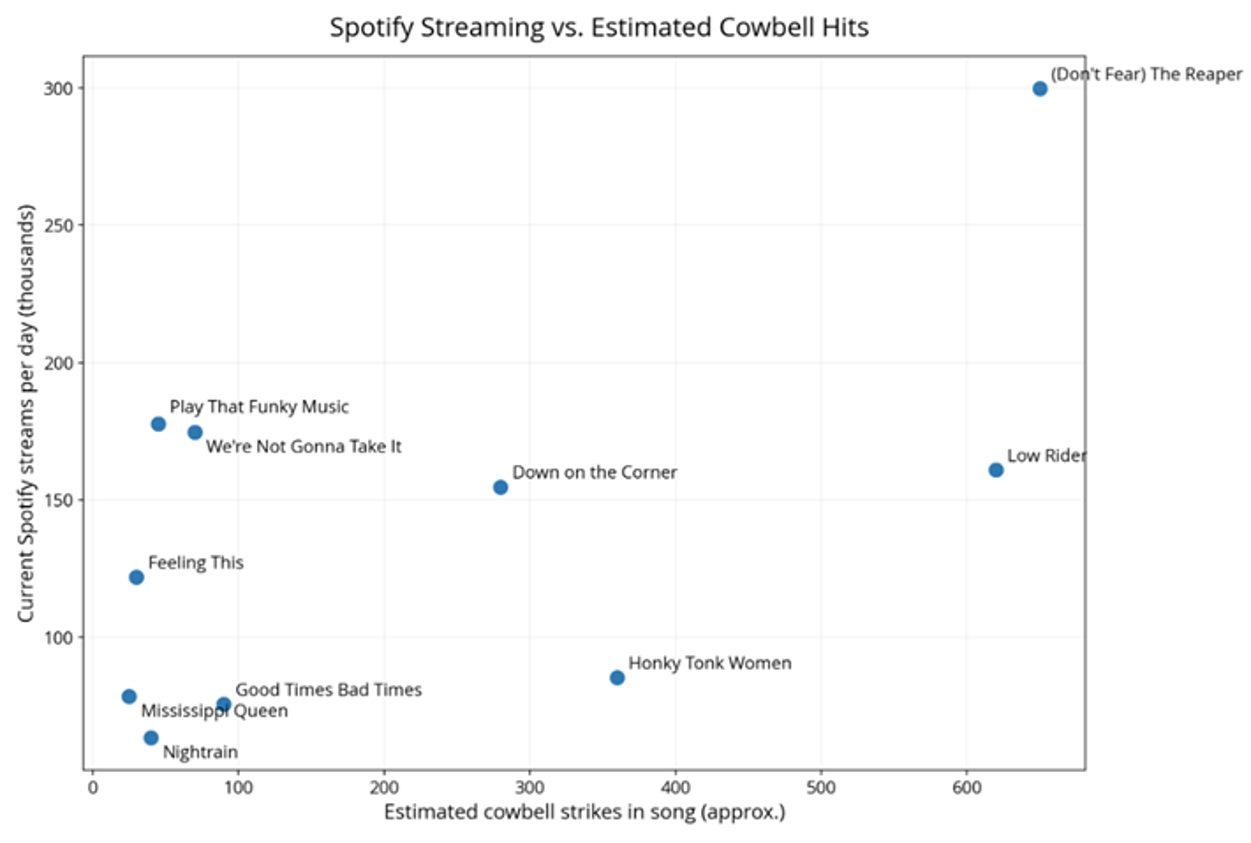
I was listening to Nighttrain by Guns n’ Roses yesterday, and it got me wondering about the relationship between number of cowbell strikes and number of Spotify streams. The scatter above shows it.
61% is the r-squared. Once again proving a point made many times in am/FX. R-squared in isolation is one of the stupidest measures in statistics. :]
Congratulations to Wild Cherry and Twisted Sister for maximizing their streams/cowbell ratio with “Play That Funky Music” and “We’re Not Gonna Take It” respectively.