Low vol meltup doesn’t mean much. USD wobbling on the edge. CAD cooked.

Wut?

Low vol meltup doesn’t mean much. USD wobbling on the edge. CAD cooked.

Wut?
Flat
The NASDAQ is up 10 days in a row and it’s up 25% in the past six months. One would think that would be a backtest that would show up over and over in the dotcom bubble, but one would be wrong! Here are the other times this has happened:

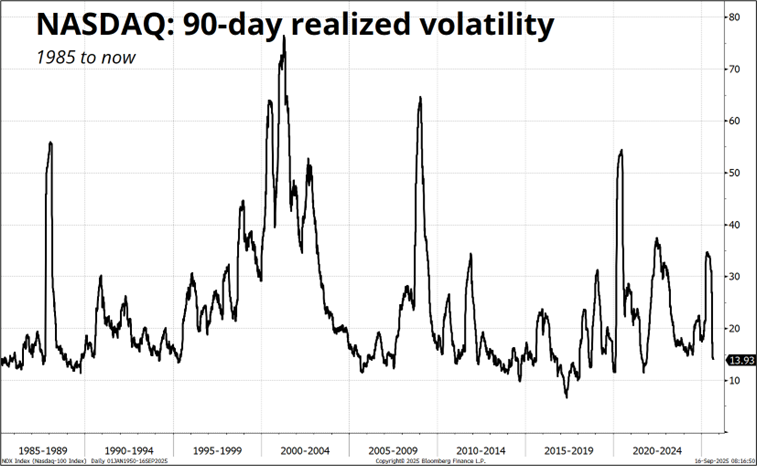
Surprisingly, the longest NASDAQ win streak 1998-2000 was 8 days in a row. It was much more volatile then vs. now. I wonder if gradually descending peaks in volatility (see next chart) are attributable to the knowledge that the government will intervene when things get spicy and so the panics are successively less panicky. The Pavlovian buy the dip response to equity selloffs is part of the generational DNA now as natural selection has killed off all the Panicans.
That dotcom bull market was super volatile, wild, and crazy. This one is a grinding, low-vol affair. The forward performance after this condition of: (10-day win streak + >25% 6-month return) is negative on day 11 and day 12, but mostly positive on any other forward time horizon. There is no real signal here.
While some parts of the current environment rhyme somewhat with the 2021 peak (particularly the frenzy to offload SPAC and other poopco equity)… There is nothing in this data to suggest anything nefarious is on the immediate horizon. I guess you could argue that we are in the scary seasonal period now, but seasonals have been atrocious in 2025 after putting up great numbers in 2023 and 2024. So if there is autocorrelation in seasonal security performance, I suppose we can ignore the very bad performance of stocks in week 39 of the year?
For your info, the next table shows the performance of the Spectra Trader Handbook seasonality signals for the last three years. 2025 has not been good for the seasonality believers. My view is that seasonality functions mostly because of asymmetry of flows and human behavior around specific times of the year and political and macro shocks are bigger than those flows. So if you have a series of randomly-timed policy shocks month after month, that will blow the flows and the behavioral seasonality out of the water. That’s my explanation for why seasonality has not worked this year. But I could be wrong.
Performance of Trader Handbook Seasonality Trades, 2023 to now

We have a Fed and a Bank of Canada meeting on deck here and while the Fed meeting is super interesting from a financial history point of view, I am not sure how actionable the outcome will be. Miran will vote for 50, and maybe Waller will jump on board too as a catchup trade for the missed cut he wanted in July. 95 out of 97 economists are calling for 25bps while Steve Englander, bless his huge Canadian heart, stands out as the only major strategist or economist that I know of with the chutzpah to call for 50bps.
His view, which makes sense to me, is that they go 50bps as a catchup, but then sound hawkish going forward. More of a one-time reset than some sort of new and aggressive rate cut cycle. While I don’t think they will get enough votes for 50bps, the logic isn’t crazy. If you’re a bit behind the curve and you’re worried about the jobs market, just get close to neutral by cutting 50bps and then see what happens.
When I think about who might vote for 50bps, it’s hard to get beyond Miran, Waller, and Bowman. Maybe Cook? That would be ironic, don’t you think? Goolsbee? Jefferson?
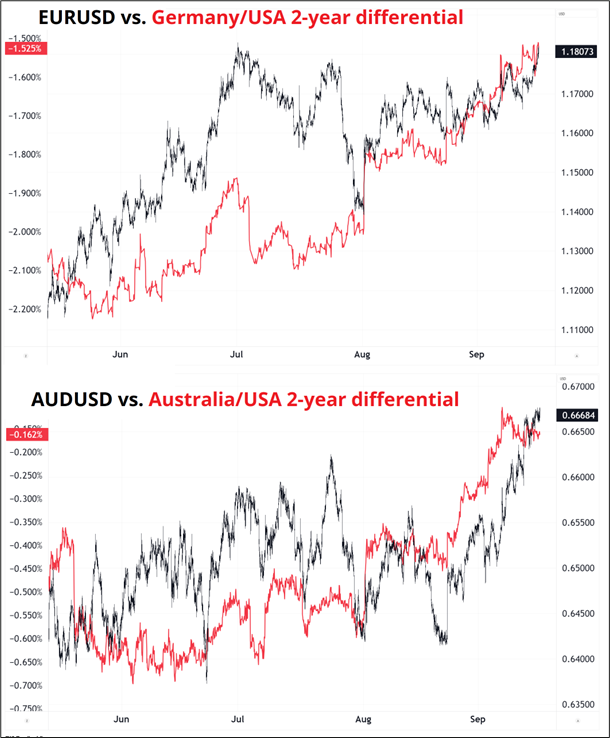
As we wait for the FOMC, the USD is soft. Interest rate differentials are drifting back out as the ECB and other central banks are less likely to cut while the Fed flirts with a third mandate of capping medium-term yields by White House fiat. While the relationship is nowhere near tick-for-tick these days, the broader direction of rate diffs vs. USD does seem to hold[1].
Some of the daily and weekly charts are getting interesting, particularly EURUSD and USDBRL.
First, let’s look at the EURUSD chart going back to late 2020 (below). You can see a few things in there. First, we are close to testing the 3-year high as the last time we traded above 1.1827 was September 2021. We traded 1.1827 on July 1 of this year and that is the current cycle high.
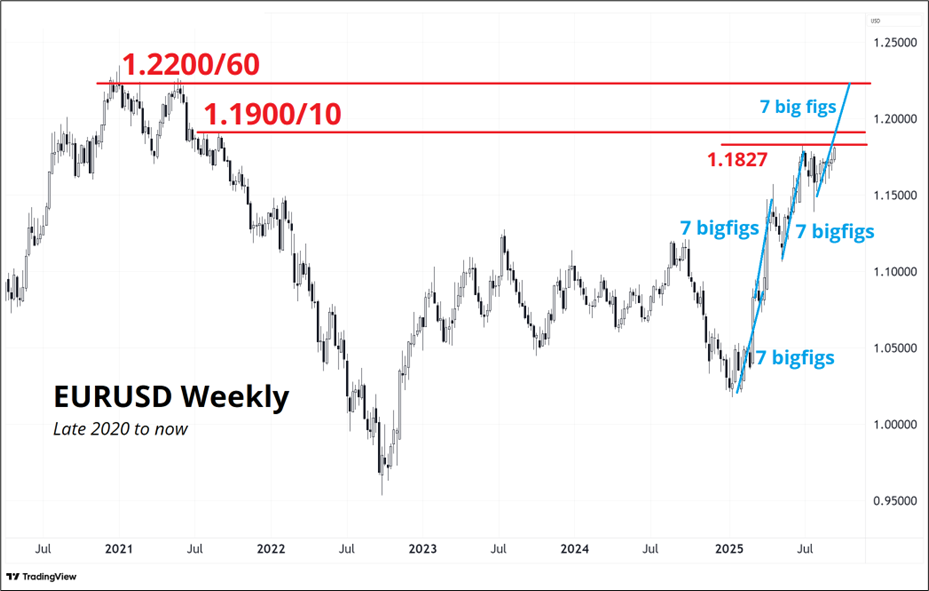
Second, you can see that 1.1900/10 was the last series of tops before the collapse due to the energy crisis and Russian invasion of Ukraine. Third, note the major tops at 1.2200/60 and the spike high of 1.2350 in early 2021. Finally, see how each leg of the current rally has been close to 7 big figures. If we project 7 bigfigs from the 1.14/1.15 bottom in late July, we get a target of 1.21 or 1.22. So, if I was doing year end bullish EURUSD trades, I would buy 1.20 and sell 1.23 strikes.
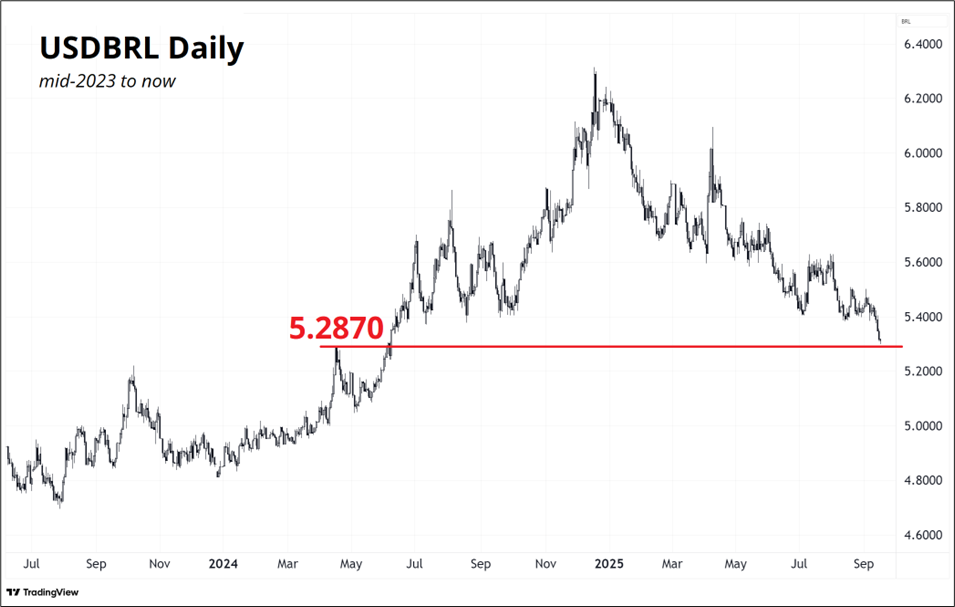
The USDBRL chart is also approaching a key zone. 5.2870 was the spike high in April 2024 and once we smashed through it on June 7, we never looked back. Patient lovers of carry have found BRL to be the gift that keeps on giving. It will be interesting to see whether we crack that level easily or end up bouncing off it a few times. My guess is that we bounce and if you reduce near 5.29 you will get a chance to add back at 5.39.
I am supposed to have a strong USD view all the time, but I have to say that with so much priced into the Fed now, I’m finding it hard to get excited about short USD, especially with EURUSD, USDBRL and USDJPY all on key USD supports. My only strong view is that the Canadian economy is finally in trouble (housing starts abysmal today, adding to the steady run of bad data) and CAD will weaken against the crosses into year end. Long EURCAD and long AUDCAD into year-end will end up as great trades, I think, but three months is beyond my trading time horizon so I only mention this if you are the type of macro person that trades 2-month or 3-month ideas.
The entry point in EURCAD requires courage, but we could go another 10 figs between now and December as rising unemployment and falling house prices undo an economy heavily-geared to real estate that has been building up leverage for 20 years.
A 3-month 1.68 EURCAD digital costs less than 15%.
Have a beautifully-designed day.
—
[1] Don’t tell the USDJPY shorts I said that.
Wut?
Unpleasant graphic designs.