50bps is now very likely to be the size of the first cut, which will be delivered at the September FOMC meeting.
Hello. It’s Friday. Thanks for signing up. I’m Brent Donnelly.
50bps is now very likely to be the size of the first cut, which will be delivered at the September FOMC meeting.
Hello. It’s Friday. Thanks for signing up. I’m Brent Donnelly.
Here’s what you need to know about markets and macro this week

Before we get started, check out the video about Spectra School right here. It describes our flagship course…
This self-paced course will equip you with a set of robust and practical frameworks that combine logic, stories, data and more to help you see markets more clearly, make better forecasts, and make more money.
The course includes:
What you’ll learn about:
Course fee: $1,200.
Let’s go!
As telegraphed by ISM Employment, ADP, and Claims… NFP delivers today with near-recessionary data. 50bps is now very likely to be the size of the first cut, which will be delivered at the September FOMC meeting (or earlier? kekeke).
Meanwhile, stock investors run to the hills as the Harris Correction continues in stocks. The probability of another MMT-style fiscal bonanza in 2025 and 2026 is dropping along with Trump’s odds of victory. DJT odds on PredictIt are now below 50% (currently 49%) for the first time since May 13. There is some question about whether PredictIt is the best measure of Trump odds because liquidity there is poor. Most think Polymarket odds are more indicative, but it’s the direction of travel that matters, not the exact level. I am using PredictIt because the data is easily harvested from Bloomberg into Excel, but I acknowledge that the raw levels of PredictIt might understate Trump’s odds. You cannot simply arb PredictIt vs. Polymarket because of fees and friction.
The basis between the two has been constant at around 4% and therefore they are both sending the same message: The election was 72% or 68% in favor of Trump at the peak (Polymarket vs. PredictIt) and now it’s either 53% or 49%. In other words, the chart is going to look exactly the same, whichever odds you use. If you want Polymarket odds, just shift the Trump odds y-axis up by 4%.
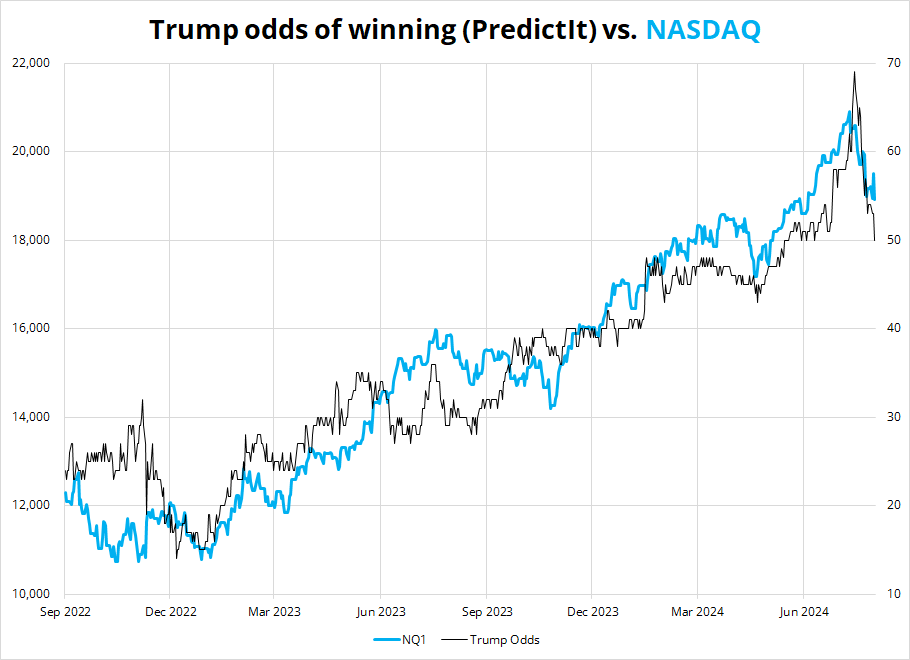
Like the NASDAQ, USDCNH and crypto are also suffering under the rising odds of a coin toss election following the blowoff mid-July top in Trump’s fortunes. GenZ are unironically sharing Kamala TikToks and Trump has failed to find an 8th grade level insult that perfectly fits Harris so far. Momentum comes and goes, though. Mr. Trump continues to test out various barbs and something will probably stick at some point and knock Harris off stride. For now, he is on the back foot and dodging debate questions. Note that USDCNH was already destroyed before payrolls.
Obviously, there is a lot more going on than just politics, as the AI narrative peaked in late June, the economic data in the US is curdling, and Mr. Market has morphed into a rabid dog, tearing up every popular position and carry trade. It’s a bit of a perfect storm made worse by max equity long positioning in late June, poor seasonals that started in mid-July, the AI momo trade, and a cloudier economic reality. Note that stocks can choose to go up or down on bad data and they are choosing to go down.
The stock market has been bludgeoned by these myriad factors hitting at once. The target for this move in the NASDAQ is the 200-day moving averages at 17770 and 17932.
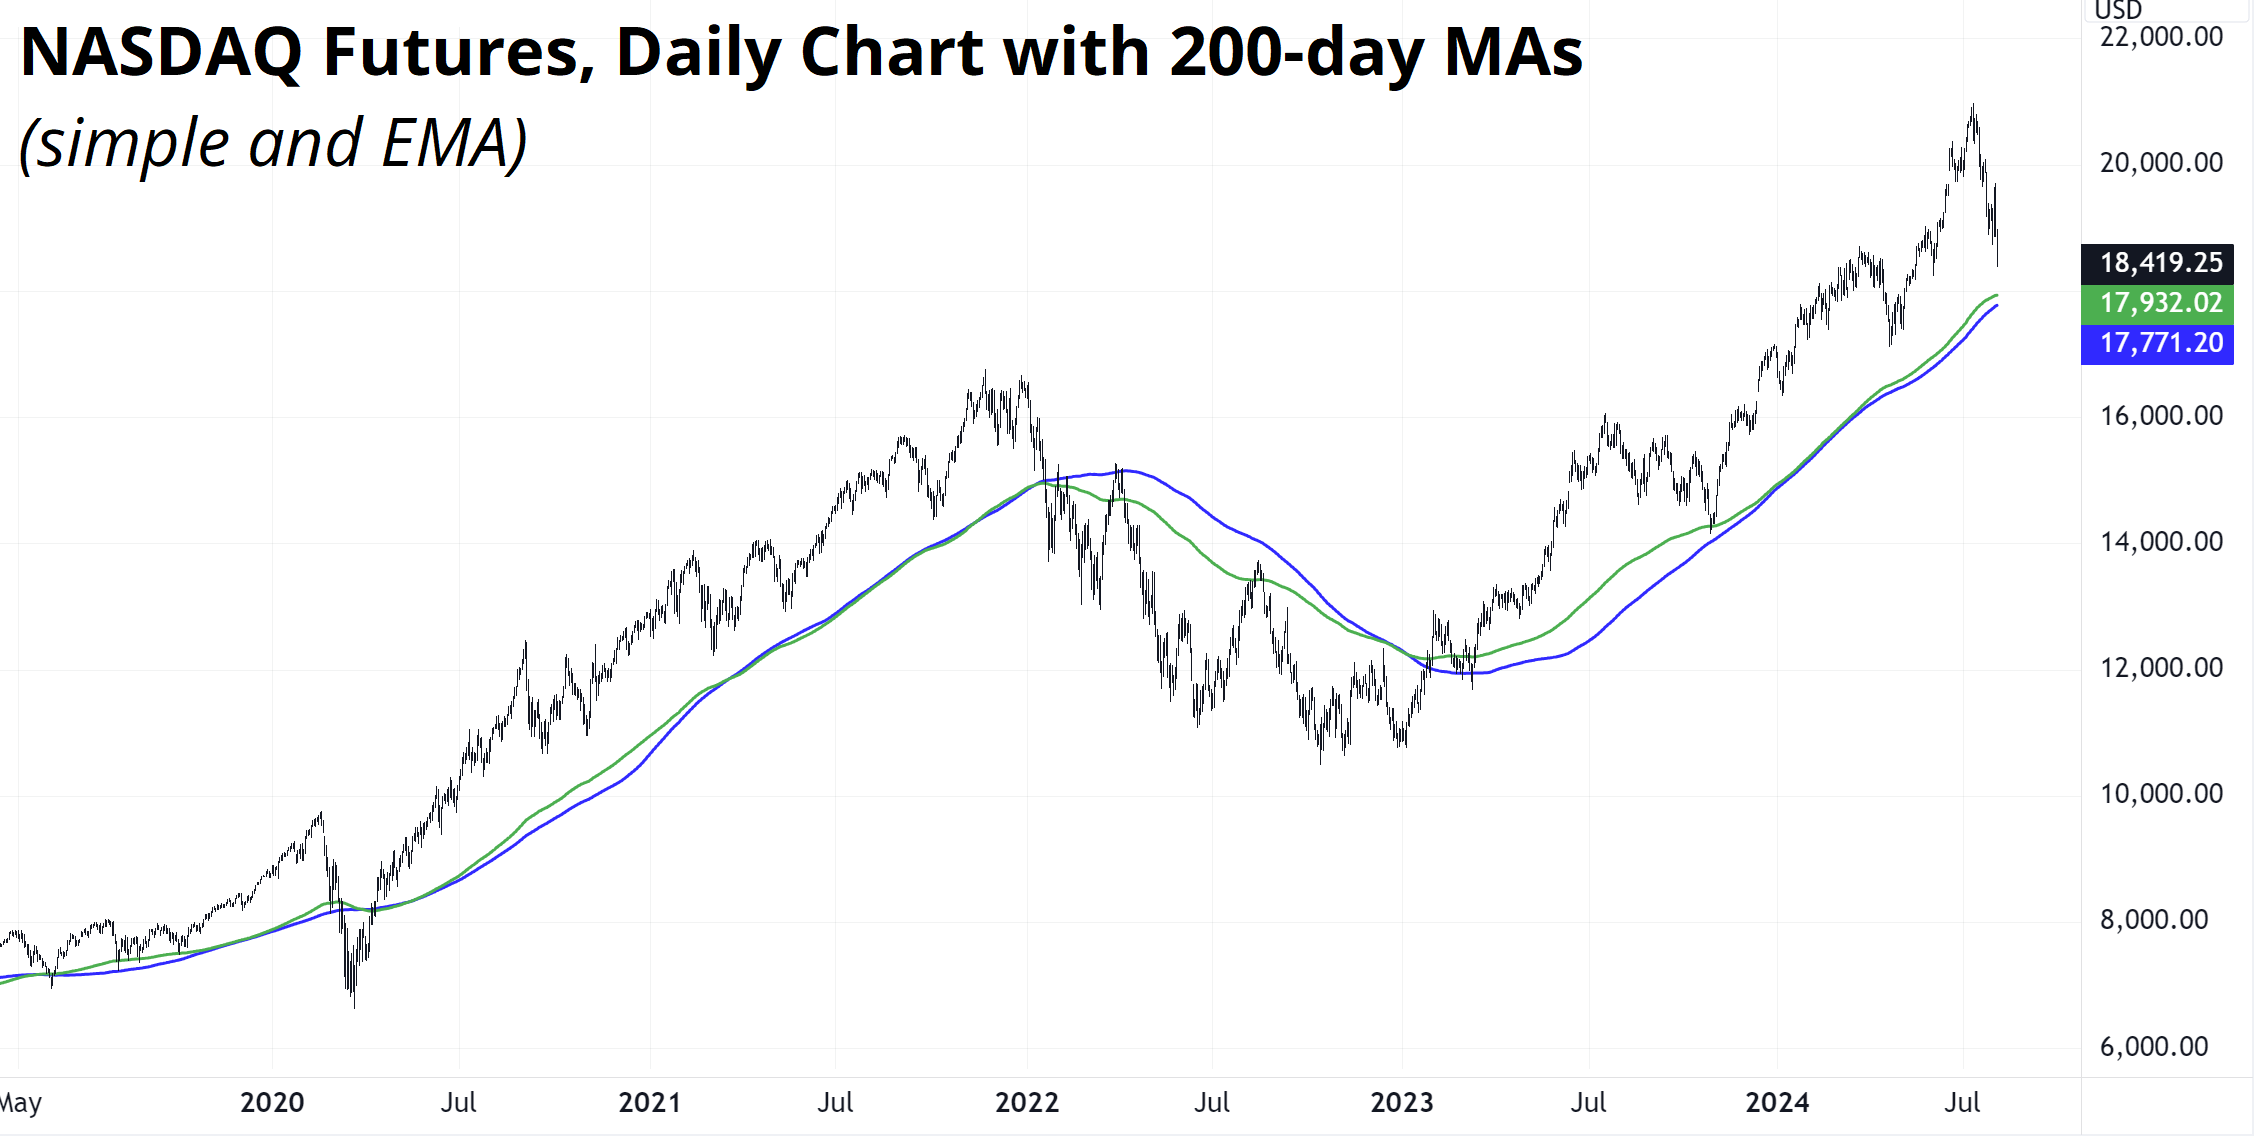
The Fed cutting in clips of 50 basis points will provide a floor for stocks and probably means that buying near the 200-day zone there (17800/17900) should work for a tactical bounce trade.
Nothing in here is investment advice. Trade your own view.
It’s not often you see Amazon down 10% or more one day, but you’re seeing that today. While this was a common occurrence during the dotcom bubble, when Amazon was a tiny company relative to now, it’s not common anymore.

Given Amazon has been in a raging up trend since the 2001 low, you would expect that price action after all these big drops must have been bullish. That’s generally how it works if you study anything that has trended massively upwards. The vast majority of backtests will show positive returns. Because math.
Here are the charts of what Amazon did in the 60 days after the four most recent 10% one-day drops. It went down more, then sideways. This result is extremely bearish in the context of a stock that went from $2.50 split-adjusted in 2008 to $161 today.

If you are a professional investor, this is the kind of setup where you might consider selling call spreads, especially if you’re long. Base case using this admittedly small sample size is that Amazon makes a significantly lower low from here and then flatlines for a few months.
High-vol markets like this are the best time to trade. Good trading takes courage. Here’s a 1200-word excerpt from my book Alpha Trader that applies right now.
Excerpt begins here
Trading fast markets
In World War 1, there was a famous quote:
“Modern warfare is months of boredom punctuated by moments of extreme terror”.
I would paraphrase here and say modern trading is hours of boredom punctuated by minutes of extreme terror. Things are quiet most of the time but what matters is how you act and react when the guano hits the rotating blades.
Crisis markets can provide the best opportunities for profit and the greatest chance of ruin. Markets can lay dormant for months, then go completely insane. A whole day can go by without excitement, then a headline hits at 4:00PM and everything boots off.
In this section, I discuss fast markets and, more specifically, trading during a crisis or extreme high volatility event. Trading crisis markets and trading idiosyncratic bursts of extreme high volatility involve most of the same skills and concepts.
It is usually easy to identify when a crisis is happening but for simplicity, I would say any time the VIX is above 40, that’s a crisis market. Looking at all days since 1990, the VIX closed above 40 just 2.2% of the time. Here is a chart:
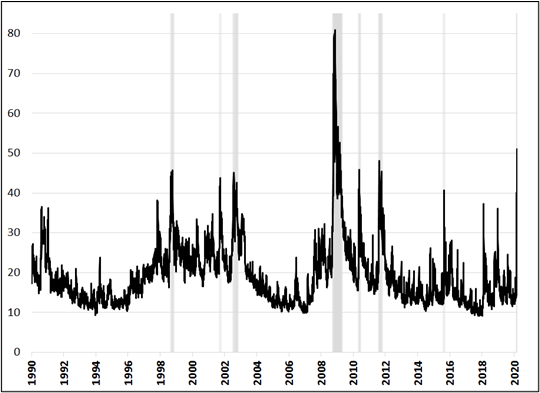
The vertical bars are all famous events in financial market history:
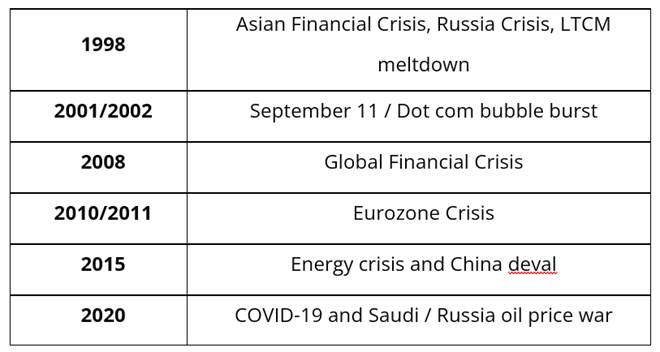
There is nothing special about the number 40, it’s just a level we rarely see in the VIX.
When markets are in crisis, you need to trade differently. You need to be faster and smarter. The challenge is to be both more careful and more courageous at the same time. That is hard to balance! Fast markets are scary, but they are the best times to make money, and to truly excel at trading you need to crush fast markets.
Here are some tips to help you trade fast markets:
1. Correct position size is the difference between winning and losing in a crisis. Too big is not OK; you might blow up or get fired. Too small is not OK either; you need to seize the moment. Trading in fast markets is when the most money gets made and the alpha traders emerge.
I remember as volatility went to the moon in 2008, I changed my normal trade size in USDMXN from 20 million to 3 million and I was still amazed (scared) by the volatility of my P&L. If you can size dynamically using forward-looking estimates of volatility, that is ideal. Look at what options markets are pricing for 1-week volatility. If you can’t do that, look at the average daily range over the past 5, 10 or 20 days.
As a rough logic check: for day traders, your stop loss should rarely or never be closer than within 1/3 of a day’s range. For swing traders, use one full day’s range. In other words, if you are trading Apple common stock and the average daily range over the past 5, 10 and 20 days is $25: day traders’ stops should be $8 or more away from the entry point and swing traders stops should be at least $25 away from entry. This should be a good starting point in most markets.
If you are getting stopped out and chopped up every day, your stops are too tight. A smaller position with a wider stop is necessary in crisis markets but you need to be mindful that you don’t get so small that you are trading meaningless positions that won’t move the needle on your P&L. Yes, a lot of traders get blown up in a crisis, but a lot just hide under the desk and reveal they are fundamentally risk-averse actors who are not really fit to trade moving markets.
Striking the balance between too big and too small is vital in trading and that balance can be the difference between crushing a crisis period or getting crushed by it.
2. Keep an open mind and use your imagination. When COVID-19 hit in 2020, the market took oil from $65 to $50 as concerns about consumer demand knocked a market that was already bulled up on “cheap” energy stocks. Then the OPEC meeting in early March crumbled and crude plummeted from $50 to $27 in a week. The pressure from COVID-19 started the ball rolling then the Saudi pledge to pump like crazy broke the back of the oil market. Anyone watching oil go from $65 to $50 might have thought that was enough of a move. “It’s a big move! I’m going the other way!” Not a good plan. Eventually oil went to MINUS $40. This leads to the next point about crisis markets.
3. In crisis markets, there is no such thing as overbought and oversold. Don’t be the person that fades the whole bear market all the way down. In a crisis, stocks can stay oversold for ages and then get wildly overbought days later. You need to differentiate between run-of-the-mill risk aversion and crisis-level risk aversion.
Most risky asset sell-offs are routine affairs that should be traded using sentiment and overbought and oversold signals. When you see put/call ratios or the Greed & Fear Index or DSI or whatever positioning indicators flashing a reversal signal, it is normally time to pounce. But in a real economic or financial crisis, these signals are useless.
For example, there is a simple metric I use to calculate overbought and oversold which I call The Deviation, as discussed in Chapter 10. It measures the difference between the current price of an asset and the 100-HOUR moving average. As The Deviation gets to prior extremes, it can give a nice mean reversion signal. Here is an example using EURUSD:
September 2019 to January 2020
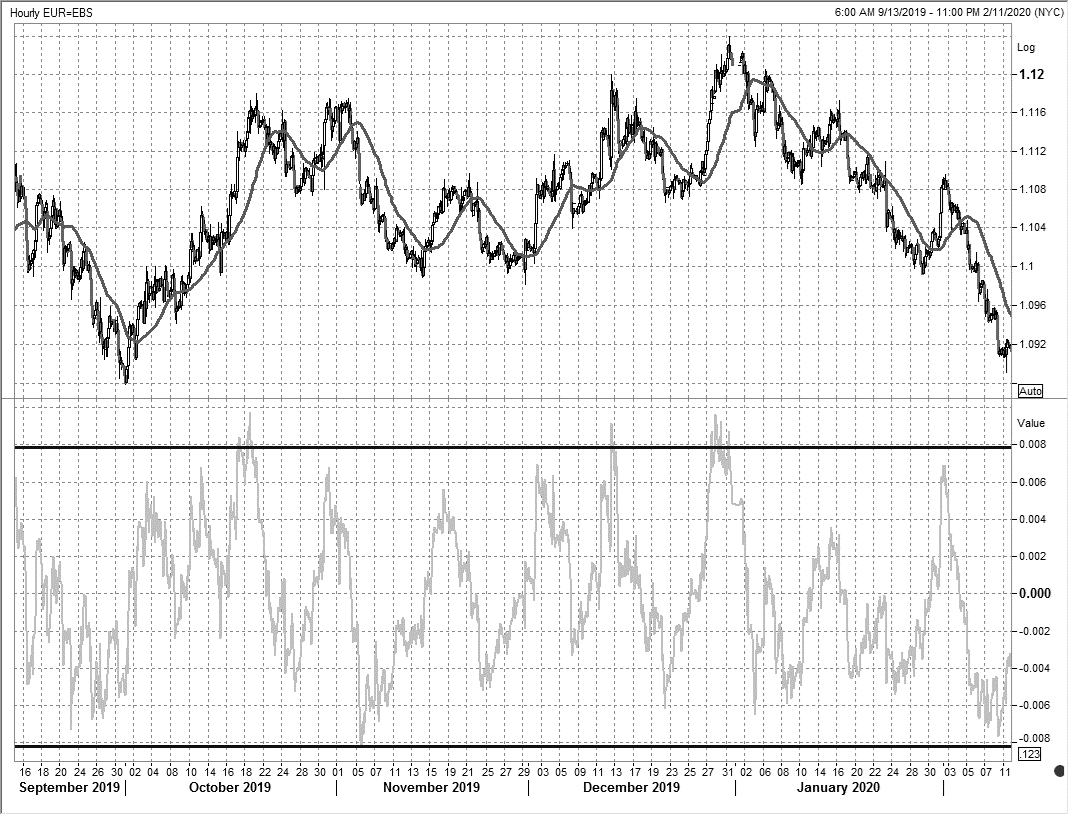
Chart courtesy of Refinitiv
You can see that The Deviation (the gray line in the bottom panel) oscillated consistently between -80 pips and +80 pips[1] over the course of five months and the overbought and oversold readings offered up some decent reversal trades. Then, the COVID-19 crisis hit and all hell broke loose. Now look at the same chart, adding February 2020:
September 2019 to January 2020
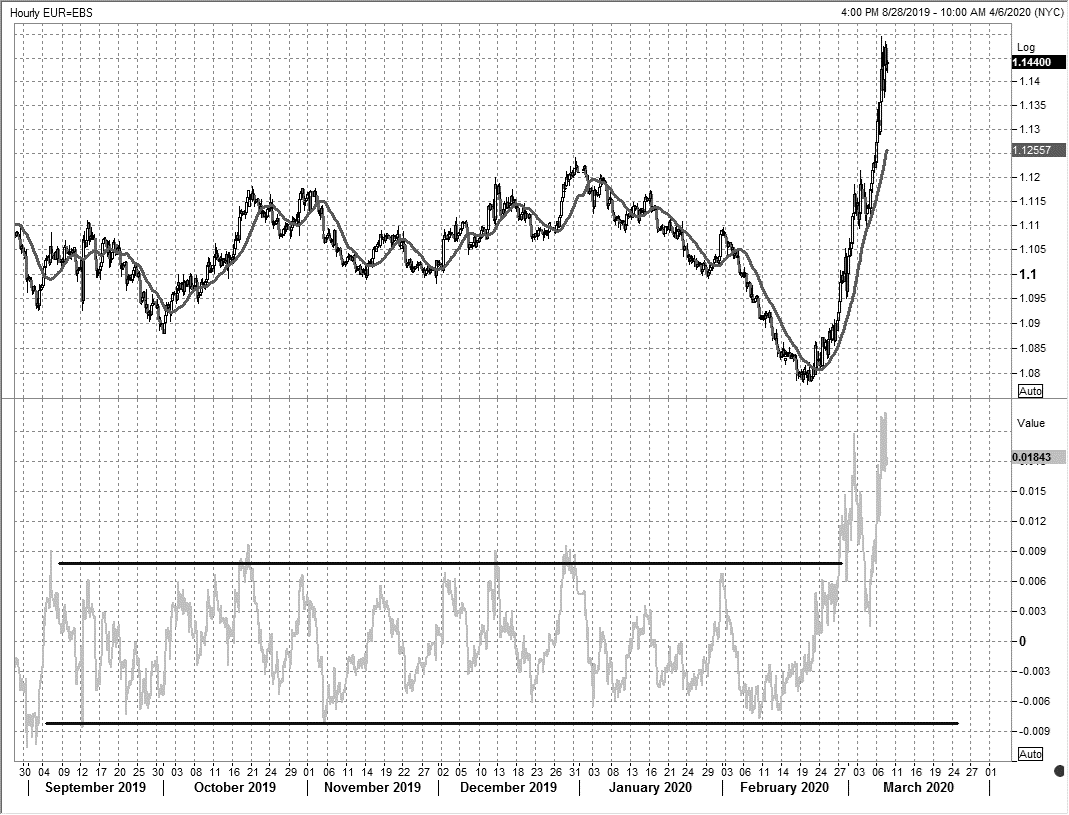
Chart courtesy of Refinitiv
As the crisis hit, the old measures of oversold were blown away as EURUSD ripped higher.
4. Have courage. Insane markets are the reason you got into this business. Don’t hide under your desk and hope for the tornado to pass. Get involved and trade like you know you can. Don’t put yourself in a position where you look back years later with regret. It is better to try and fail than to forever wonder what kind of trader you could have been.
By the time the 2008/2009 Global Financial Crisis was over, careers were made and lost. Some of those lost were not people that blew up but just traders that sat there doing nothing while their peers extracted insane P&L out of thin air. Most of my best trading memories are from crisis periods because these periods deliver fast, volatile, and exciting markets.
Like any high stress profession (pro sports, jet fighter pilot, professional poker…), it all comes down to how you respond in the periods of extreme stress. Don’t be shy, get involved.
Recognize when your product transitions from normal trading to a fast market and adjust your position size and trading strategies accordingly.
End of excerpt
Here is this week’s 14-word stock market summary:
We are now in the seventh inning of a nine-inning correction. Be courageous.
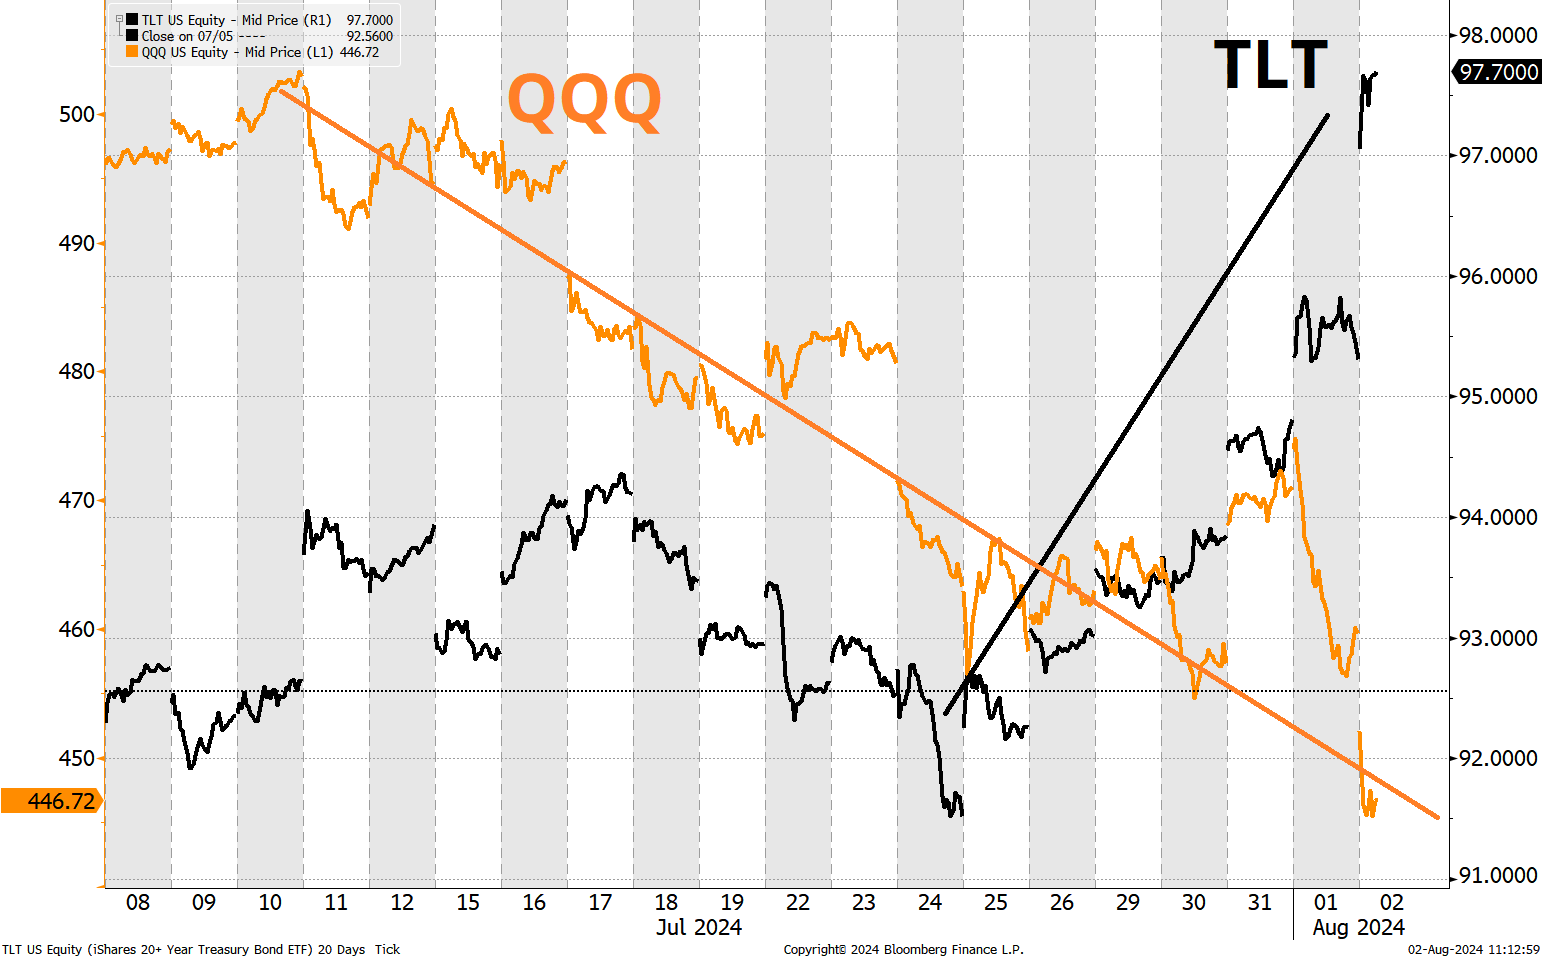
I was moaning about boring interest rate markets over the past few weeks and I was forced to stoop as low as to show some charts of 2s10s. That’s bottom of the barrel desperation for a macro writeup. Now, with the US employment situation suddenly reeking of recession, bonds are back! Outside of temporary supply shocks and highly inflationary periods (which are rare), bonds serve an important function by hedging economic and stock market weakness. The TLT (bond ETF) was a good hedge for QQQ (technology ETF) this week as the economic data puked.
USDJPY won the Olympic high diving gold this week!
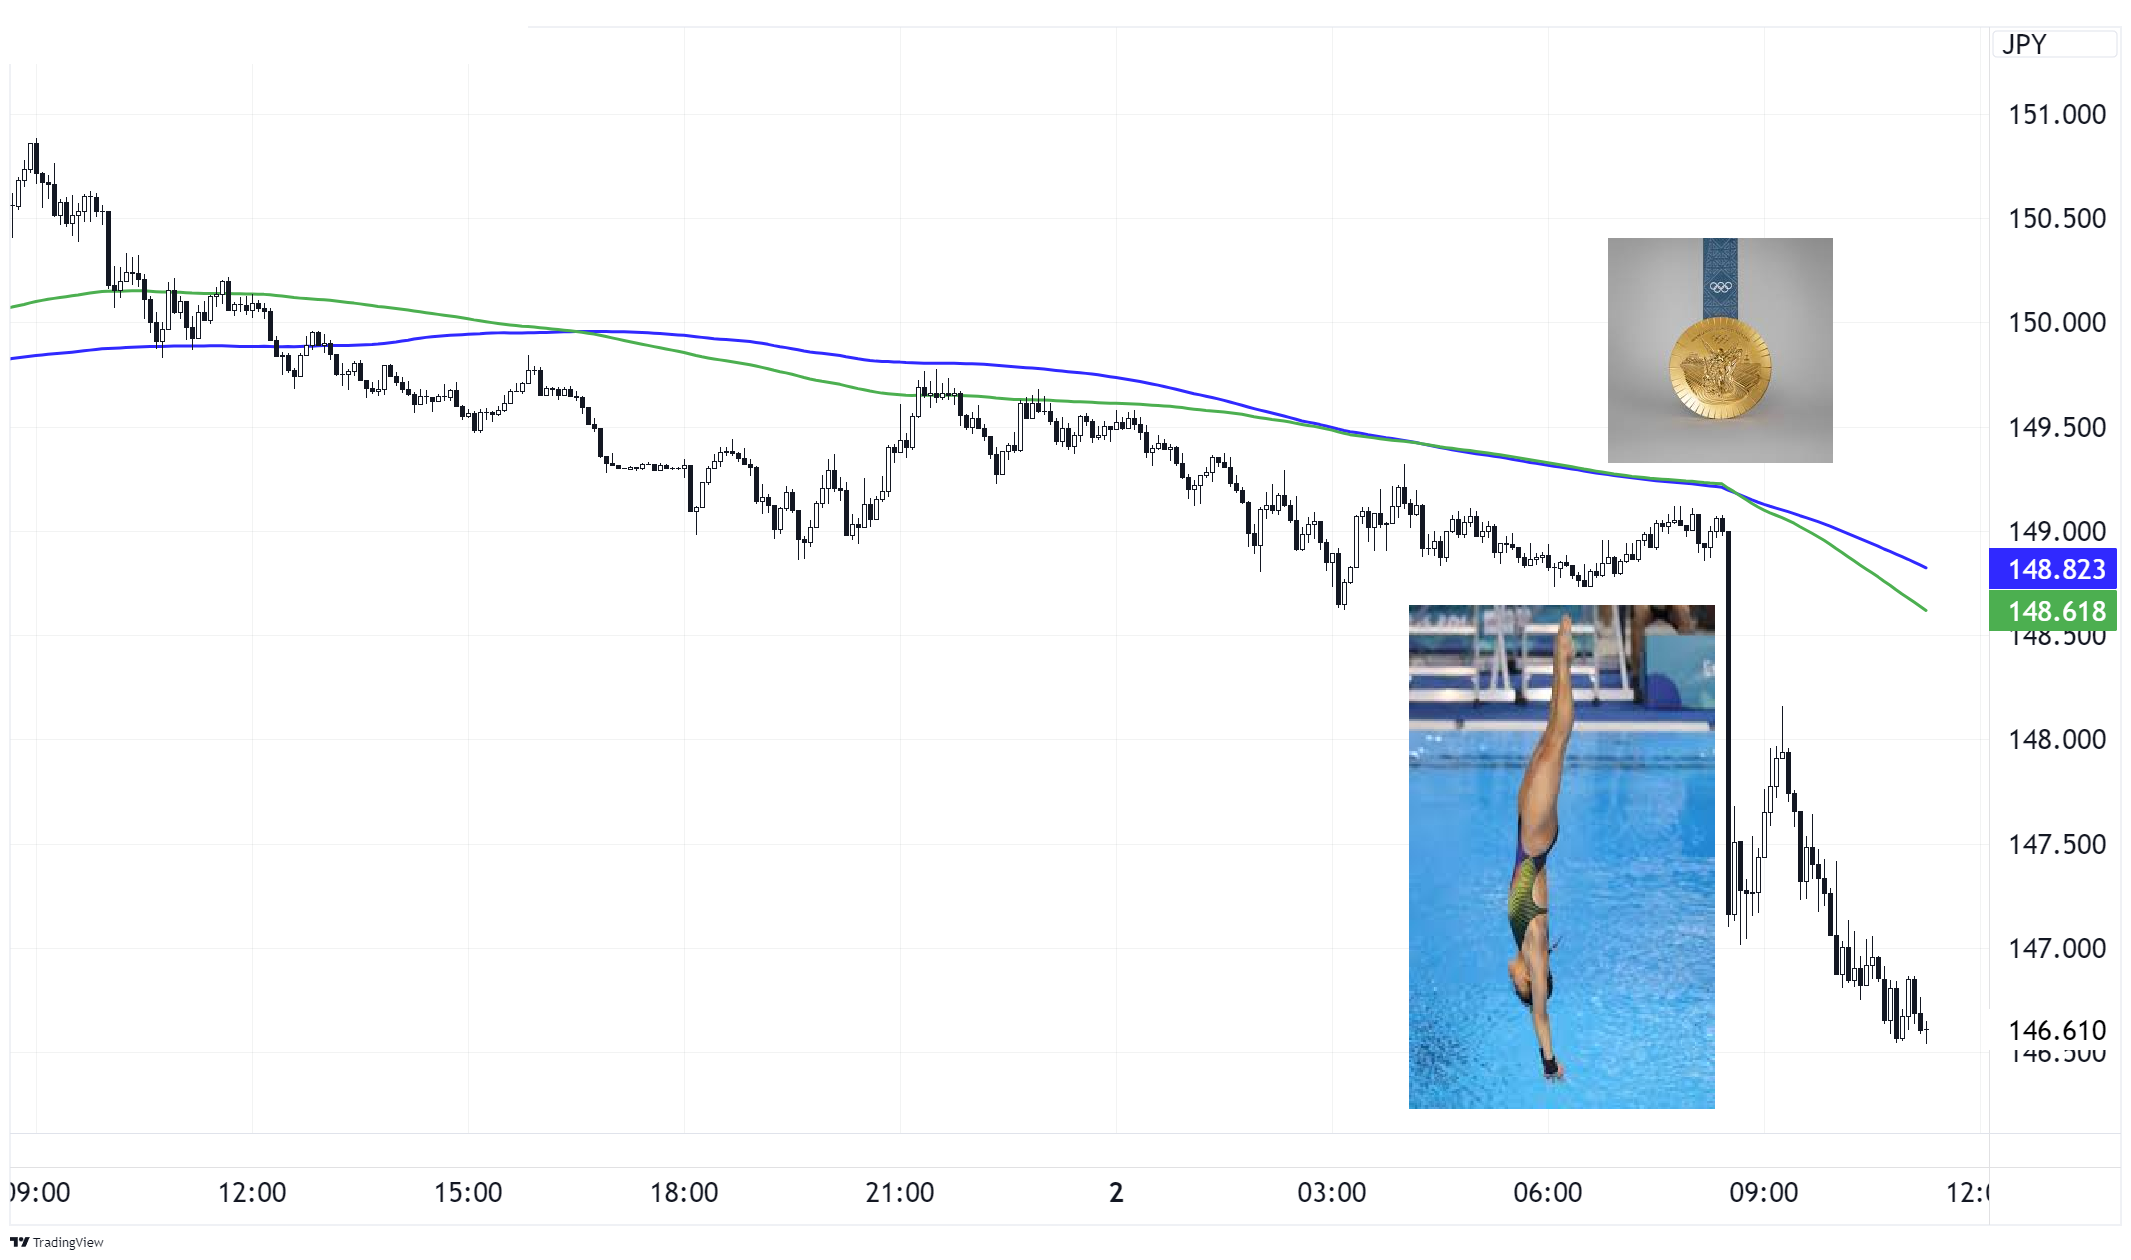
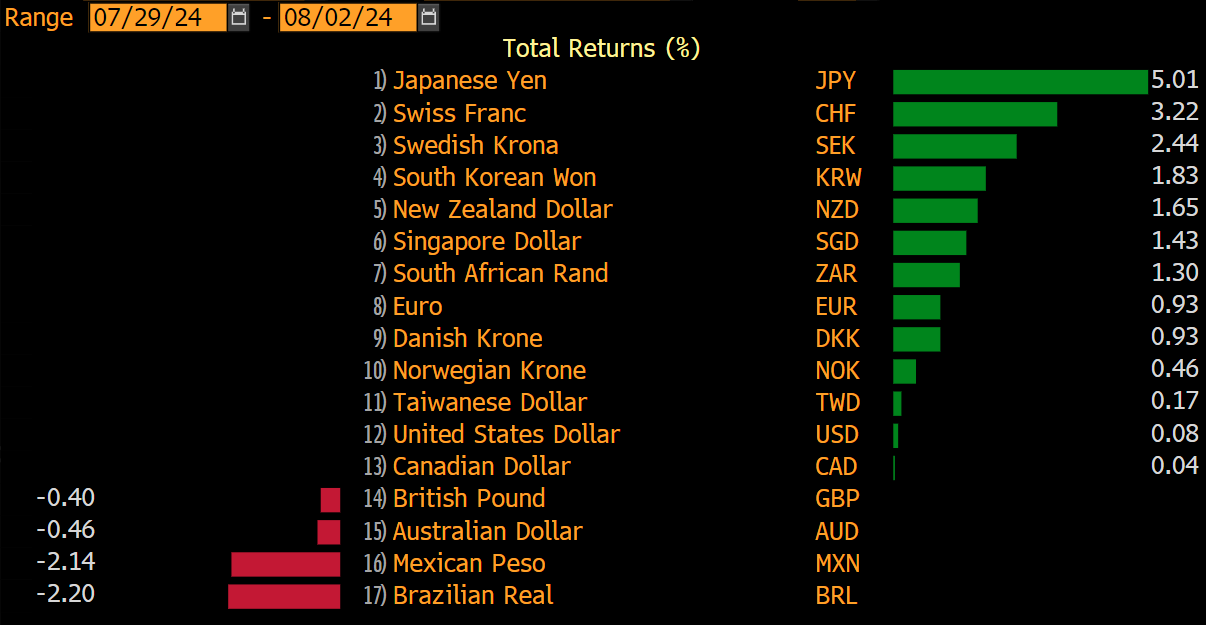
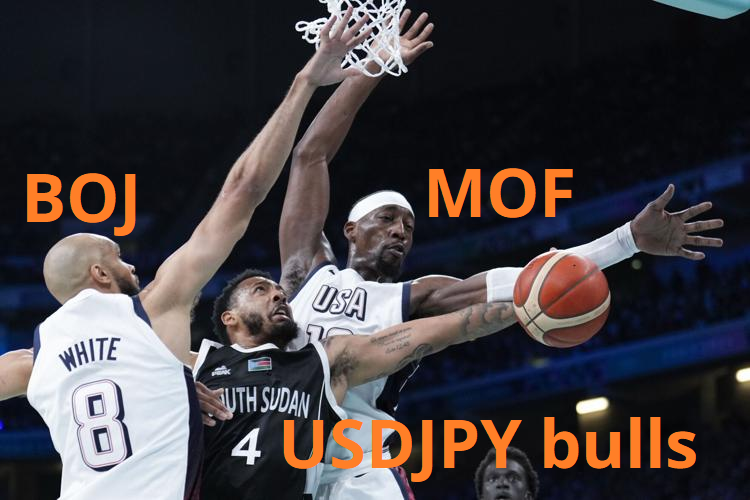
I stole that joke from a Bloomberg chat, but I don’t know who said it. Some USD pairs have been slam-dunked this week as the US data turns, but performance has been radically disparate, depending where you look. Funding currencies are pole vaulting, while cyclical and high-yield currencies are splayed out, face down on the track.
The market has been playing long USDJPY most of 2024 and added despite loud and voluminous USD selling protests from the Japanese Ministry of Finance and the Japanese government. Here is a 1,000 word summary of USDJPY over the past few weeks:
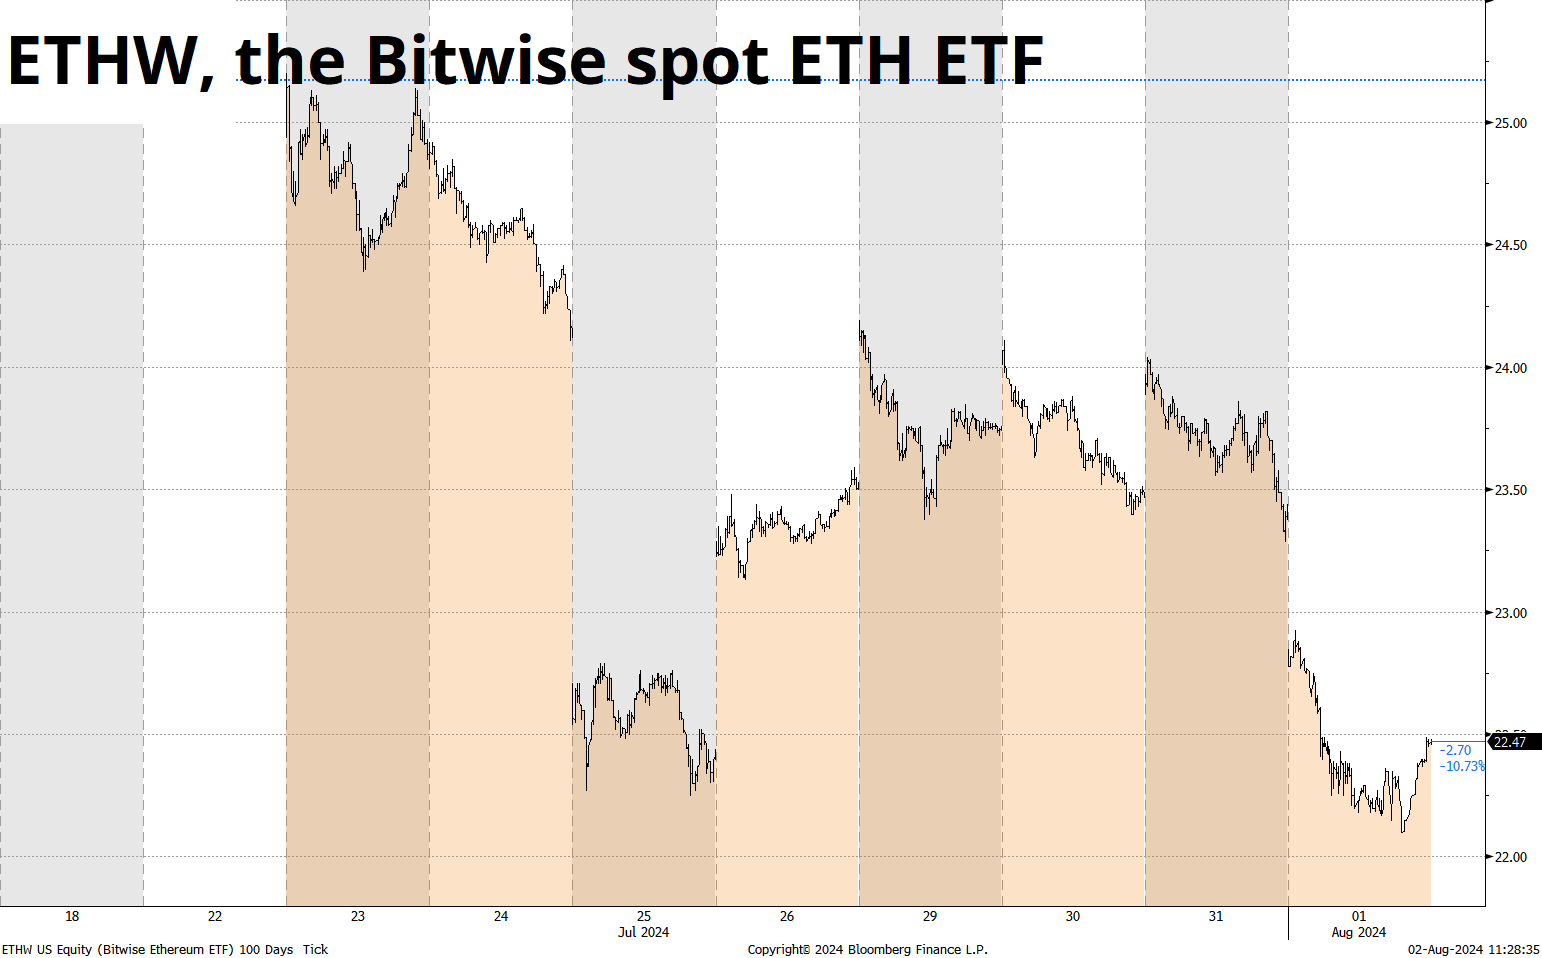
Buy the rumor sell the fact in ETH continues as the ETF launched at 3500 and professional investors are now staring at an impermanent loss of about 15%. Here is the lifetime history of ETHW, the hotly-anticipated ETH ETF that doesn’t pay a yield:
The all-time high in MSTR is still $1999.99. That is so titillating!
I have incredibly high aesthetic, moral, and editorial standards, so I will not post the picture of the Canadian Olympic triathlete vomiting. Instead, this equally grody picture will suffice.
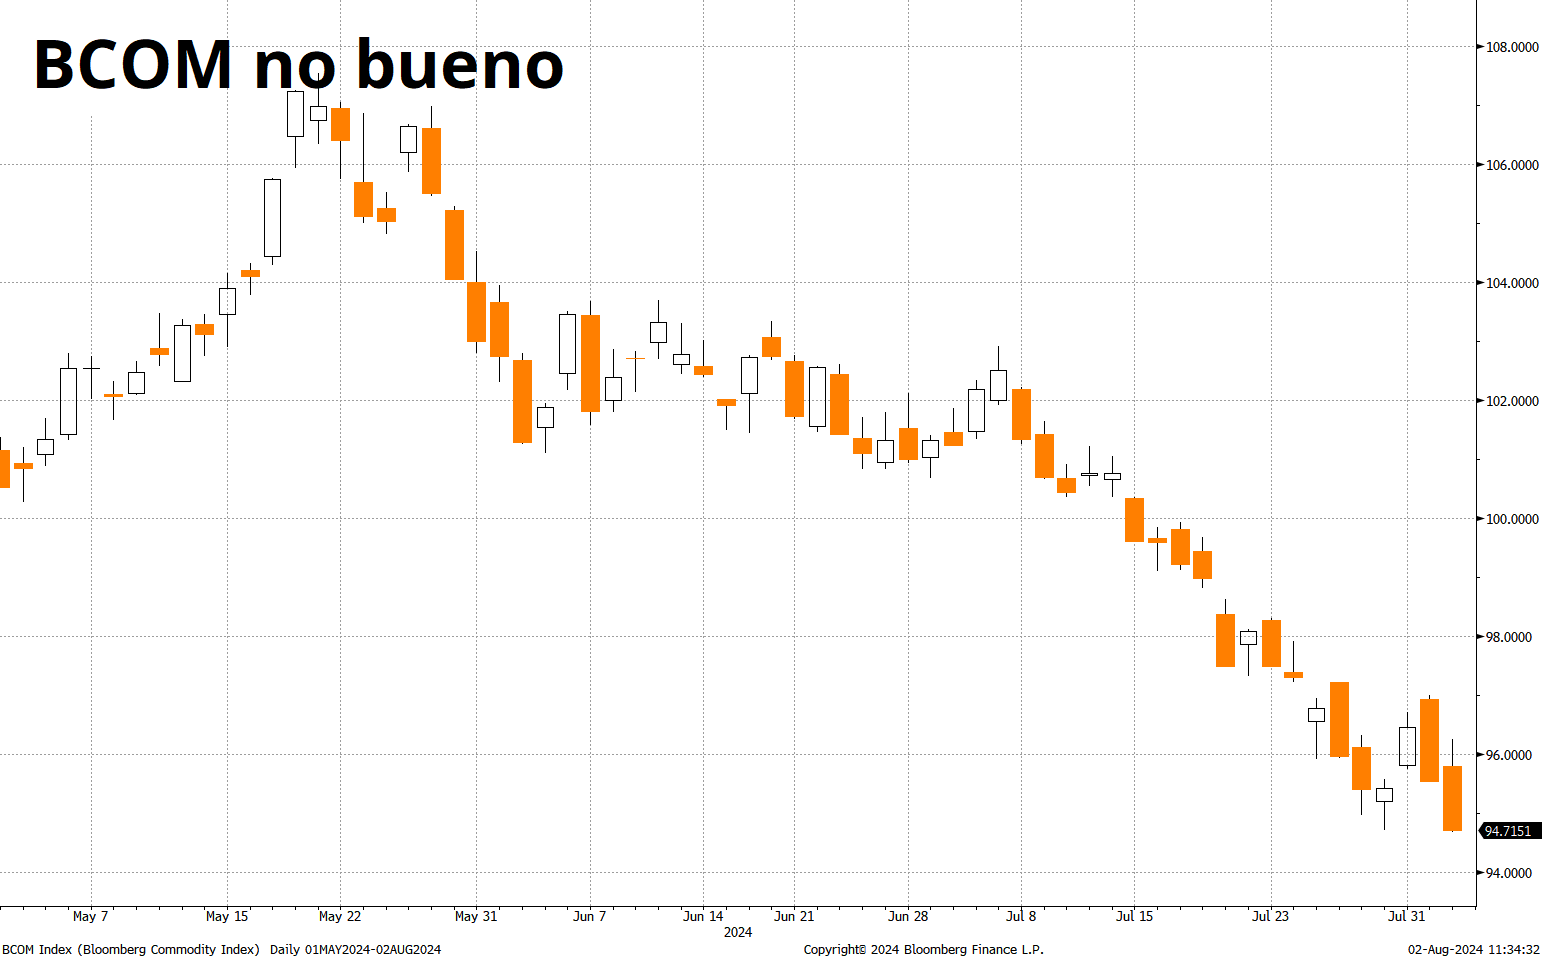
Ags, copper, iron ore, and anything that relies on Chinese growth continue to trade horrendously. It’s a trend. The market got all bulled up commodities after COVID and doubled up on Russia sanctions on the back of some kind of New World Order hypothesis. That thesis has been wildly off the mark. The default condition for commodities over the past 50 years is that they go up on supply shocks, and trend down otherwise. It looks like that has not changed.
Watch for some shocking (low) inflation prints around the world in the next few months. Price cuts are everywhere, and commodities are dead.
And… Finally… This week’s Macro Trading Floor podcast is ready to go.
Whew! OK! That was 9 minutes, plus a book excerpt. Thanks for reading Friday Speedrun.
Get rich or have fun trying.
Smart, interesting, or funny
Verdad has written another interesting piece. This time, they attempt to model similarities between regimes to identify which periods are most similar to today. If you’ve been trading for 20 years or more, you could do this in your head and probably come up with a similar answer… But still, it’s a cool framework!
Verdad: Analogous Market Moments
A meme that I find enjoyable:

Music
One of the best covers ever

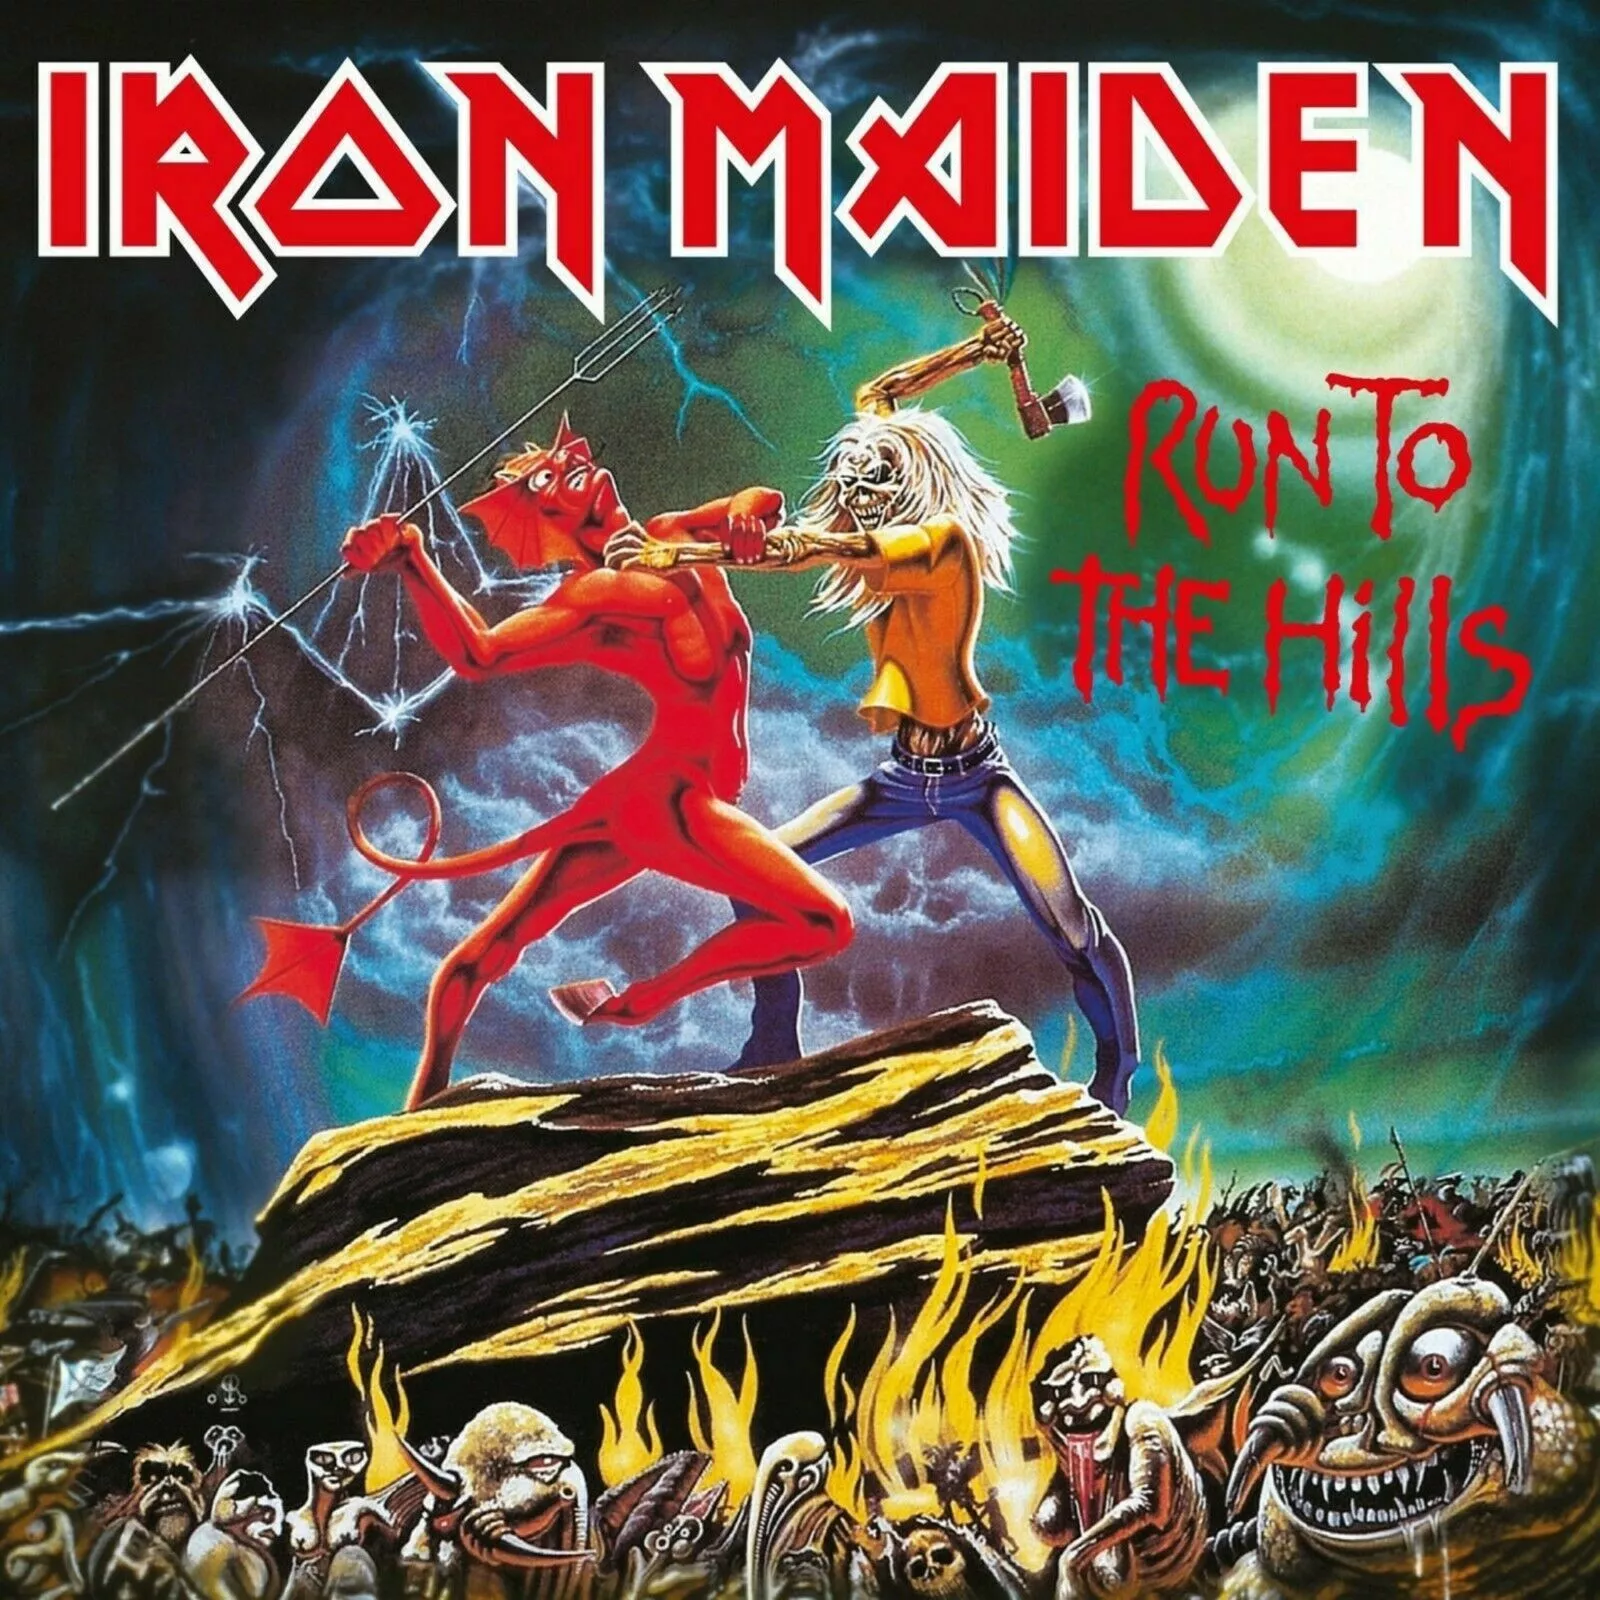
This song will only really hit for you if you know Iron Maiden and the song “Run to the Hills”.
How have I never heard of these guys before? They are so right up my alley. I used to wear Iron Maiden and Quiet Riot three-quarter sleeve concert shirts on the regular back in the Reagan era.
Run to the Hills (Iron Maiden cover) by Hellsongs
If you like that, the cover of “The Trooper” is amazing too.
If you don’t know Iron Maiden, you might know one of these. They are also excellent!
We’re not gonna take it (Twisted Sister cover)
Paranoid (Black Sabbath cover)
And while we’re talking Iron Maiden. How darkly poetic are these lyrics!
You’ll take my life, but I’ll take yours too
You’ll fire your musket, but I’ll run you through
So when you’re waiting for the next attack
You’d better stand, there’s no turning back
The bugle sounds, the charge begins
But on this battlefield, no one wins
The smell of acrid smoke and horses’ breath
As I plunge on into certain death
The horse, he sweats with fear, we break to run
The mighty roar of the Russian guns
And as we race towards the human wall
The screams of pain as my comrades fall
We hurdle bodies that lay on the ground
And the Russians fire another round
We get so near, yet so far away
We won’t live to fight another day
We get so close, near enough to fight
When a Russian gets me in his sights
He pulls the trigger and I feel the blow
A burst of rounds take my horse below
And as I lay there gazing at the sky
My body’s numb and my throat is dry
And as I lay forgotten and alone
Without a tear, I draw my parting groan
—
[1] See dark, horizontal lines. Note: 80 pips = 0.0080
Thanks for reading the Friday Speedrun! Sign up for free to receive our global macro wrap-up every week.
I think soft data is showing the way, but many disagree.
