Shorting tail risk is hard
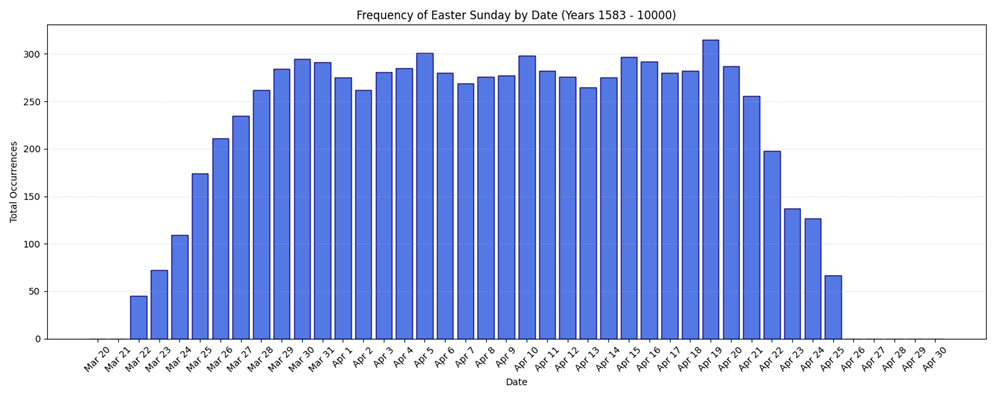
This is the theoretical distribution of dates Easter Sunday will fall on over the course of the next 5,700 years:
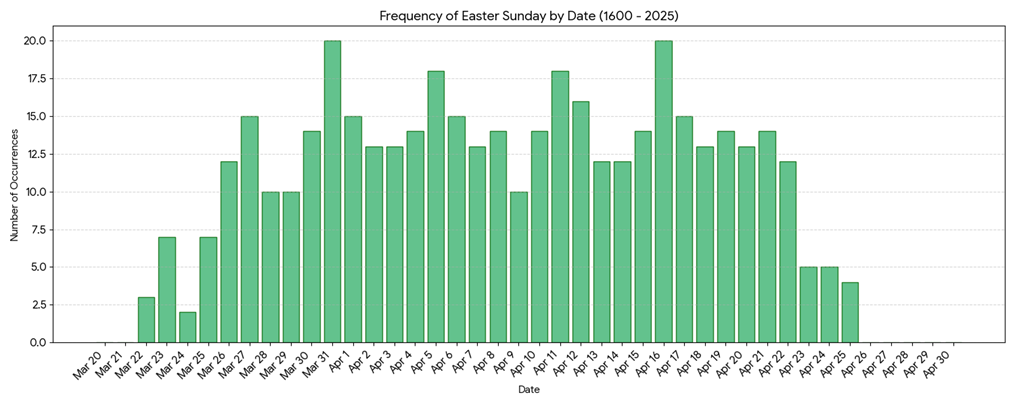
But this is the actual distribution of Easter Sunday dates, 1583 to 2025. (more info at bottom of page)

Shorting tail risk is hard

This is the theoretical distribution of dates Easter Sunday will fall on over the course of the next 5,700 years:
But this is the actual distribution of Easter Sunday dates, 1583 to 2025. (more info at bottom of page)
GETTING FLAT BY NOON
2APR .69/.68 AUD put spread
21.7bps off 0.7025 spot
Short EURUSD 1.1527
Stop 1.1677 Take profit 1.1367
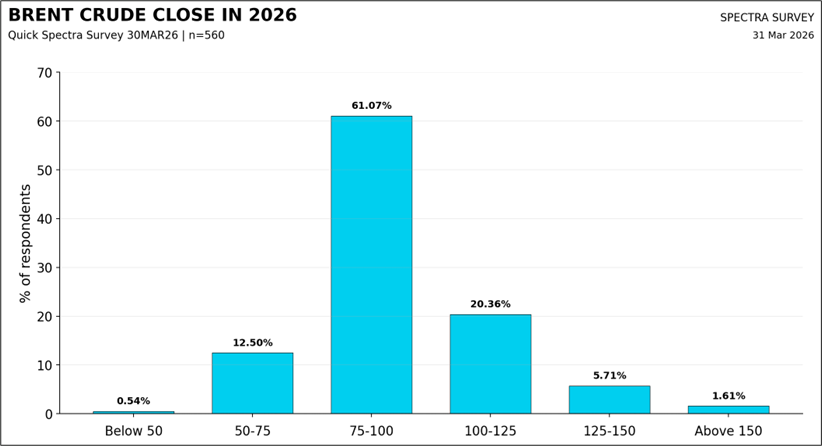
It is normal for everyone to scream “too much is priced in!” when we are in a regime like this, because the odds of the central banks ratifying market pricing are low. In fact, you would be very, very hard pressed to find a single human in the world that thinks that current STIRT pricing is correct. This is reflected in the survey results I have collected over the past 24 hours. The sample size was 560. Thank you to everyone who filled out the survey. First, I asked where people think crude will end up. This is a point estimate, which is kind of not useful given most point estimates for any market will start by assuming we go nowhere. That’s the case here.
Brent Crude was $107.50 when I sent the questionnaire, so you can see that the market is expecting higher for longer but not quite as high as we are now. This makes sense given the permanent damage to oil infrastructure and the uncertainty around the post-war look of the Strait of Hormuz. The Strait was flowing and open to global traffic before the war, but now it’s under the control of a new leader who is even more hardline than his Dad.
Not a good result, so far!
We can fantasize about agreements between Iran and the U.S., but both countries have shown themselves to be bad faith negotiators who are unlikely to stick to any agreement. There is almost no likelihood of a lasting deal.
Here’s a good writeup on the implications of the closure of the SoH from a former Bridgewater lad who always seems to know what he’s talking about. The bit about helium is particularly interesting.
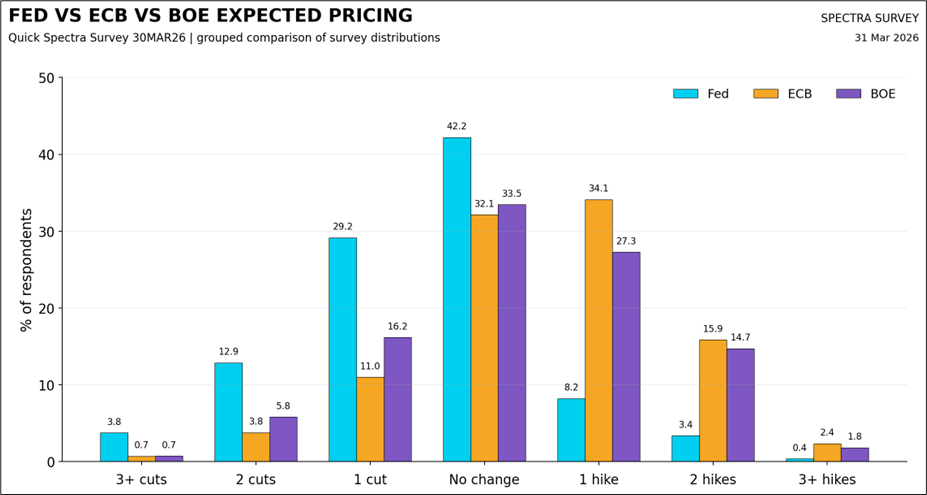
Moving to interest rate pricing. It is common for humans to wonder about market pricing during times of stress. The flawed framework that newer traders or non-STIRT traders apply to central bank pricing is to think it’s the modal or median forecast of what people actually think the central bank is going to do. Like a survey. It’s not. There are many ways that market pricing is different from a survey:
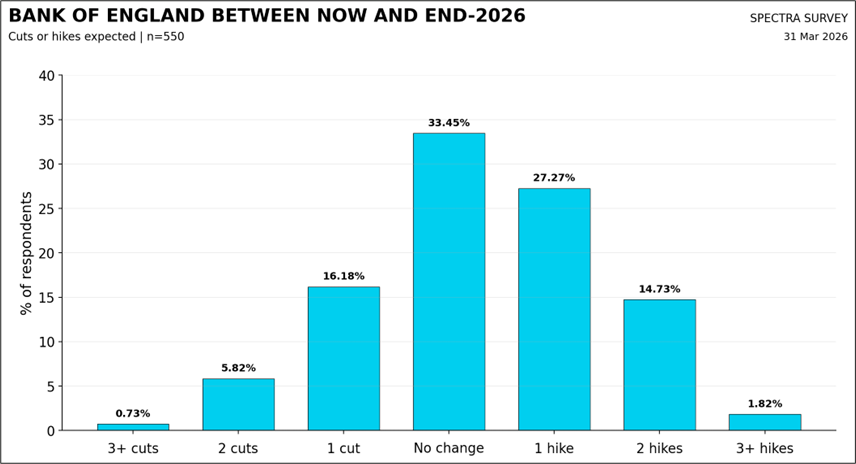
OK, so anyway. We are in one of those regimes. Expectations for the Fed are still leaning towards cuts while the market absolutely does not believe the market pricing on ECB or BoE. It happens! It is logical to want to fade the pricing, but it’s an easy view to hold intellectually and a hard one to risk manage in real life. If oil goes up $50 from here, you need to absorb some hefty mark-to-market losses.
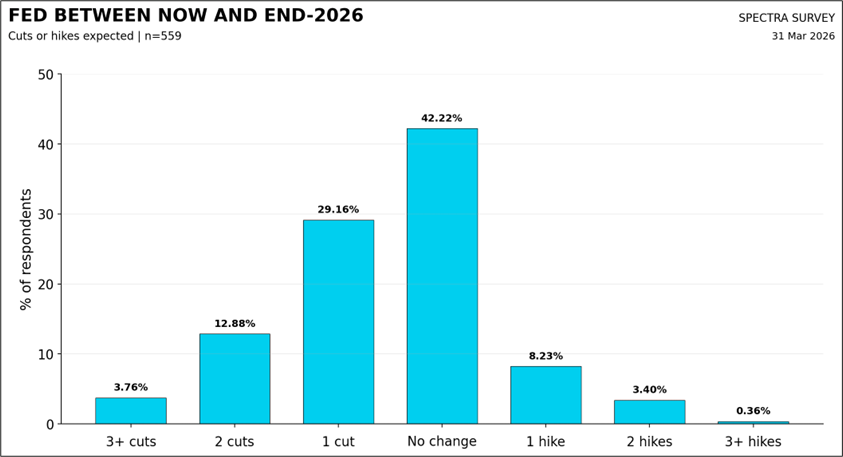
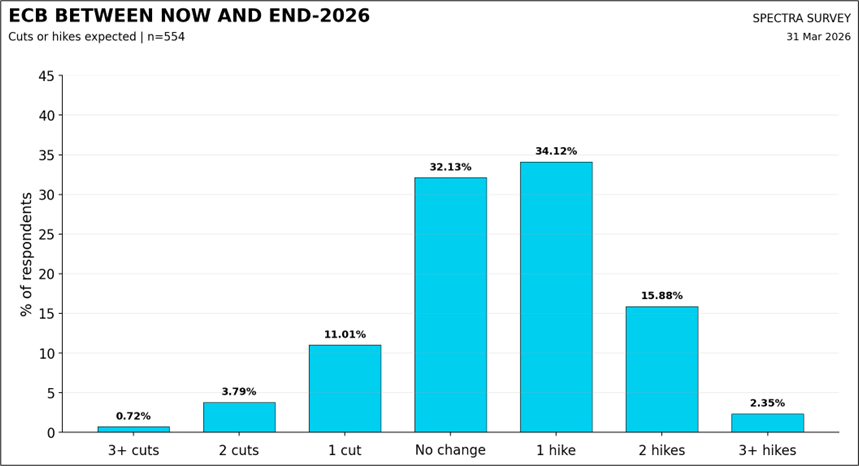
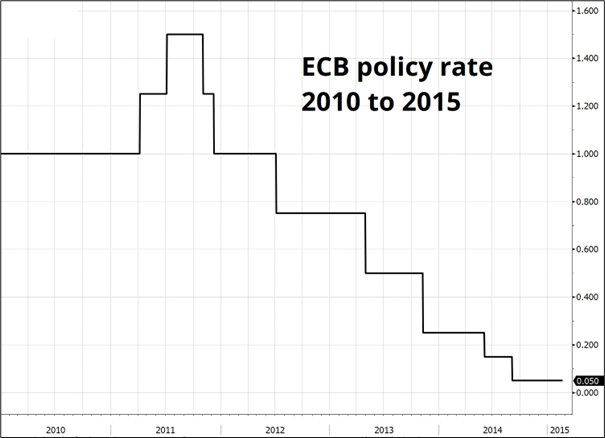
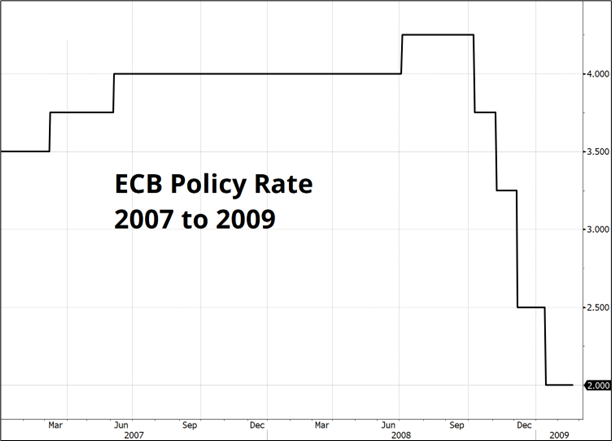
The surprise to me is that anyone actually thinks the ECB will hike three times. But it’s not completely impossible. Labor markets are tight, inflation is about to rip, and while the ghosts of 2008 and 2011 loom large for the ECB, you can also argue that if you’re an inflation targeting central bank who takes the mandate seriously, your only tool is to crush demand. You can always cut rates later, as they did quite aggressively after first hiking in 2008 and 2011. While this feels silly to many people, so is ignoring your inflation mandate and letting inflation run above for 60 months in a row. Central banking is hard.
For your viewing pleasure, here are the expectations for the Fed, ECB, and BoE all in one chart.
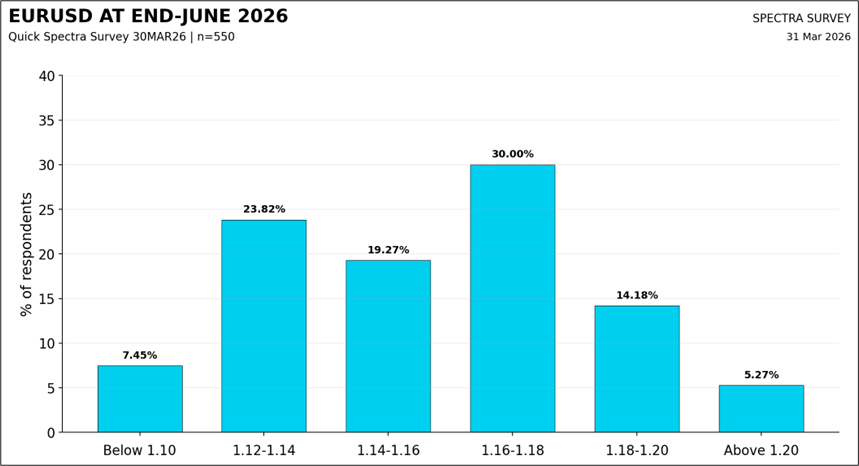
On EURUSD, the answers were pretty boring.
The consensus in early March was that geopolitics is a fade, and most traders were positioning for the FOMO trade on a quick end to hostilities given the many offramps. Now, the consensus is that the U.S. is trapped in an ongoing series of escalations with no offramps after making a litany of miscalculations as it thought regime change was possible through airstrikes and it wrongly gauged that Iran would not have the guts to close Hormuz.
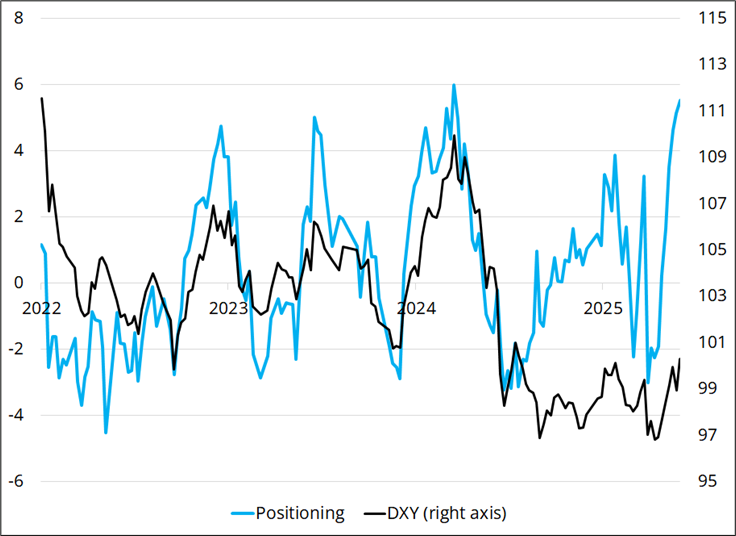
Most importantly, we are coming upon month end and the market is max long USD and/or hedged via currency puts vs. the USD to an extent rarely seen in our data back to 2022. So, whatever I think of the narrative or where stock prices are going… The risk/reward and skew of owning USD is now bad. As such, I will square up the EURUSD short and the AUDUSD put spread between now and noon today. I am not ready to flip, because I am too scared of more escalation and ground troops in the Middle East, but I am open to the idea of buying EURUSD at any moment now. Or selling USDCAD. Or USDCHF. The fact that gold and silver now trade okay, even as equities selloff, is probably also a tell. The market has liquidated all USD shorts and gold longs and is pretty clean now. Anything could reasonably happen from here.
Here is the chart of our positioning indicator for USD vs. DXY. The magnitude of the current rally is smaller than past rips, but the positioning score suggests caution on USD longs now.
Have an egg-shaped day.
This is the theoretical distribution of what date Easter Sunday falls on.
But this is the actual distribution of the date of Easter Sunday from 1583 to now.
The full Gregorian Easter cycle is 5700 years. That’s how long it takes for the specific sequence of Easter dates to repeat itself perfectly. Therefore, the period from the start of the Gregorian Calendar to now (1583 – 2026) is a small sample.
Easter is determined by the intersection of three independent cycles:
The Solar Year: 365.2425 days.
The Lunar Month: ~29.53 days.
The 7-day Week.
These cycles only “line up” to put Easter on a specific date (like March 22) when the full moon and a Sunday hit the same day immediately after the Equinox. In a short 400-year window, these three “gears” haven’t had enough time to mesh in every possible configuration, leading to some dates being “hot” and others being “cold” purely by mechanical coincidence.
