104% tariffs coming and nobody cares?

Canadian hero Terry Fox will appear on the new Canadian $5 bill

104% tariffs coming and nobody cares?

Canadian hero Terry Fox will appear on the new Canadian $5 bill
Long 05JUN USDCNH 7.40/7.60 call spread
29bps off 7.2955 spot
Long GCM5 @ 3036
Stop loss 2964
Take profit 3194
Yesterday’s 8 a.m. setup with bonds down and stocks down 4% was sure eye-opening, but by the time the day was over, everything had snapped back into place and the closing data didn’t show much of anything too spectacular. The market is on the lookout for a Trussification trade, where the USD sells off at the same time as bonds, but so far, we have not got that. The trade in that case would be short bonds, short USDJPY, in a ratio of about 14 TY for every 1 million USDJPY.
This ratio is calculated by measuring the average P&L and standard deviation of the P&L of these two positions sizes. For example, using 300 TY and 22 USDJPY, you get an average P&L of $100k/day on each and a daily standard deviation of $141k in TY and $135k in USDJPY. There are many nuances to risk managing this sort of RV trade, and the measures I have used do not account for skew.
The P&L of that trade looks approximately like the following (does not include USDJPY carry and could be a bit wonky here and there due to TY rolls). The direction of the P&L is of interest here, not the precise magnitude. The real P&L would be higher as you earn the carry.
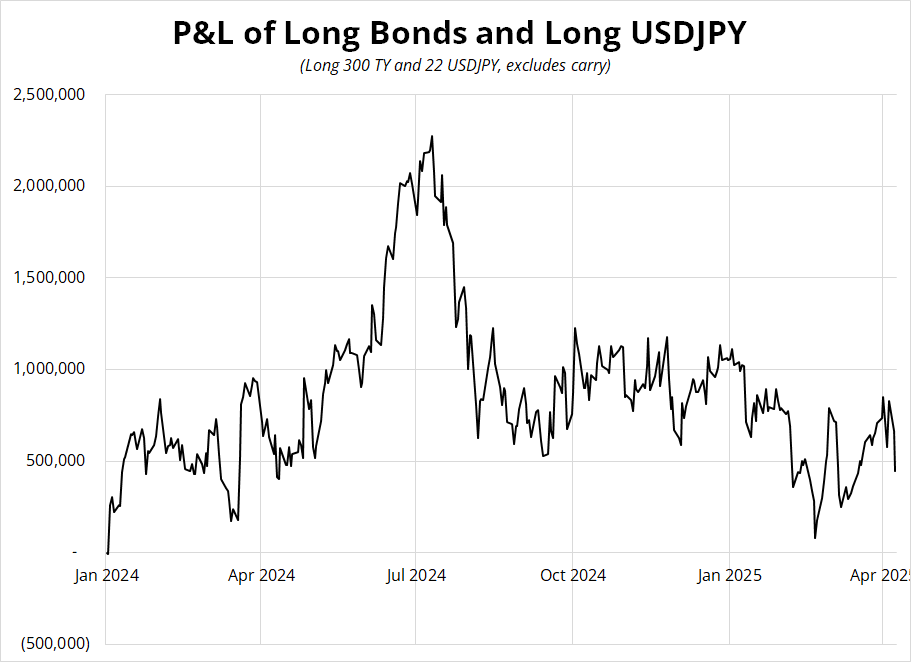
Obviously, the Trussification Trade is short bonds / short USDJPY and so you would flip this chart over to see the P&L of that strategy. The point is that we do not see any evidence of this yet, but it’s worth following. The most likely catalyst for the trade would be Scott Bessent’s resignation.
While that looked like a very likely possibility a few days ago as he was shut out of the initial tariff discussions and looked completely lost trying to explain or justify the tariffs, he has now been given the Japan negotiation job and so his role in the administration looks relevant again. In Policy Chaos World, everything you thought yesterday may or may not be true today.
Here’s the evolution of the Bessent resignation odds:

Total volume on that thing is $10,000 approx., so take it with a grain of salt. That said, it’s probably a pretty decent reflection of how things have evolved. People tend to pooh pooh these low-volume contracts but if you gather 20 people to guess the contents of a jellybean jar or 2,000 people, the average will likely be similar.
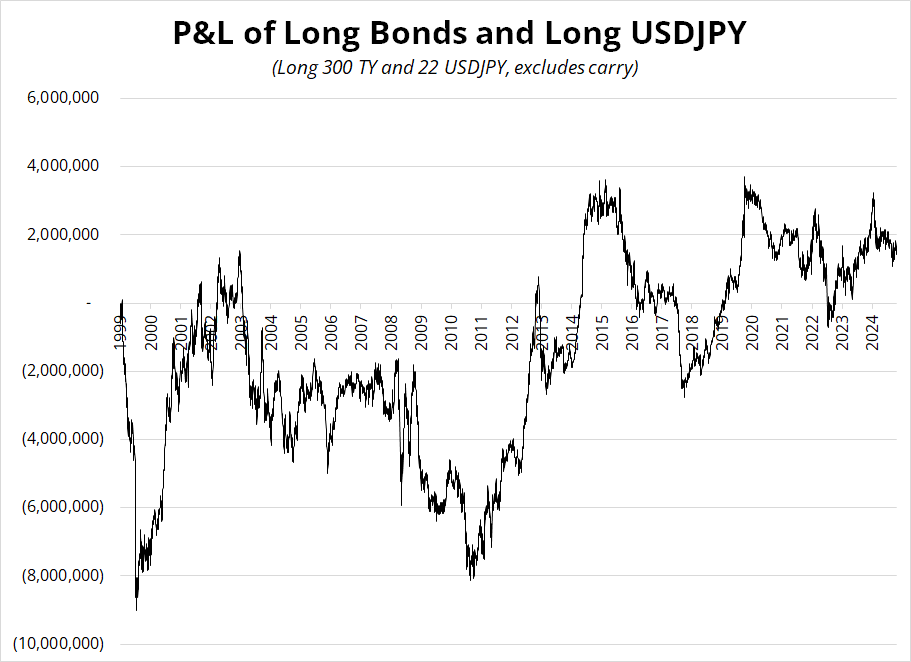
Anyhoo. If you’re curious what the “long bonds, long USDJPY” looks like going further back, here it is. The Abenomics JPY move dominates the P&L for 2013-2015, but you can also see that the rally from 120 to 150 in the past few years has been almost exactly offset by bond losses.
There has been no date set yet for the Bessent/Japan negotiations. That date is important because the market will run up into it buying JPY as the presumption will be that some sort of stronger yen agreement could be on the table. Japan doesn’t want a weaker JPY and neither does the US (and neither do specs and CTAs, who are all long yen!) When we have a date for that meeting, expect it to go very bid for USDJPY puts.
USDCNH is rising despite a weakish USD as the PBoC fixed higher again last night. We are getting close to spicy territory here as 7.3730/50 is the all-time high and a level that was heavily defended in the past.

While the 2018 move was an orderly devaluation in response to tariffs, the move higher in USDCNH in 2021/2022 was all about the USD and, in fact, the CNY weakened against the basket. Any time you are thinking about CNH or CNY, you need to consider both what it’s doing against the USD and what it’s doing against the basket. You can see the orderly deval in 2018 is completely different from the USD rally in 2021/2022. While every fix is important these days, the remaining fixes this week will be particularly epic. The whole reason I put the USDCNH call spread on was the expectation that we will see an orderly devaluation like we did in 2018. That thesis relies on steadily weakening CNY fixes (like we have seen so far this week). If they start pegging it again, I will bail quick.

For all the chartists out there: USDCNH looks like a textbook ascending triangle.

It’s a bit hard to believe that we are going to get 100%+ tariffs on China as we make a bottom in equities, but you sometimes make equity bottoms on bad news, not good. Still, my guess is that equities leak into the close as the market worries about what’s going to happen if and when these 50% added tariffs come in. Presumably this will lead to a near halt in imports from China and some kind of supply chain shock and price spikes like we saw in 2021. But nobody else seems to be talking about that today because NQ is up 400 points. Are we just assuming it’s a bluff again? That hasn’t been a good assumption! I feel like I’m missing something here.
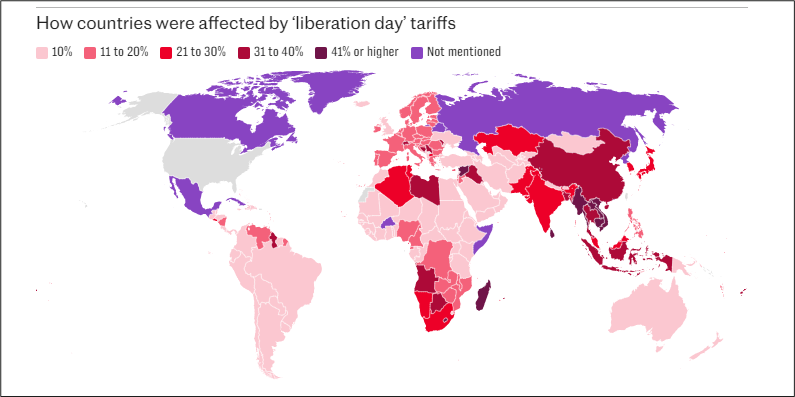
Nice map from the Telegraph.
I made a typo in the sidebar yesterday on the gold stop. In the text I said 2964 but I transcribed it as 2974 in the sidebar. The low was 2970 so that is a significant typo. The correct stop is 2964 and the trade is still alive. Have a courageous and hopeful marathon of a day.
Some pain
Hi. Welcome to this week’s report. The three most popular trades (long EUR, long JPY, long GBP) were punished this week as the market sold USD on tariffs but got no joy. Tariffs have created a lot of frustration for FX markets as they are not clearly bullish anymore, but the USD negative trade has been stymied by a major liquidity event that has battered all and any popular positions. This wipeout also took down gold and EU equities as everything popular was reduced to pay for losses elsewhere.
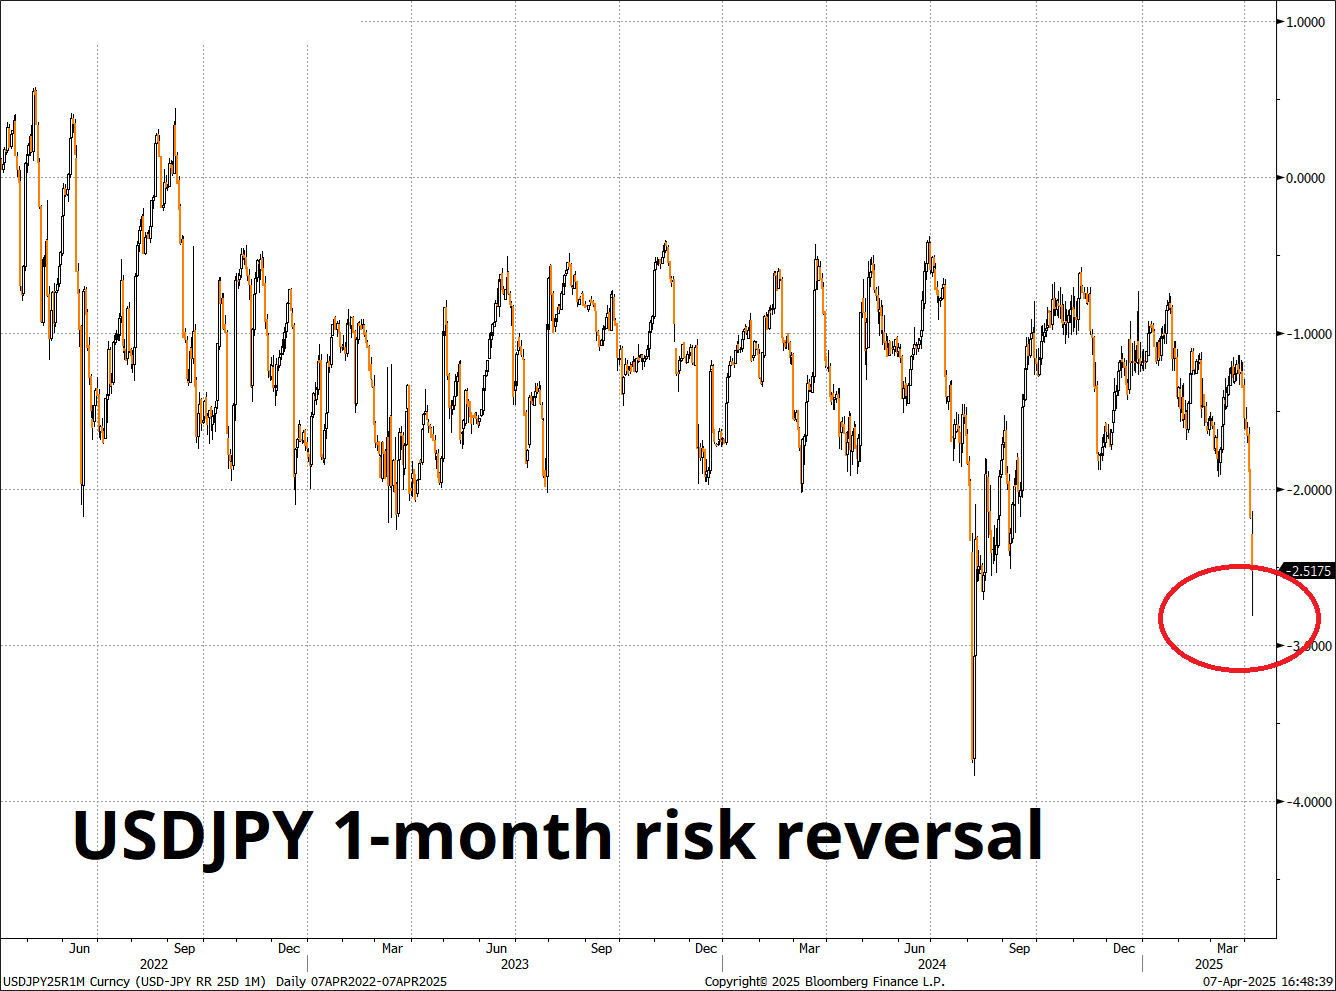
It is unusual to see the risk reversal so much lower in USDJPY, equities down hard, VIX up substantially, and USDJPY close to unchanged. This is not really about JPY positioning, though the market is long JPY. It’s more about the crazy price action in bonds as the initial tariff rally in fixed income quickly failed and reversed, yielding a gigantic reversal on Monday. As often discussed here, unless we get a regime change to “sell bonds, sell USD” on capital flight out of the United States, USDJPY remains a bond trade, not an equity trade.
The second chart shows the times when you had a decent move lower in the risky and higher in spot over a two-day span. I don’t see any forecasting value there, but I show the chart out of curiosity so you can see how rare this is. If you stare close enough, you can see that the risky never went lower in these situations, but that’s not a hugely useful insight because the risky always tends to flash lower then mean revert, much as the VIX flashes higher and reverts lower when the waters calm.

Interesting timing in the pound, as the market added to long GBP in recent weeks, and now we have seen a fairly dramatic turn lower in the pound. When money is sucked out of the global financial system, as it has been over the past four trading days, wonky things sometimes happen.
The market’s flipping willy nilly from sell USD to buy USD back to sell USD. Yes, money is flowing out of US assets (USD bearish) but funds and investors are also scrambling to find liquidity for margin calls (USD bullish). The net effect has been a whipsaw. FX positions are weakly held right now as conviction across the world of FX is low.


Canadian hero Terry Fox will appear on the new Canadian $5 bill.
Sweet.