Employment insights from a guy who took economics but isn’t an economist
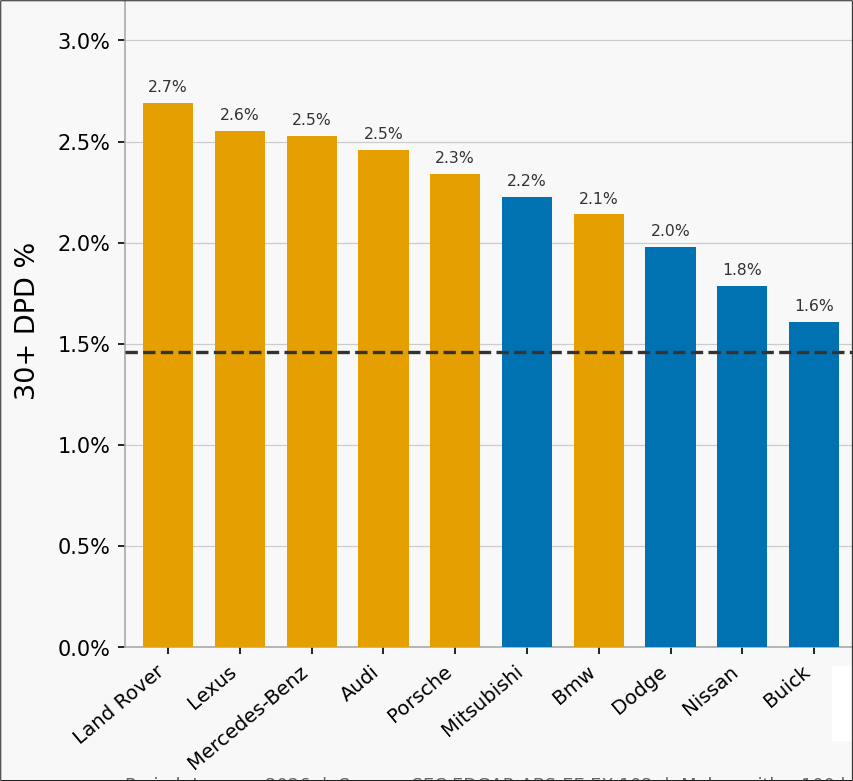
Owners of luxury auto brands are far more delinquent than mass market vehicle owners
Full graphic at bottom of page

Employment insights from a guy who took economics but isn’t an economist

Owners of luxury auto brands are far more delinquent than mass market vehicle owners
Full graphic at bottom of page
Sell 1-month (07APR) EURCHF 0.9010/0.8960 put spread … and buy 2-month (07MAY) 0.9110/0.9160 call spread for close to zero cost
Nonfarm payrolls tomorrow loses some of its luster as the war in the Middle East takes center stage. Looking at the survey data for February, there is some cause for optimism as ISM employment indices creep higher (manufacturing and non-manufacturing) with Services Employment touching a 1-year high. Here you can see that the tariff shock triggered a pullback in hiring sentiment and after about six months, it dissipated. Now, hiring sentiment has reverted to pre-tariff levels as everyone comes to the surprising conclusion that tariffs don’t matter.
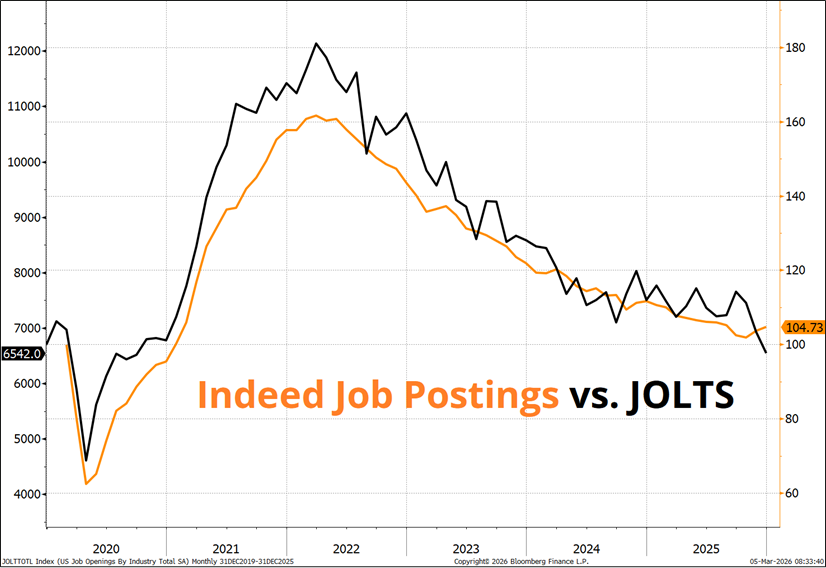
Indeed Job Postings (a much better, cleaner, more timely, more accurate version of JOLTS) also had a bit of an inflection point in late 2025 as the number of job postings bottomed. People other than Tom Fitzpatrick get mad when you draw channels and trendlines on economic data, but the idea here is to simply acknowledge that the rate of decline of the Indeed Job Posting series has slowed significantly.
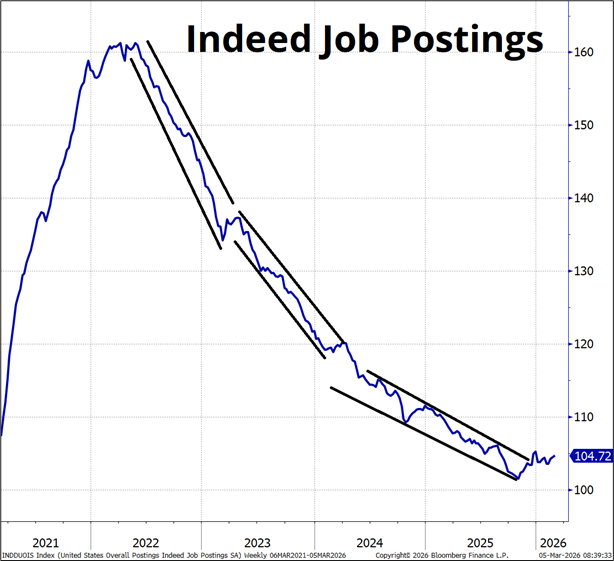
Note that the next JOLTS release (March 13) will almost certainly be higher as it catches up to Indeed and mean reverts like it always does. I have written about JOLTS mean reversion here. This chart is monthly, but the Indeed series comes out weekly. You can look around at Indeed’s data here: https://data.indeed.com/#/
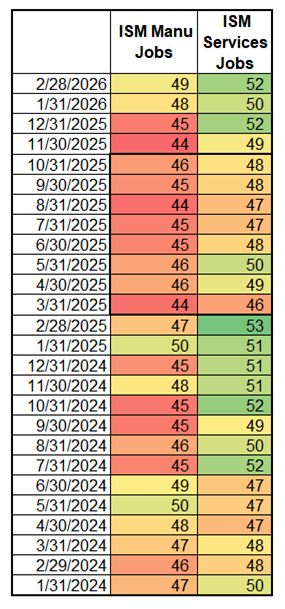
While spelunking around on Bloomberg, I grabbed all the Indeed numbers, by industry, and calculated the change vs. six months and one year ago. The results are mildly interesting and seem to speak logically of a rotation away from health care and into AI capex-y industries. Table below.
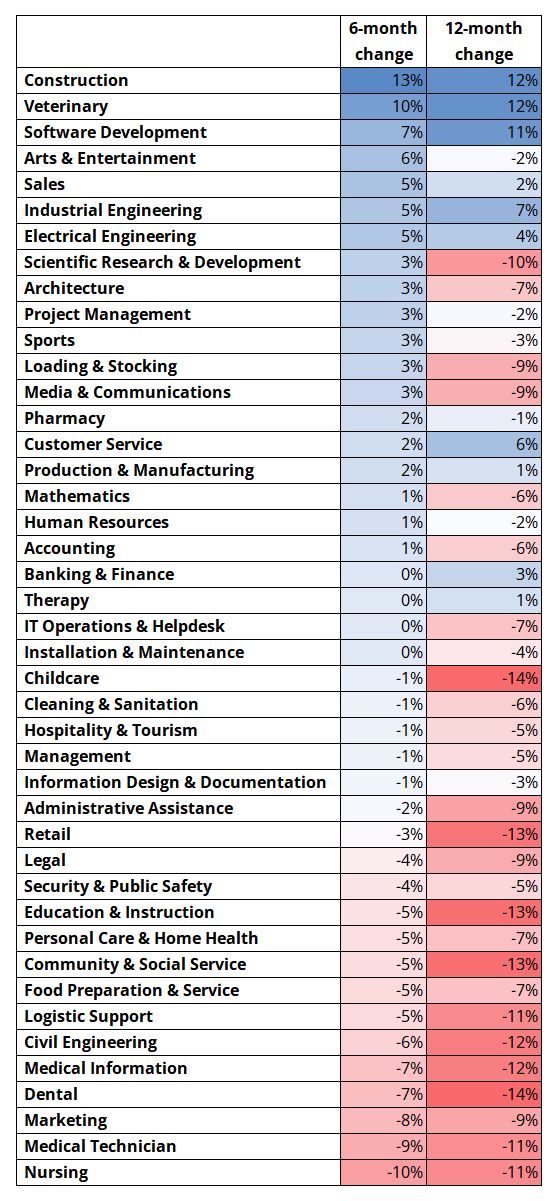
Ed Tufte will not be handing me any visual display awards for the layout of this page, but I wanted the table to be large so that people my age can read it.
The rise in software development jobs is interesting as the knee-jerk theory was this would go down but now companies are realizing that AI doesn’t deploy itself and so maybe you don’t need compsci grads coding, but you do need AI experts doing stuff.
Other than veterinarians (?), the jobs that have the bluest boxes in the table are Construction, software, and engineering. Logical enough!
No call to action here; I just thought it was interesting. After slicing and dicing a bunch of stuff, my guess is that the risk is a slightly strong jobs report, but my conviction is low because even if demand for workers has stabilized, it’s very hard to know if the supply is there. So I would be more confident on a 4.2% or 4.3% UR than guessing the headline NFP. If labor supply is falling as demand picks up (possible due to immigration crackdown), we could see low UR and low headline NFP and that would make perfect sense.
Not much to report on the war, other than the fact that oil isn’t pulling back. I suppose for macro punters, watching oil is the simplest and most useful gauge of whether or not there is visibility on a resolution. For now, oil says no. This chart shows stock prices inverted vs. oil in black. You can see that since the US and Israel attacked Iran, the NASDAQ (red) has been less sensitive to oil price movements compared to Korean equities (blue) or airlines (green).
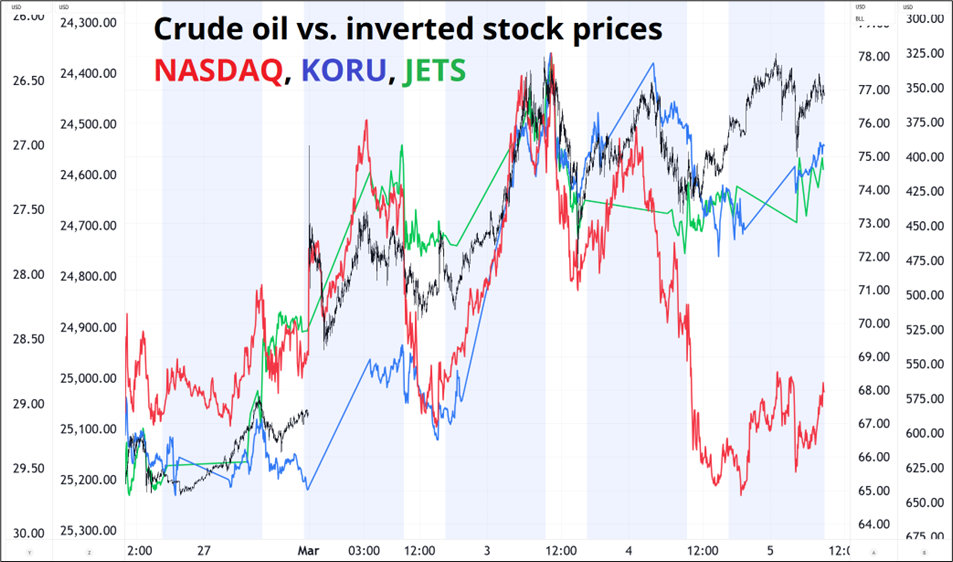
My bet is that CL above $90 will trigger the start of a big degrossing event which will accelerate if $100 breaks. That is not a huge or courageous call to make, I suppose. But something to keep in the back of your mind.
The SNB squawked twice at 0.9060. While they have very low credibility on intervention, they can turn it for a week or two. Humans place larger-than-normal importance on round numbers and we are getting close to 0.9000. And the SNB is run by humans. I would not be short EURCHF down here. Selling 0.9010s to buy 0.9110s is probably a good trade, especially if you can do it in limited downside. Not huge leverage but high EV. I am going to put this in the sidebar.
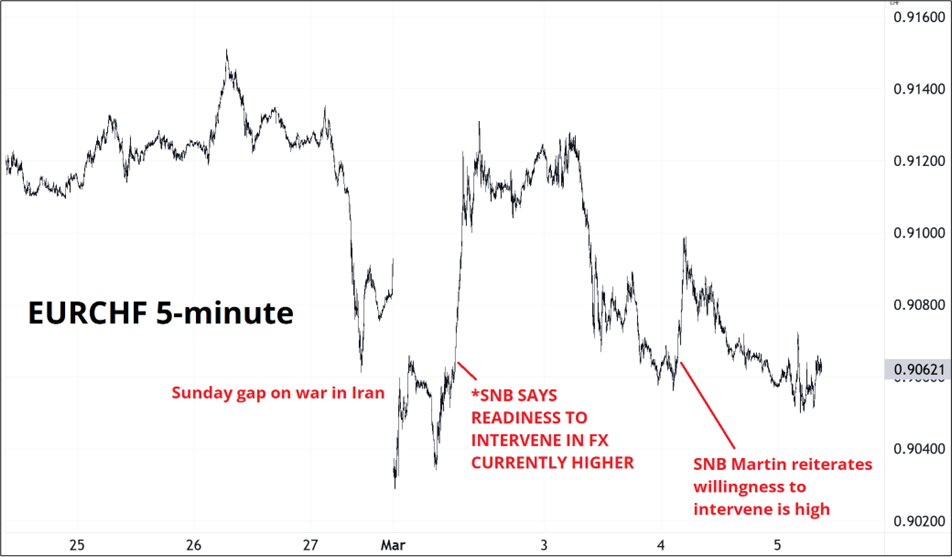
Sell 1-month 0.9010/0.8960 put spread and buy 2-month 0.9110/0.9160 call spread for a bit more than zero cost (two basis points, approx., depending on spot). You are taking advantage of the steep vol curve and the forward this way. The delta at inception on 100 million euros is around 20 million EURCHF. This is not a retail-friendly trade idea, so I apologize to retail traders. The other idea would be to simply buy EURCHF here with a stop at 0.8959. Not that different of an idea, but the option trade is way better because you can’t get stopped out. You have staying power if there is escalation in Iran and then de-escalation. So I really don’t love the spot trade. The option trade I do love.
Have an all-cash day.
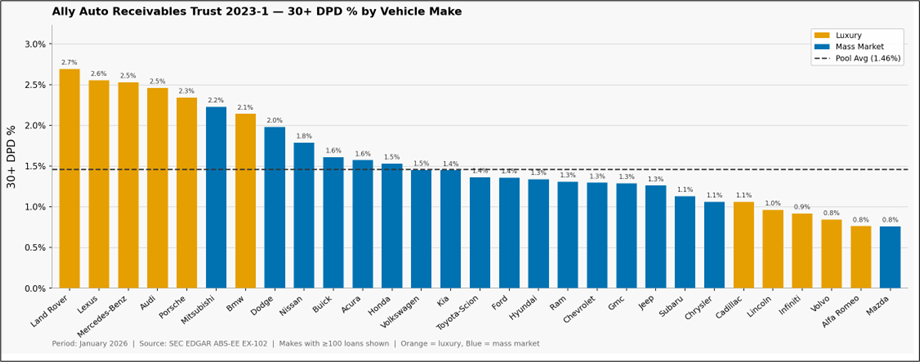
Initially counterintuitive, but I think I get it.
Rich people pay cash.
Status-motivated buyers borrow to buy luxury vehicles they cannot afford.

Leasing is worse!
