Brazil
There is a common pattern in FX where the impact, risks, and volatility of major upcoming events are first underpriced, because nobody is thinking about them, and then eventually overpriced, because everyone is thinking about them a lot. This process accelerates into the event and usually peaks just before the event itself.
This behavioral pattern is visible going into and out of Brazilian and Mexican elections. With the election in Brazil just about a month away, I think there is an opportunity to play this pattern. While I have a working knowledge of the Brazilian election dynamics, and I will go through a few of these later, my main logic here is behavioral. The market tends to hedge into the election and strip hedges after. With BRL a favorite over the past few years, there is reason to think that such hedging will happen again this year.
First of all, here is a two-panel chart. The top shows the median path of USDBRL over the past six elections in black with the median path in all other years in green. The bottom shows the six individual paths. If you use average instead of median, you get a similar-looking top panel.
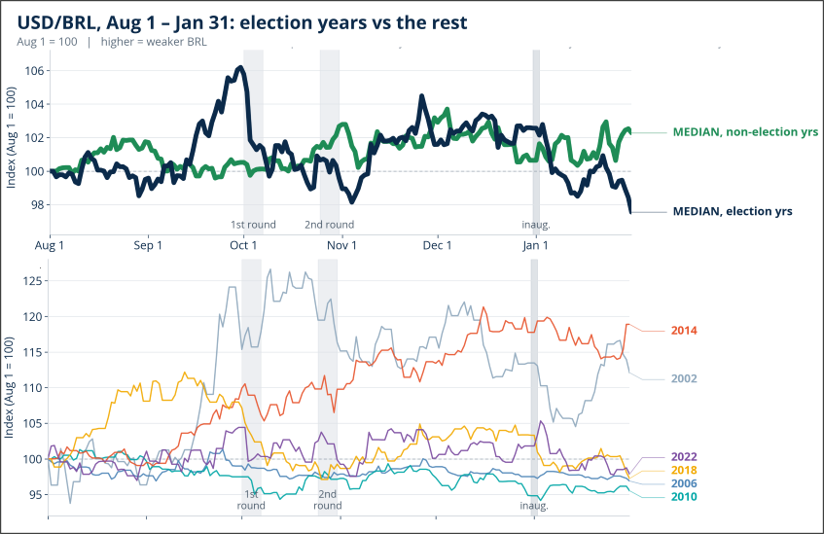
The obvious takeaway is the big up/down into and through the election. That’s a combination of nervous hedging, political headlines on fiscal expansion, changes in the polls, etc. Obviously, the political starting point going into the election matters, and I will discuss that a bit later. For now, though, I am just trying to convince you that hedging and nervousness is real. You see the relief into and after Round 1 of the election, then another flurry of relief on inauguration at the start of the following year.
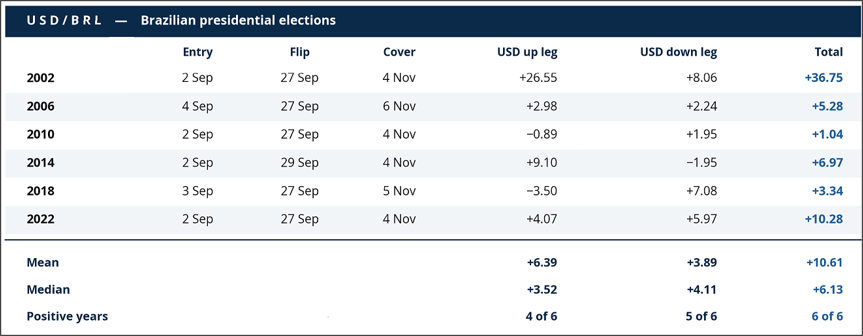
Here is a table of a simple strategy: Go long USDBRL September 2, flip short September 27, and take profit on November 4. The 2002 election is an absurd outlier, but you can see that the strategy has gone 6 for 6 in the past. You could more accurately say the strategy has four clean wins, one enormous outlier win, and one scratch. This sample size is tiny, of course, but what are you going to do? Results under each leg of the trade are expressed in P&L terms, not the direction of USDBRL. So, a positive number means the strategy made money on the up leg (USDBRL higher in September) or made money on the down leg (USDBRL lower in October).
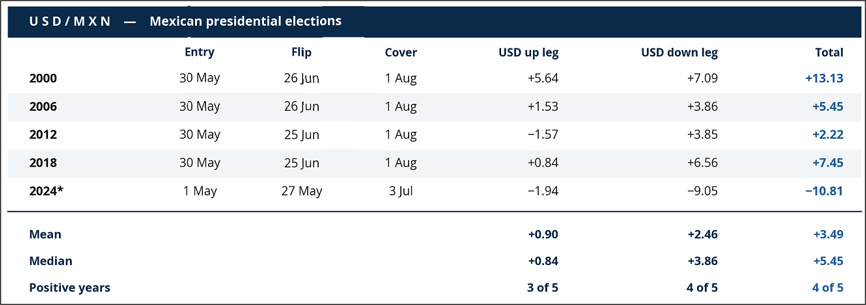
I suppose we could look at Mexico and see if the pattern worked there. It did, mostly, though the most recent election was the first time it did NOT work. We are up to a sample of eleven and that’s the best I can do. Could be random, but probably isn’t.
Now, before I conclude with the trade idea, I will add a few nuggets about the election. Again, I would like to insist that there are better experts out there when it comes to Brazilian politics. I have never once been accused of being such an expert. I know more about Rio poker rooms than I do about Brazilian elections. Still, even if you are doing a trade for behavioral reasons, you need to know the basics of the setup so that you can risk manage it, trade it, reassess, get out, etc. First of all, here’s a quick flipbook through the past six elections.
2002: Lula beat Serra. Lula led all year, so the winner wasn’t a surprise. The huge spike in USDBRL into the election was more about a solvency scare than the election. Brazil was in the middle of IMF package negotiations in August/September 2002.
2006: Lula beat Alckmin. Lula was expected to win in round one but the dossiê dos aloprados hurt Lula, temporarily. He won round two comfortably. FX was fairly calm, but the up/down pattern held.
2010: Dilma beat Serra. Dilma led from mid-year on Lula’s endorsement, and by September a win was priced in. The surprise was Marina Silva got 19%, which held Dilma to 47% and forced an unexpected runoff. The real story was Mantega’s “currency war” in late September. The IOF went from 2% to 4% on October 4 and to 6% on October 18 as authorities tried to slow BRL appreciation. The up/down pattern trade was close to breakeven in 2010.
2014: Dilma beat Aécio. A chaotic cycle. Eduardo Campos, running third at roughly 8%, died in a plane crash on August 13. Marina Silva replaced him on August 20 and surged, with late-August polls showing her beating Dilma 48–41 in a runoff. She collapsed through September while Aécio came from third to an unexpectedly strong second. The runoff was 52/48, closest in history to that point. Spot ran from 2.25 to 2.43 in September.
2018: Bolsonaro beat Haddad. August polling was strange: Lula led at 37.3% while jailed and expected to be barred, which itself hurt BRL. Bolsonaro was stabbed on September 6. Through late September, the market still priced a PT win. Datafolha had Haddad ahead 45–39 in a runoff — and USD/BRL topped at 4.21 on September 13. The repricing came with Bolsonaro’s 46% on October 7. Spot was 3.73 by November 5.
2022: Lula beat Bolsonaro. Lula led throughout, near 46% against Bolsonaro’s 33% in late September, with a first-round win live. The surprise was Bolsonaro’s 43% against Lula’s 48%, plus a strongly right-leaning Congress. Spot fell from 5.41 on September 30 to 5.17 on October 3. The runoff was the narrowest ever at 51/49.
And here are the current election odds:
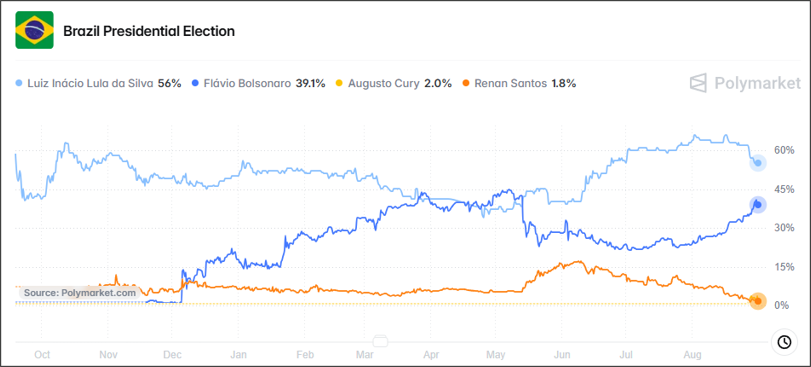
Common knowledge this time is that Lula is bad for Brazilian assets, and Flávio is good. E.g.:

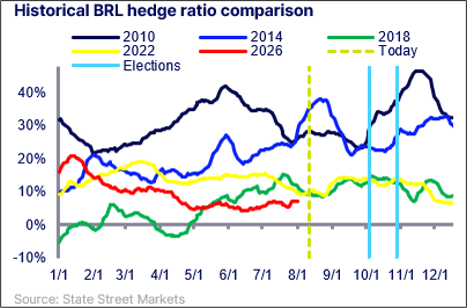
The takeaway from this walk down memory lane is that each election setup was dramatically different and yet the up/down trade worked every time. I don’t think it’s controversial to say that Brazil has been a popular long in recent years because of its strong carry and relatively low vol. So if my theory is mostly about nerves and hedging, the hedge ratios going in should matter. Below is a chart from State Street that shows hedge ratios are extremely low going into this election.
The tricky thing with this up/down strategy is that cash/NDF trades in USDBRL are hard to risk manage with the overnight gaps and headline risk. You need to give a bit of extra space to manage the risk properly. I am going to keep it simple and do the NDF because the option I like best does not outperform the cash trade until 5.4270—that is way too far away given I am only looking for 3% or 4% higher from here.
Here’s the math, in case you are interested in how the option compares to spot. If you buy 30 million USDBRL here in spot (5.1800 spot, 1-month equivalent 5.2120), with a stop at 5.0890, or buy 66 million USD of a 28SEP 5.27 call for around 75bps off 5.18 spot (5.2120 forward)—each trade risks about $500,000. And here is the P&L comparison.
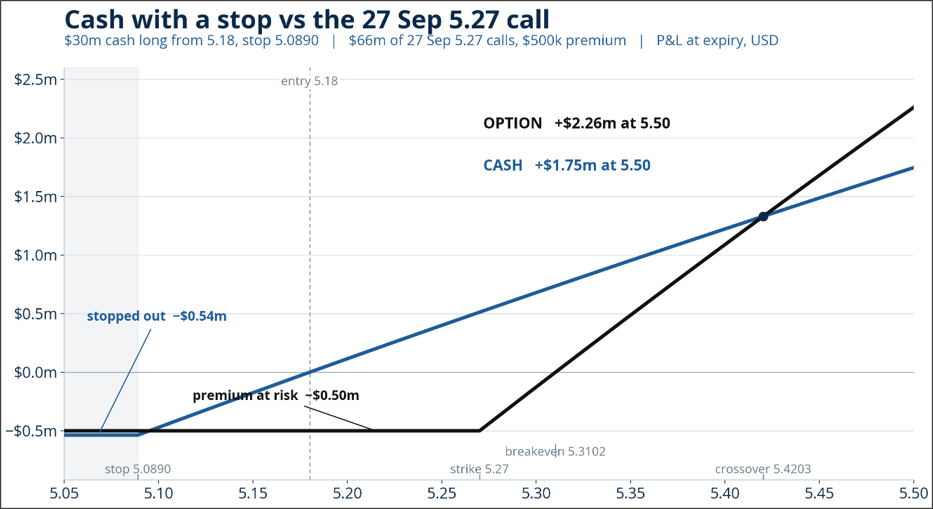
Is there a path where you get stopped out of the cash position and then USDBRL skyrockets and you wish you had the option? I doubt it. Is USDBRL going higher than 5.42? I doubt it. The option protects you from gap risk and gives you a bit of extra leverage if USDBRL goes to the moon, but overall it looks way too expensive and super negative EV. I would rather take my chances with the NDF and pay a month’s worth of negative carry.
If the long USD leg of the trade works, we will do the flipper on September 28 by either turning short USDBRL or selling a call spread to capture the possibly bananas vol. In the meantime, any 3% to 4% USDBRL rally is a strong reason to reassess and consider taking profit on USD longs. That would be in the 5.34/5.39 area. This is a case where it’s better to trade like you’re long gamma—not actually be long gamma.
Finally, please note that the Brazil election pattern is partly the result of risk aversion in September followed by risk appetite returning in October. That is a general pattern through history and was the pattern through the Brazilian election years. Still, there are counterexamples like 2018 where both the S&P 500 and USDBRL fell considerably through October. I acknowledge this trade idea has a simplistic logic. Ideally, you know a lot more about Brazil politics and can then watch for this behavioral pattern to repeat, or not repeat, based on a more sophisticated/nuanced understanding of electoral developments. Or, just trade the pattern.
Final Thoughts
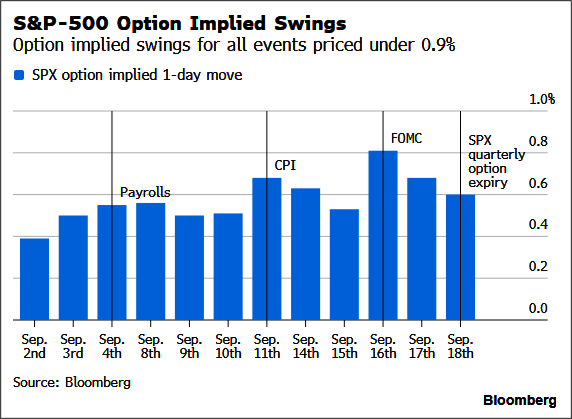
- Sabrina made a good point to me yesterday: Even as Warsh is saying the jobs market is fine and they are focused solely on inflation—it would be incredibly difficult to hike rates in the face of two straight negative payrolls prints. I think that’s a great point and so while I continue to feel that PPI is the biggie next week, I do agree that a negative NFP is probably a tough river card for the hawks.
Somewhat related, below please see a nice chart from Bloomberg. If you want a directional bet, buy PPI vol. See yesterday’s am/FX for why PPI is key.
- Starting to look like another “failed” USDJPY intervention is in the books.
- US 10-year yields breaking out will make it very difficult for crypto as gold and silver have already rolled over. The debasement trade needs another intervention but none is likely to be forthcoming until at least September 10.
- The joy of victory / the agony of defeat.
Have a literate day.