Rate differentials are screaming “Lower USD!” but there are crosswinds
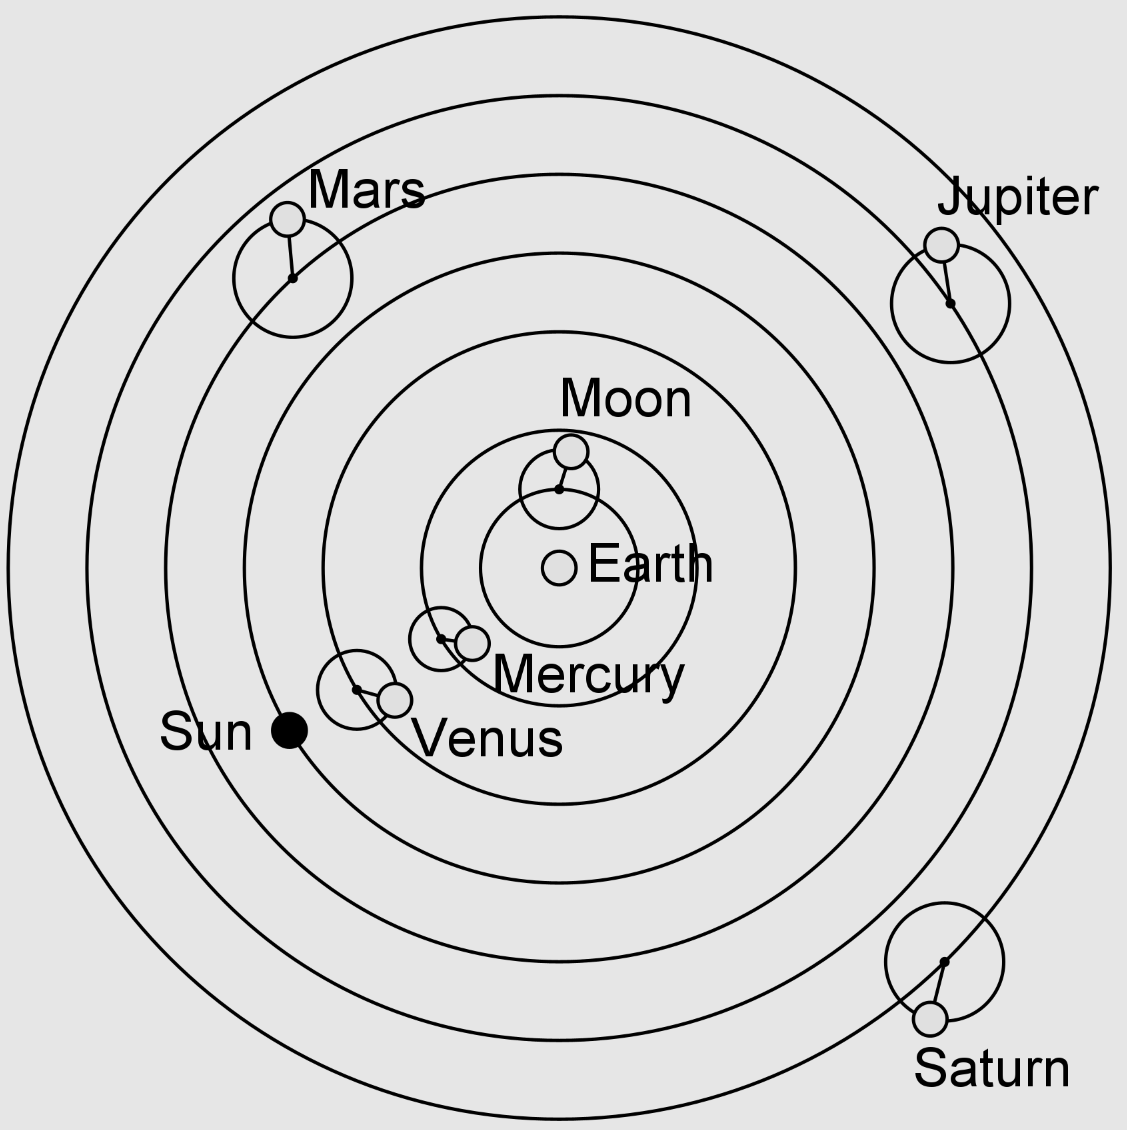
Geocentric orbits as described by Ptolemy in the 2nd century

Rate differentials are screaming “Lower USD!” but there are crosswinds

Geocentric orbits as described by Ptolemy in the 2nd century
Long 10MAR 104.30 CADJPY put ~64bps
Trade gamma if we get to strike before end of the month.
Short gold at 2940
Stop loss 3011
Take profit 2805
The bond market is reacting to the turn in the US data and the fear of a DOGE multiplier that could turn government from the dominant upside driver of the US economy to the most important negative catalyst over the next few months. Furthermore, Dark PT Barnum is directly threatening bond shorts:
“The bond markets do not currently reflect the savings that I’m confident we can achieve,” Elon Musk said during a discussion he led on his social media platform, X. “If you’re shorting bonds, I think you’re on the wrong side of the bet.”
That quote is from a Bloomberg article highlighted by Tim power: The Bond Market Isn’t Fully Buying What Musk’s DOGE Is Selling. While the savings advertised by DOGE are tiny so far, the vibe shift is important and the promised cuts to defense spending are meaningful and relevant.
USD bulls are in a tricky spot now as the US peaks, AI capex looks toppy, MAG7 earnings growth is falling… Just as Europe looks ready to open the coffers a bit. This has lead to a rip in the spread between German and US yields.

Thing is, it’s not all clear for USD bears, either. Tomorrow is corporate month end (buy USD), Friday is real money month end (small USD buy if stocks stay here—currently down about 1% for February) and tariffs continue to pose a threat to global economies, especially Canada, Mexico, and Europe.
Meanwhile, USD seasonality is bullish until the end of the first week of March and USDJPY enters an important seasonal period as Japanese fiscal year end approaches. As mentioned yesterday, we continue to see big RHS USDJPY flows in Japan, especially at the Tokyo Fix.
So while a cursory look at the rip higher in US bonds makes it seem like short dollars should work, it’s not that easy. Much of the dollar’s short-term fate rests not on yield differentials, but on corporate flows and the enactment, delay, or cancellation of the 25% tariffs on Canada and Mexico. While they appear to be an ongoing bluff, who knows?
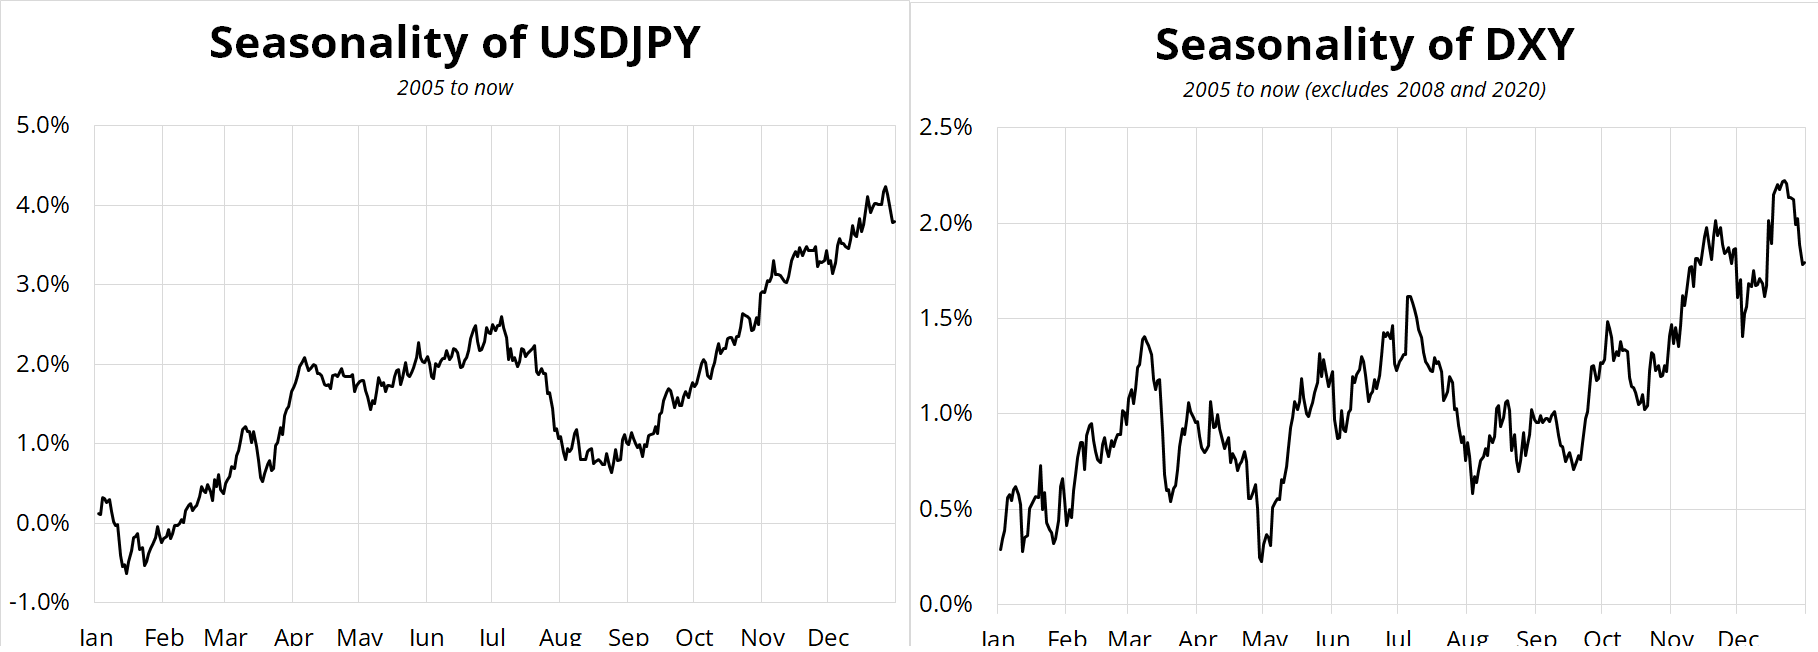
That USDJPY seasonality from mid-March to the end of April is probably the most reliable seasonal in FX, but there is a school of thought this year that GPIF and other members of Team Japan might use that period to rebalance into JGBs and out of global bonds as JGB yields are no longer de minimis. So I would not bank on the seasonality working this year, even though I am generally a proponent of trading it aggressively. Again, watch for a turn in flows in Japan time, because it’s hard to get a meaningful down trend in USDJPY without the full participation of the Japanese time zone. The day you see USDJPY selling into the Tokyo Fix is probably the day to buy some 25d downside in USDJPY.
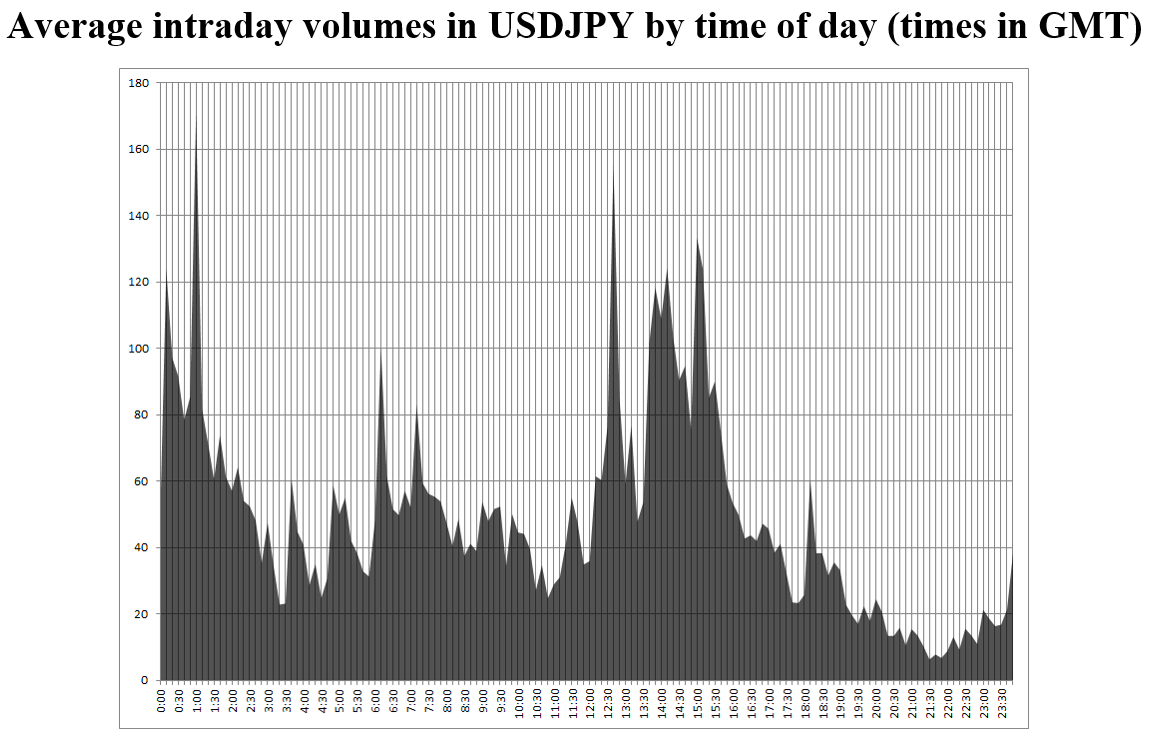
To give you a sense of the size of those Tokyo Fix flows, here’s a chart of USDJPY volume by time of day. That spike on the left is the Tokyo Fix. No other major currency hits peak volume outside the LDN/NY overlap.
The rebound in Chinese tech stocks has coincided with a zippy move higher in Chinese yields. While all the good news out of China and Europe so far is on the financial market side, not the real economy side, there are harbingers of a global manufacturing rebound all over the place.

Unfortunately for the USA, manufacturing is a rounding error vs. services.
PLTR filled the gap. Today is the deadline for SMCI to file its financials. NVDA earnings tomorrow. Gold finally topping? BTC blowoff complete? Things to think about. I think the bitcoin close today is important because technical levels tend to get taken out and recaptured a lot in BTC as the highly-leveraged retail crowd all leave their stops in the same place and then the move burns itself out once those stops are rinsed. A close above 90k is bullish bitcoin s/t and a hold of $85/$88 is bullish PLTR. And today is Tuesday.
Have an egocentric day.
Won’t Get Fooled Again
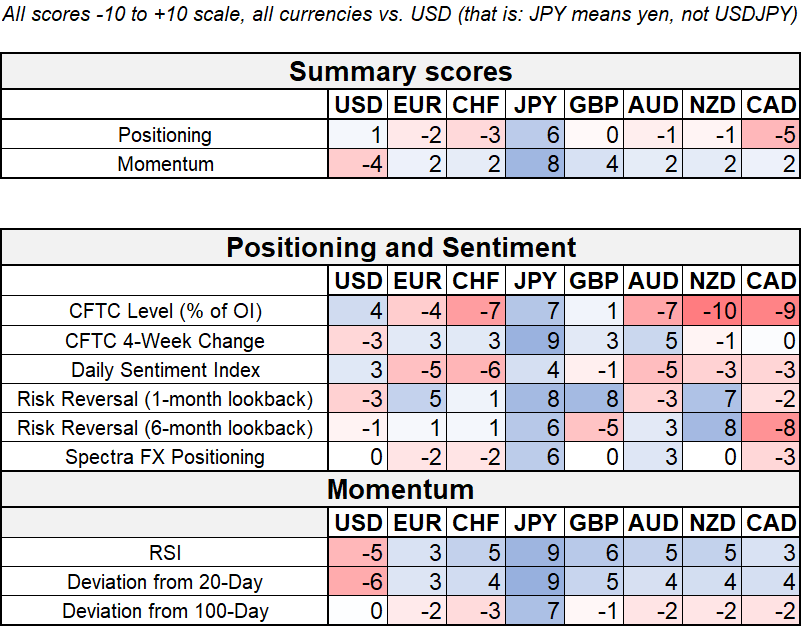
Hi. Welcome to this week’s report. The dollar longs have evaporated as the market pivots to a weakening US growth story, dreams of a Mar-a-Lago Accord, and/or complacency and boredom with regard to tariffs. The mantra is now “Won’t Get Fooled Again” on the policy stuff as the credibility of future tariff threats has gone from high to very low in a short span. This may create opportunities for anyone who believes hawkish tariff policy is still a real threat.
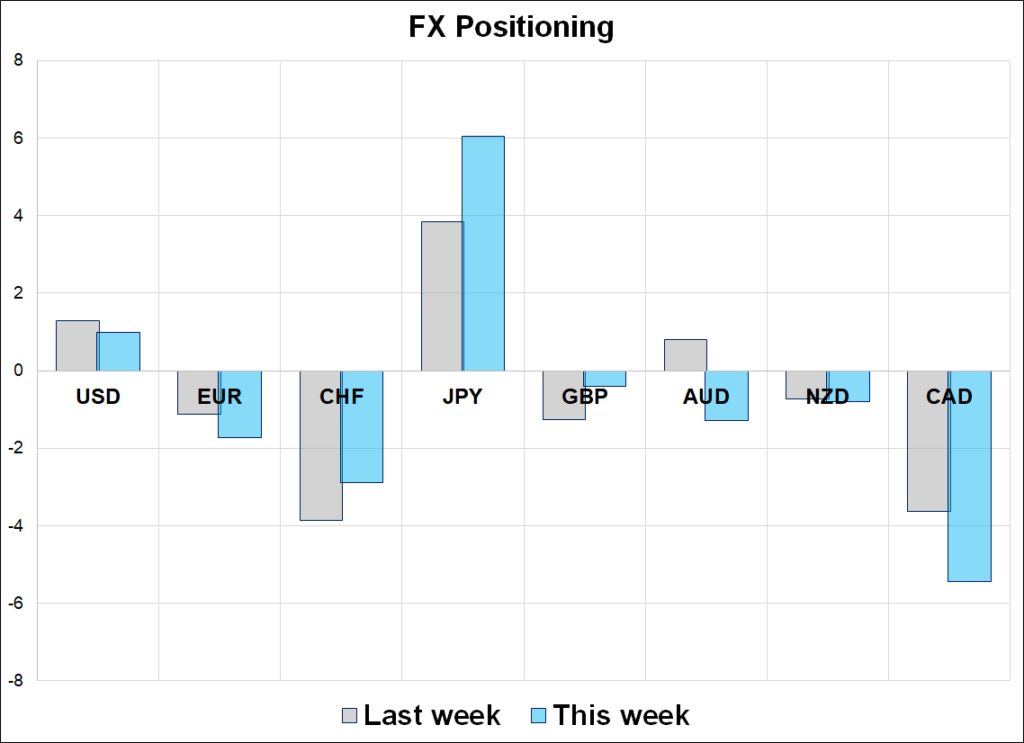
It is mildly concerning that my CADJPY short put on yesterday is reflected as the only real position of note in this week’s positioning report. The CFTC and specs have flipped to long JPY while the CAD short is just permanently ensconced given the economic uncertainty in Canada as the Sword of Damocles continues to dangle over Ottawa. Nobody seems particularly concerned about the tariffs anymore, though, it’s just that the price of CAD hasn’t moved enough to dislodge the CFTC trend following positions. Note, though, that JPY positions on the CFTC are historically a “go with”, not a fade, so the flip from max short JPY to max long is not necessarily a bad sign if you’re long yen.
Here’s the thing about CFTC data
CFTC data is primarily trend following. If the market trends, the CFTC positions make money. If the market chops, they don’t. There is no money to be made blindly fading the CFTC. That’s why we incorporate many other measures into our positioning index. Our Spectra Index has been quite good as a contrarian indicator (especially when it comes to the USD) because it’s crafted with a good variety of inputs, not just CFTC data.
The CFTC data gives you a sense of what the slow-moving aircraft carriers are doing (trend following CTAs) but not much else. I will post four examples here, so you can see the relationship between trend and positioning.
For each of these products, I show a chart of the P&L of following the CFTC position. In other words, if the CFTC is long, you go long on the Friday at the close (which is 2 hours after the positioning data comes out, and thus realistic). You rebalance every week. Starting with yen, you can see that when USDJPY is rangebound, the CFTC loses money. These P&L measures do not include carry, but that doesn’t change the overall trajectory enough to matter for my purposes here.

Note how the big trends in USDJPY are captured by the CFTC and the rangebound activity leads to P&L drawdowns. That makes sense. It takes ages for the CFTC to flip from long to short or vice versa and therefore changes in trend and choppy markets trigger a lot of back and forth before the position catches a trend. While both charts look similar, the CFTC isn’t simply long USDJPY all the time. For example, the red circle marks the 2016 bear market in USDJPY, and the positive P&L generated by CFTC positions.
So, it’s pretty simple. If USDJPY is going to trend lower, the CFTC will make money. If it doesn’t, they won’t. There is no contrarian signal to fade the CFTC.
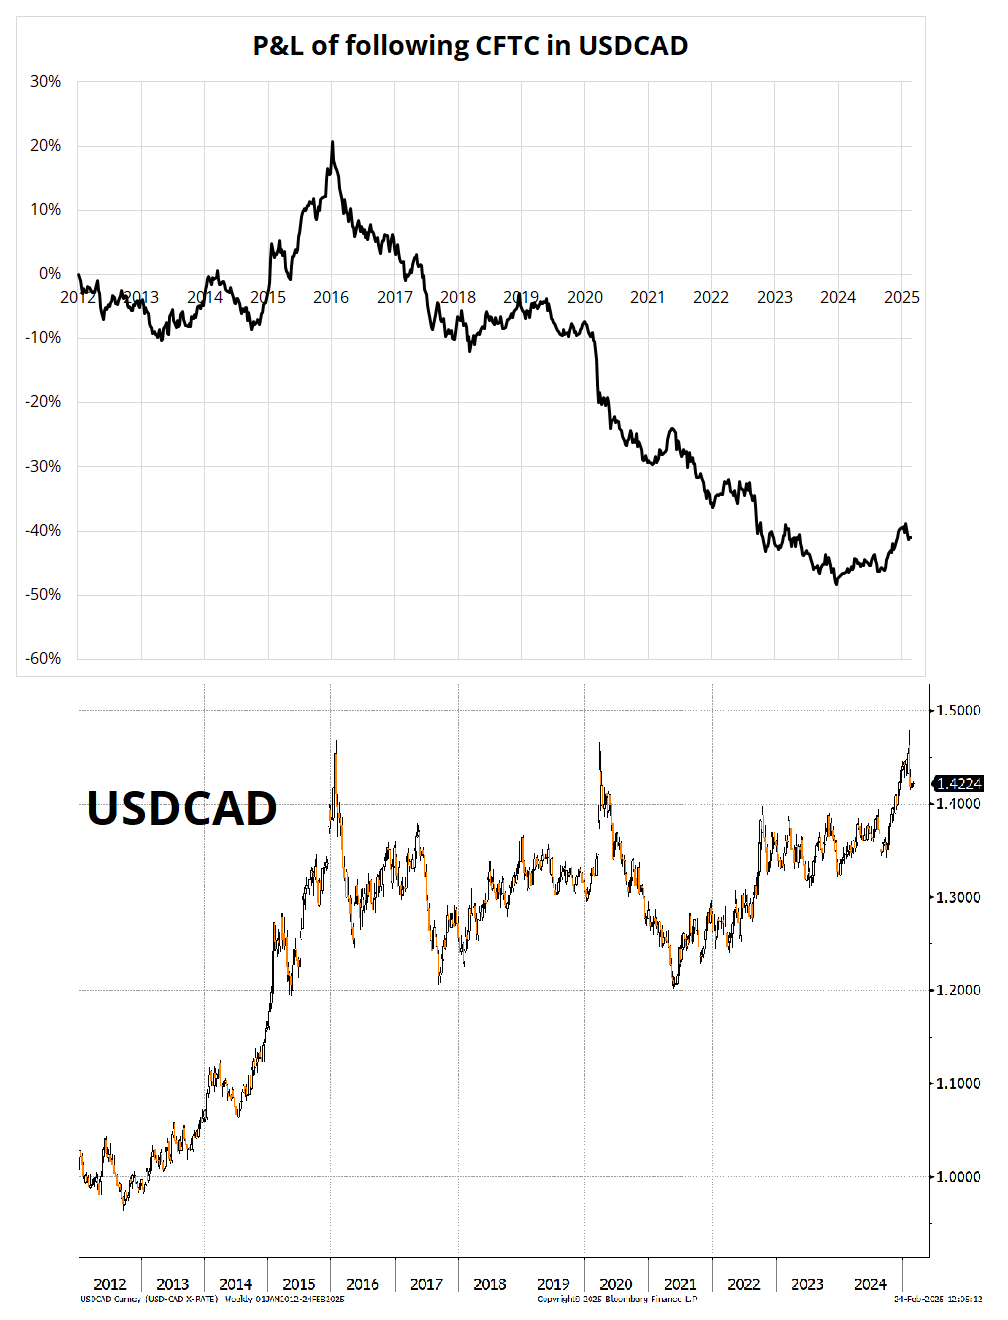
If you look at a few more products, you get the same information. Here’s USDCAD, for example. Yuck. USDCAD has been a chopfest from 2015 to now and therefore fading the CFTC has been profitable (and by association, the chart shows negative P&L because it tracks how you do when you go with the CFTC).
EURUSD, meanwhile has had some decent trends, with the QE-inspired collapse in 2015 offering up significant juice to followers of the CFTC. One weird feature of the EUR data is that the CFTC never switched short EUR during its collapse in 2022 and therefore you can see that despite a pretty good trend lower in 2021/2022, the P&L of the CFTC EUR position was negative. There are sometimes other factors impacting currency positions on the CFTC and this was obviously one of those times. I don’t get what would have been keeping the EUR long stuck in 2021/2022 given the positive carry long USD. But it happens sometimes.

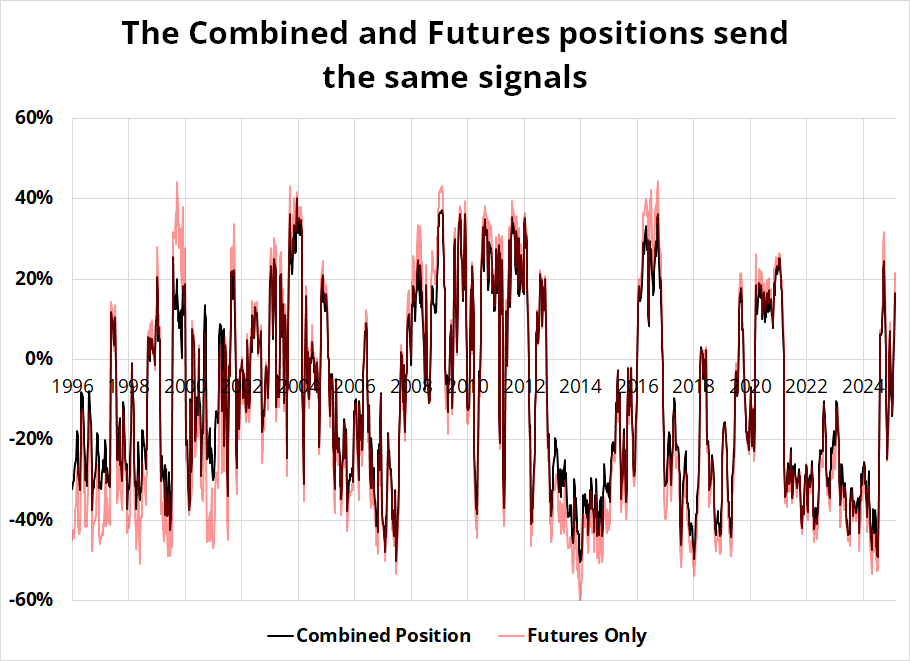
People sometimes ask me if they should use “FUTURES” or “COMBINED” when they are looking at this stuff. The answer is that it doesn’t matter. They’re both the same thing. It is useful to adjust for open interest (which I did in all the charts above), but it doesn’t matter whether you use futures or combined. Here are the two series for JPY, just to give you a sense of the similarity.
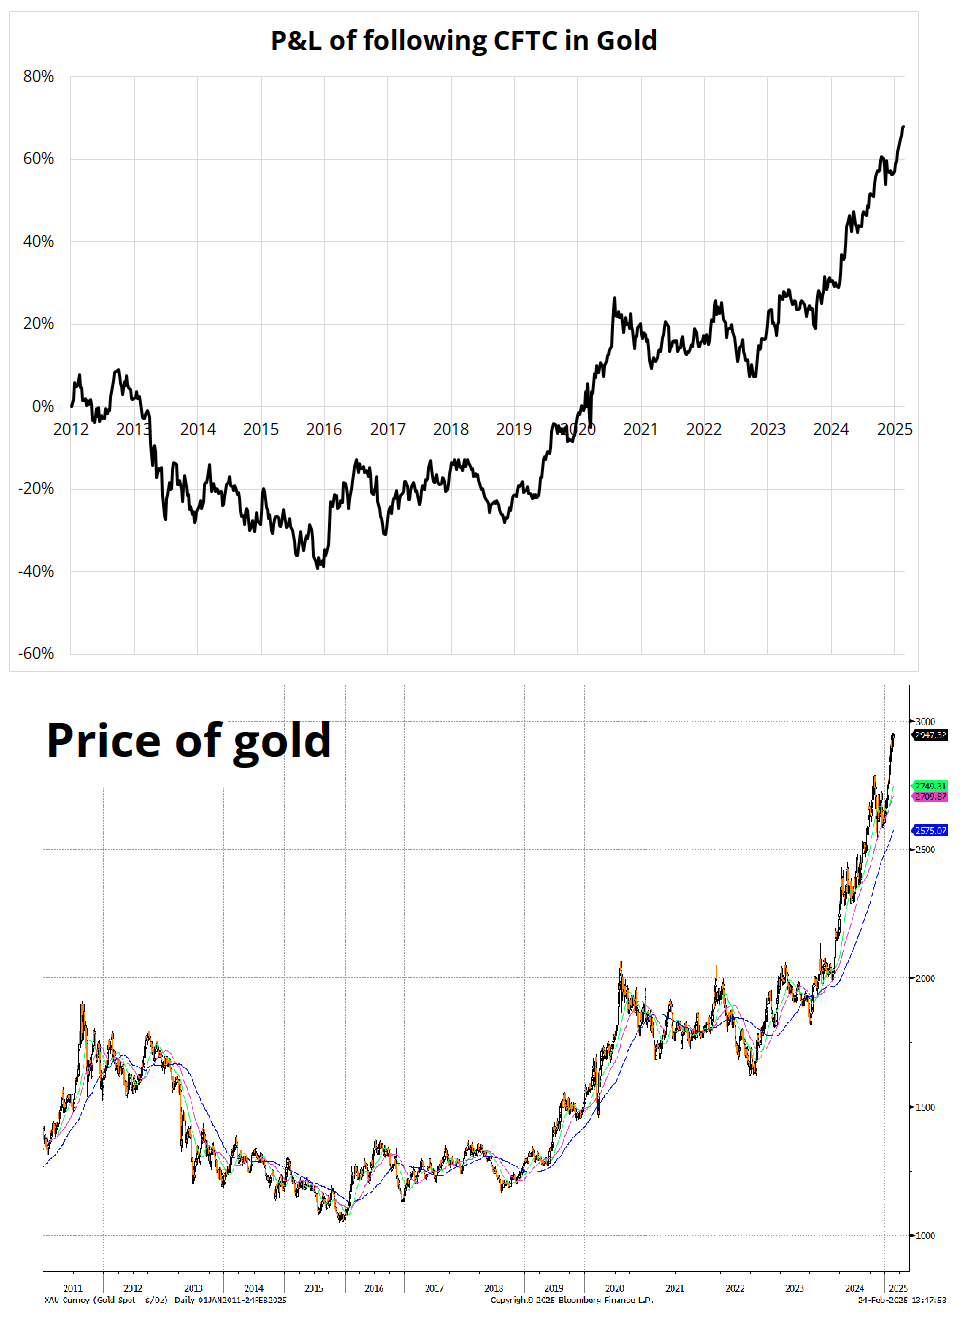
In case you were curious about a non-FX product, here’s gold. You will notice here, that for whatever reason, the CFTC is always long or flat gold and just about never short. Therefore, the P&L of going with the CFTC is simply the P&L of long gold.
You can apply filters to these readouts and get some interesting results at times (for example, 3SD filter to positioning in CAD or GBP tend to be great contrarian indicators) but you need to apply them individually to the product you are interested in and then make an assessment of whether that thing will be trendy or not. CAD and GBP are very often rangebound, whereas gold has obviously been trending for years. Again, long gold is short carry, so I don’t know why CTAs don’t dabble short gold sometimes.
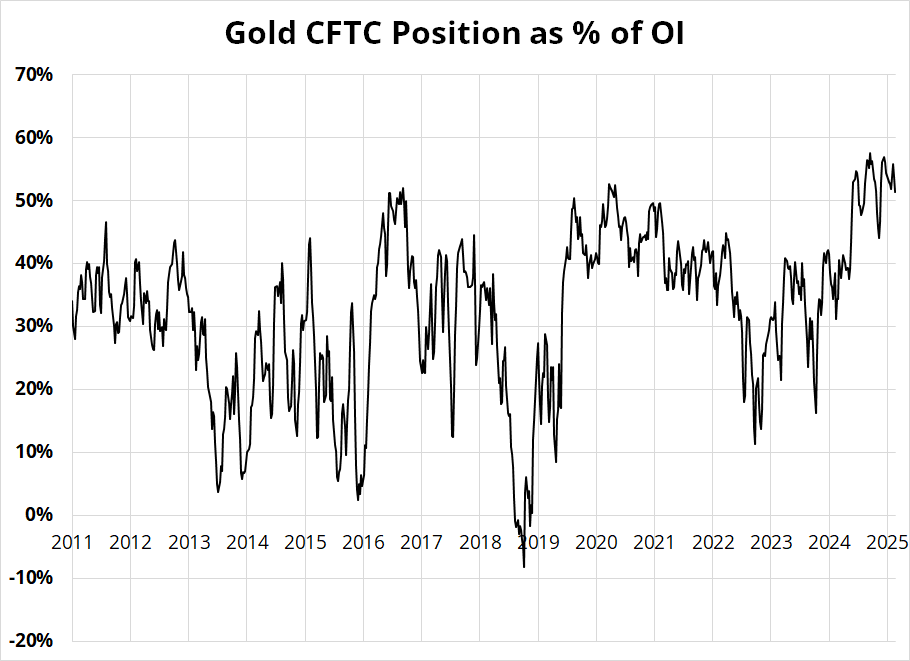
If you’re wondering, the other times CFTC gold positioning was super long like this were fine times to be long gold. As per usual, it wasn’t contrarian. The conclusion here is that CFTC data is only contrarian if you believe you are dealing with a mean reverting series like CAD. If not, it’s generally not, though there are more sophisticated ways of slicing and dicing particular setups that can sometimes yield more contrarian output. Those always have a lot of overfitting risk, of course.

In astronomy, the geocentric model (also known as geocentrism, often exemplified specifically by the Ptolemaic system) is a superseded description of the Universe with Earth at the center. Under most geocentric models, the Sun, Moon, stars, and planets all orbit Earth. The geocentric model was the predominant description of the cosmos in many European ancient civilizations, such as those of Aristotle in Classical Greece and Ptolemy in Roman Egypt, as well as during the Islamic Golden Age.
https://en.wikipedia.org/wiki/Geocentric_model
Not to be confused with the probably-soon-to-be-popular-again flat earth model
