November, 21, 2022
Good news for bonds
Korea Exports came out weak over the weekend, and the much-hyped China reopening story snapped back to reality as the gravity of a single death means COVID won’t give up that easy. Korean exports data is an excellent leading series for the global economic cycle and sends an aggressively different message than the recent optimism on China.
As I have been writing over the past few days, copper, oil, and commodities in general have also been sending a radically different, and more pessimistic message than AUD. Copper continues its spooky steady monotonous downward grind on a perfect 45-degree angle and has now gone from 3.95 to 3.60 in a week. Big move.
In my first chart today, you can see Korea exports and AUDUSD have been following the same rhythm in recent years. If you go further back, the chart is similar, though there’s noise and the series take turns leading. AUDUSD was the leader post-COVID as the Fed put the paddles to the heart of the US economy.
AUDUSD vs. Korea Exports (first 20 days, YoY)
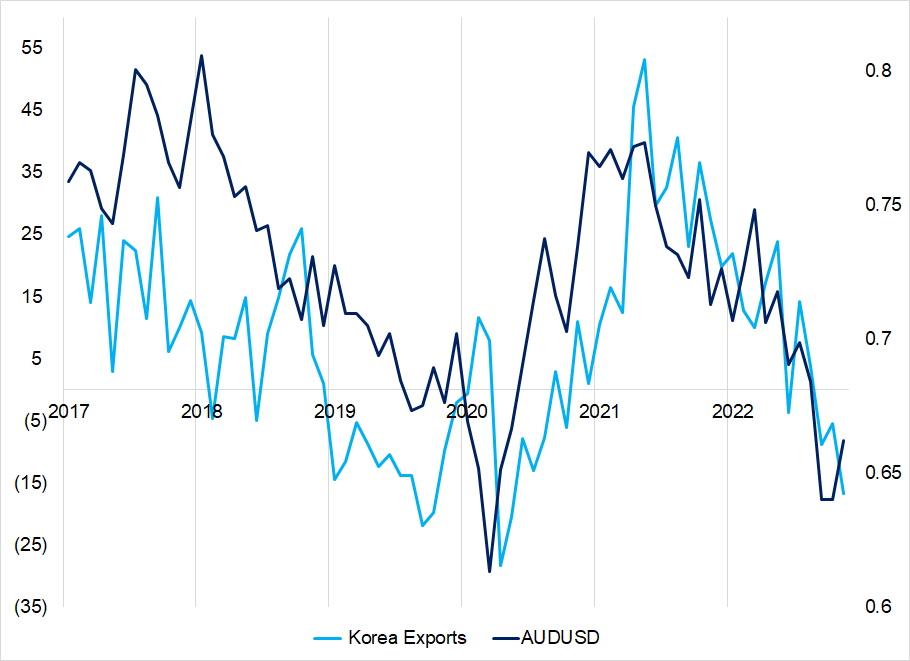
Sometimes when I post a chart of rate of change against a level like that, people get annoyed because it’s not apples and oranges.
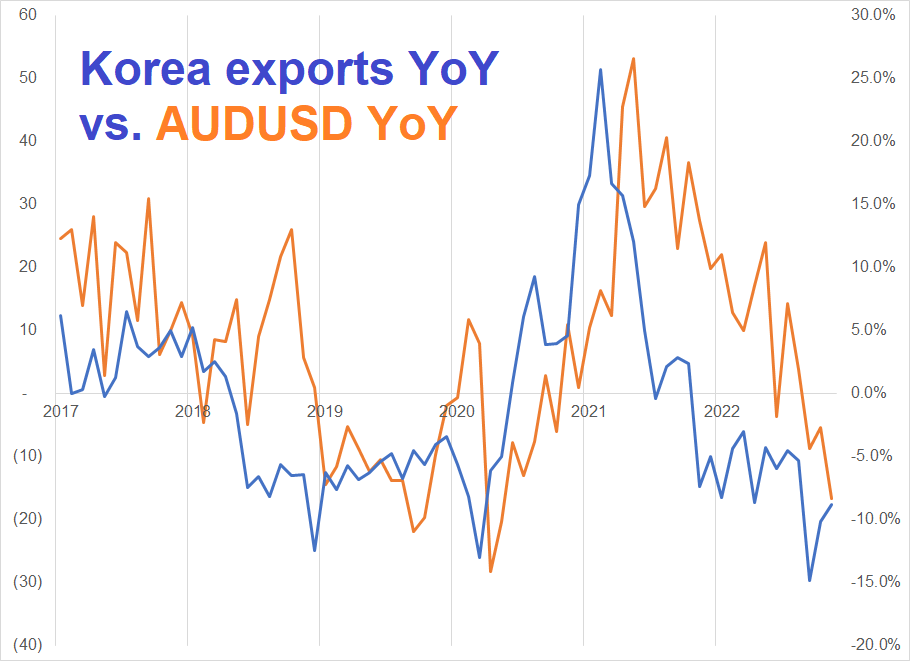
Reality is that it makes no difference, 99% of the time.
Below is YoY change for both. When showing cycles that match, levels and changes show the same thing, generally. Levels vs. changes matters much more when calculating stats and r-squareds etc.
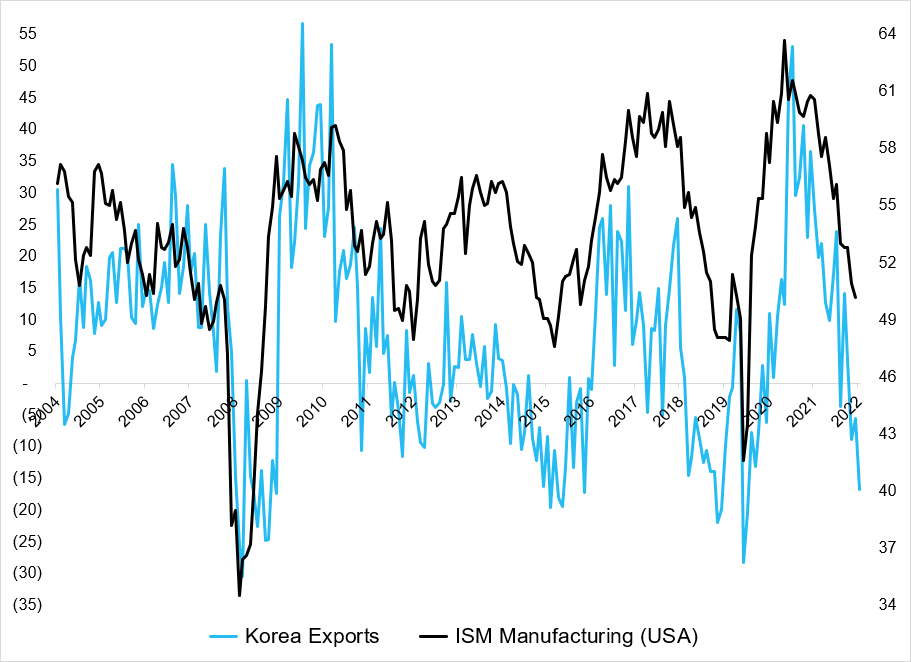
It is worth mentioning that Korean Exports also bounce around roughly in line with US Manufacturing ISM. Here’s a scatter plot. Readings of -15% to -20% tend to appear out of South Korea around the same time as prints in the 47 to 50 range for ISM. Here is a scatterplot and then a line chart of the data.
South Korea Exports YoY vs. ISM Manufacturing (USA)
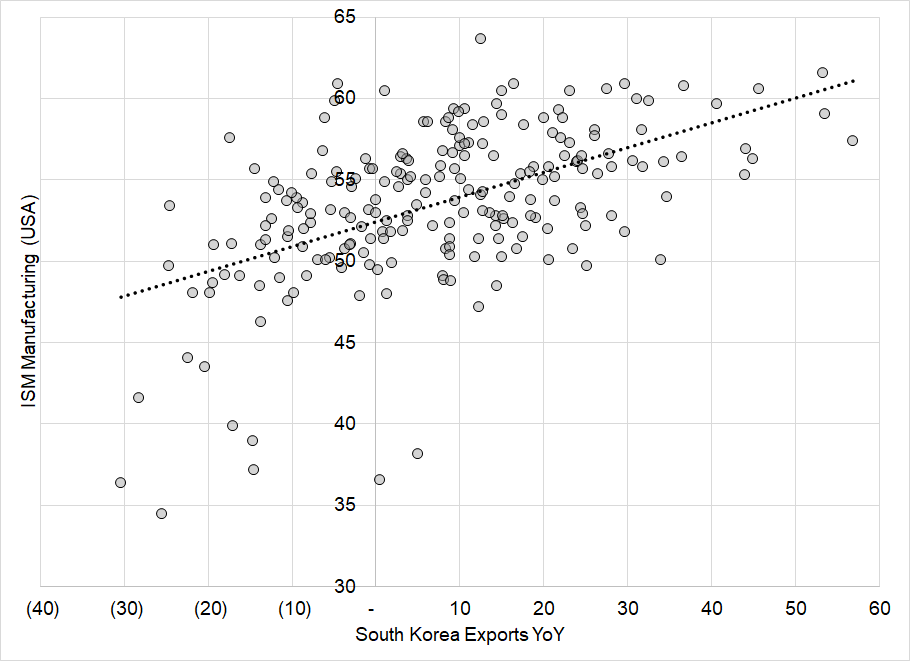
South Korea Exports YoY vs. ISM Manufacturing (USA)
One might have expected US yields to be lower overnight as the Korean Export data is a bad sign for the global economy. Instead, they are trading around flat.
Speaking of bonds
Much time is spent trying to connect inversions in the bond market with future stock market returns. The results are sketchy, at best, because the turn into recession predicted by inversion comes with long and variable lags. Also, the stock market is not the economy, so predicting how stocks will react to a recession is extremely challenging, and impossible if you don’t know the timing of the recession plus or minus 24 months.
On the other hand, it would make much more sense (to me) for bonds to benefit from inversion because while it’s not a recession timing indicator, it’s certainly a flashing yellow light for the economy. I decided to look at bond market returns when 3m/10y is inverted and normal (positively sloped). Hypothesis confirmed. Owning bonds during inversions is nice.
Distribution of 1-day returns in US bond market, conditional on whether 3m/10y is positive or inverted (1994 to now)
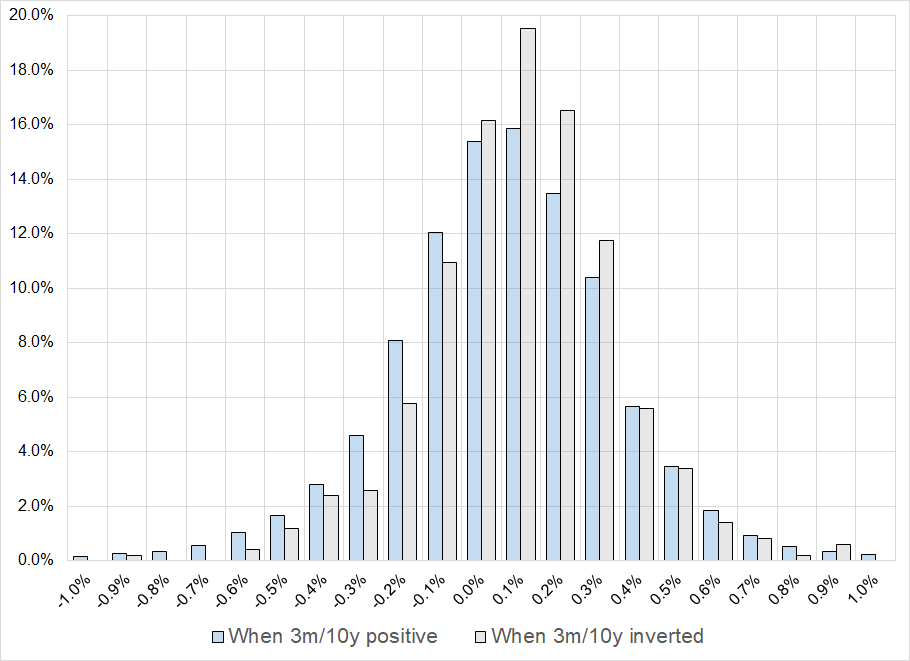
Using total return data for bonds (LUATTRUU Index on Bloomberg)
The sample size is 7199 days, back to January 1, 1994. The sample is split unevenly, of course, with 501 days of inversion and 6698 days where 3m/10y was positive. Average bond market daily return:
When 3m/10y not inverted: 0.1%
When 3m/10y inverted: 0.6%
Bonds went up 60.3% of days when the curve was inverted and 52.9% of days when it was not. This is a huge difference. Median and mean returns are basically the same so there is not some huge skew factor at work. If you are thinking global recession odds are rising as China COVID looks worse and South Korea exports drop, short AUDJPY or CADJPY make sense. If you are looking to enter short cross/JPY or USDJPY as a 2023 trade, this is a compelling entry point.
Round tripping
I am not one to obsess over trades that were good decision/bad outcome but selling EURUSD into the huge horizontal pivot and 200-day MA is definitely one of those. “Stopped out on PPI” is not a common way for a trade to die. Anyhoo! The AUDUSD is working out better, so far, as the currency dutifully tracks the relentless down trend in copper. We are getting near some interesting levels in some markets as the immediate post-CPI levels will be in play soon. For example:
AUDUSD with two tops and the first print post-CPI marked in orange
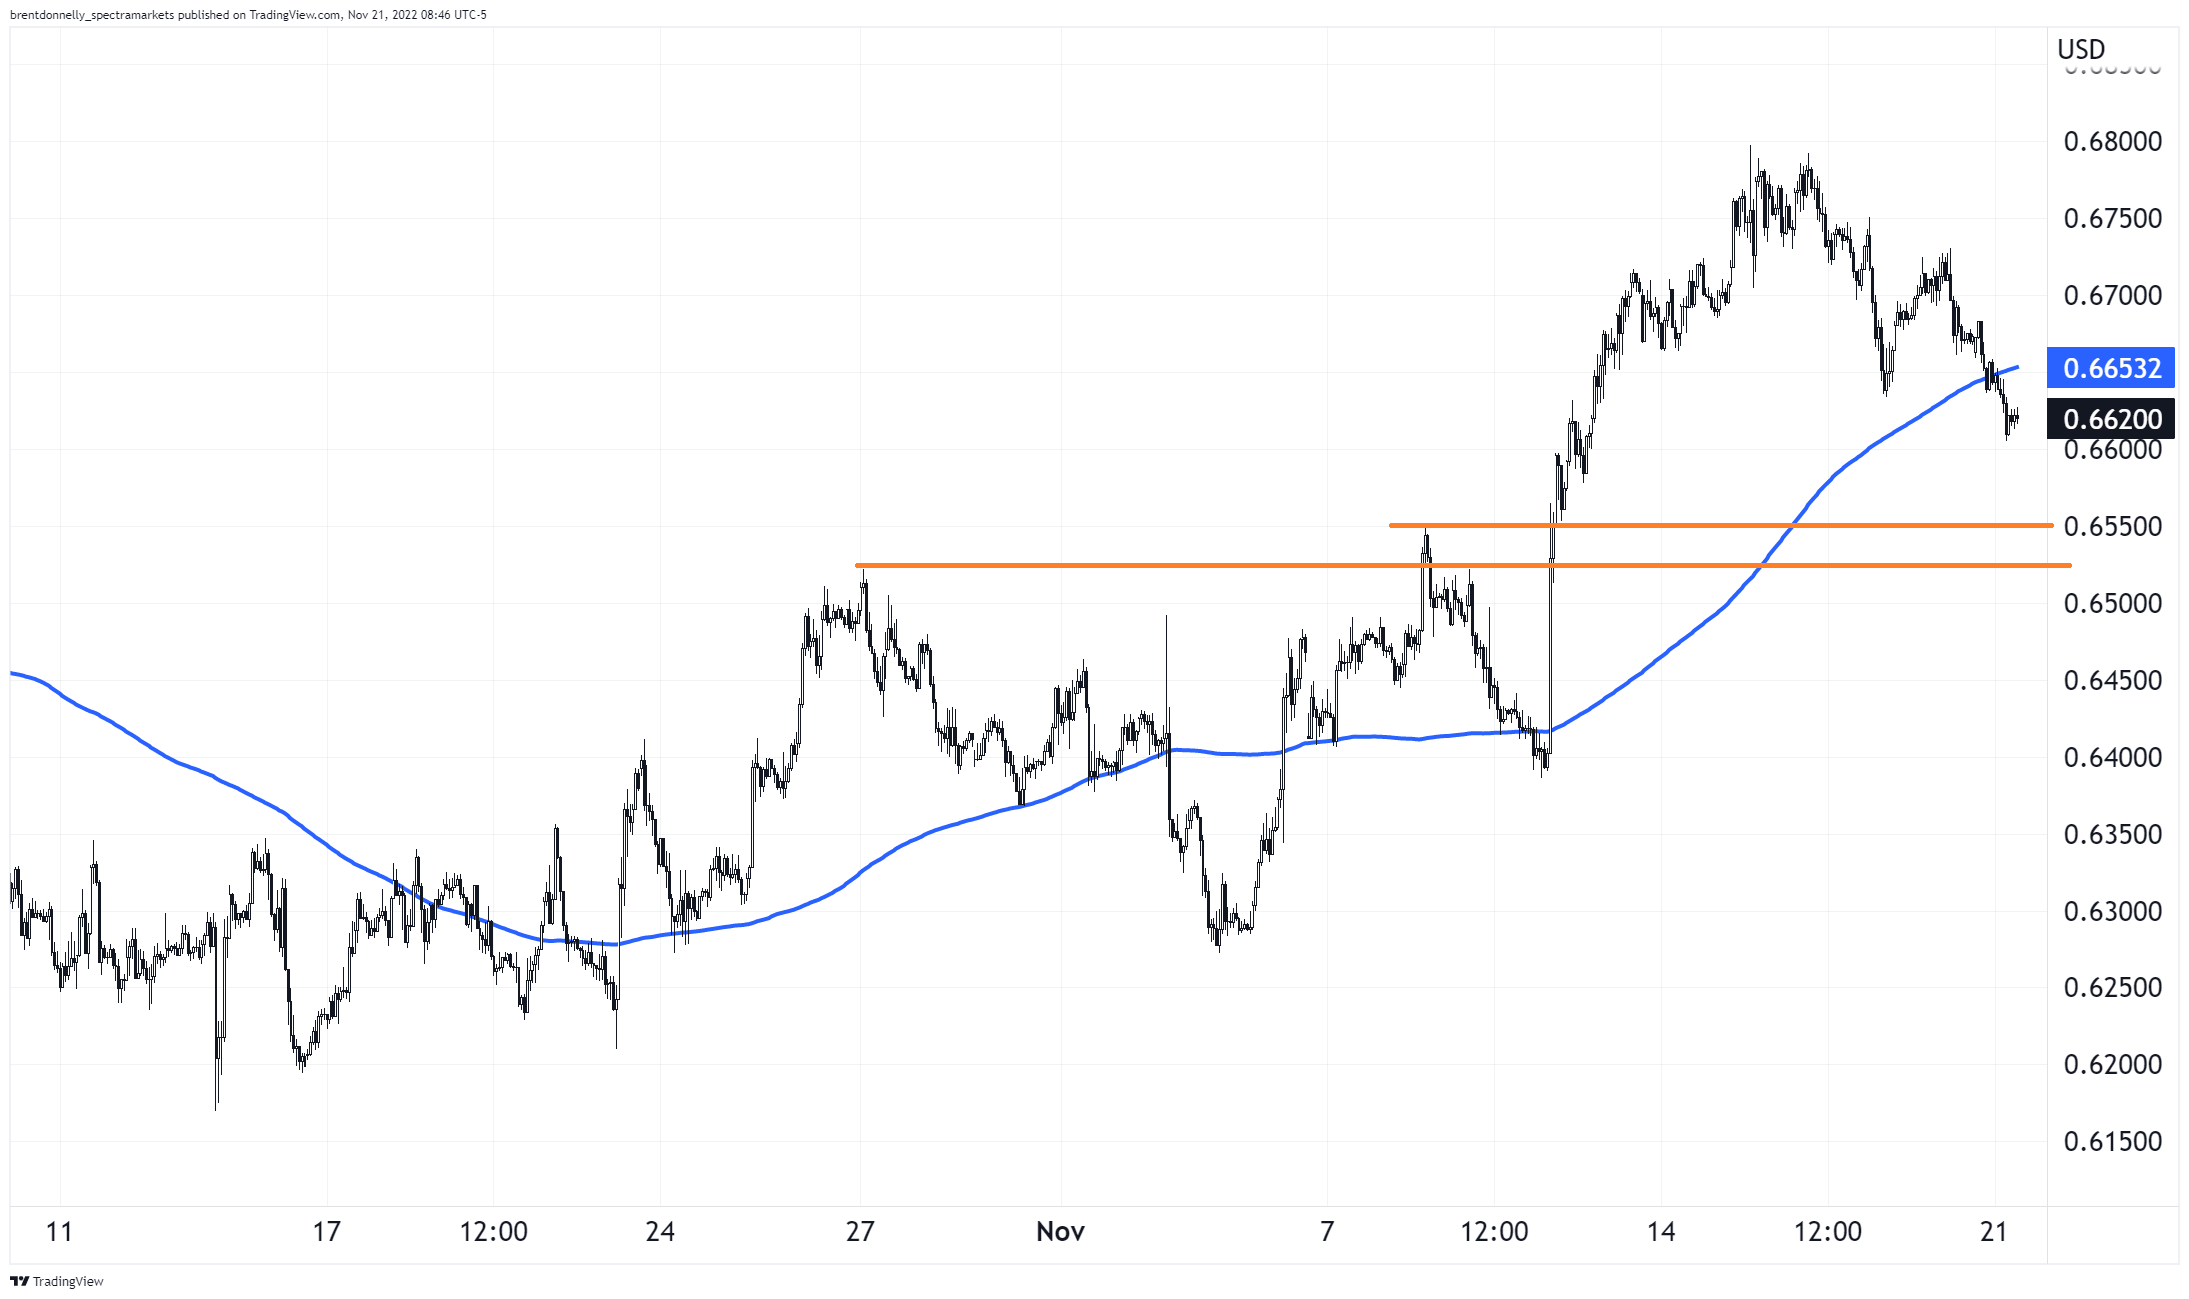
You can see that the old tops are in that 0.6520/50 zone and old resistance becomes support. Also, the first prints after the CPI number was 0.6500/20 so again, that is a huge zone for AUD. That is why I put my TP at 0.6555.
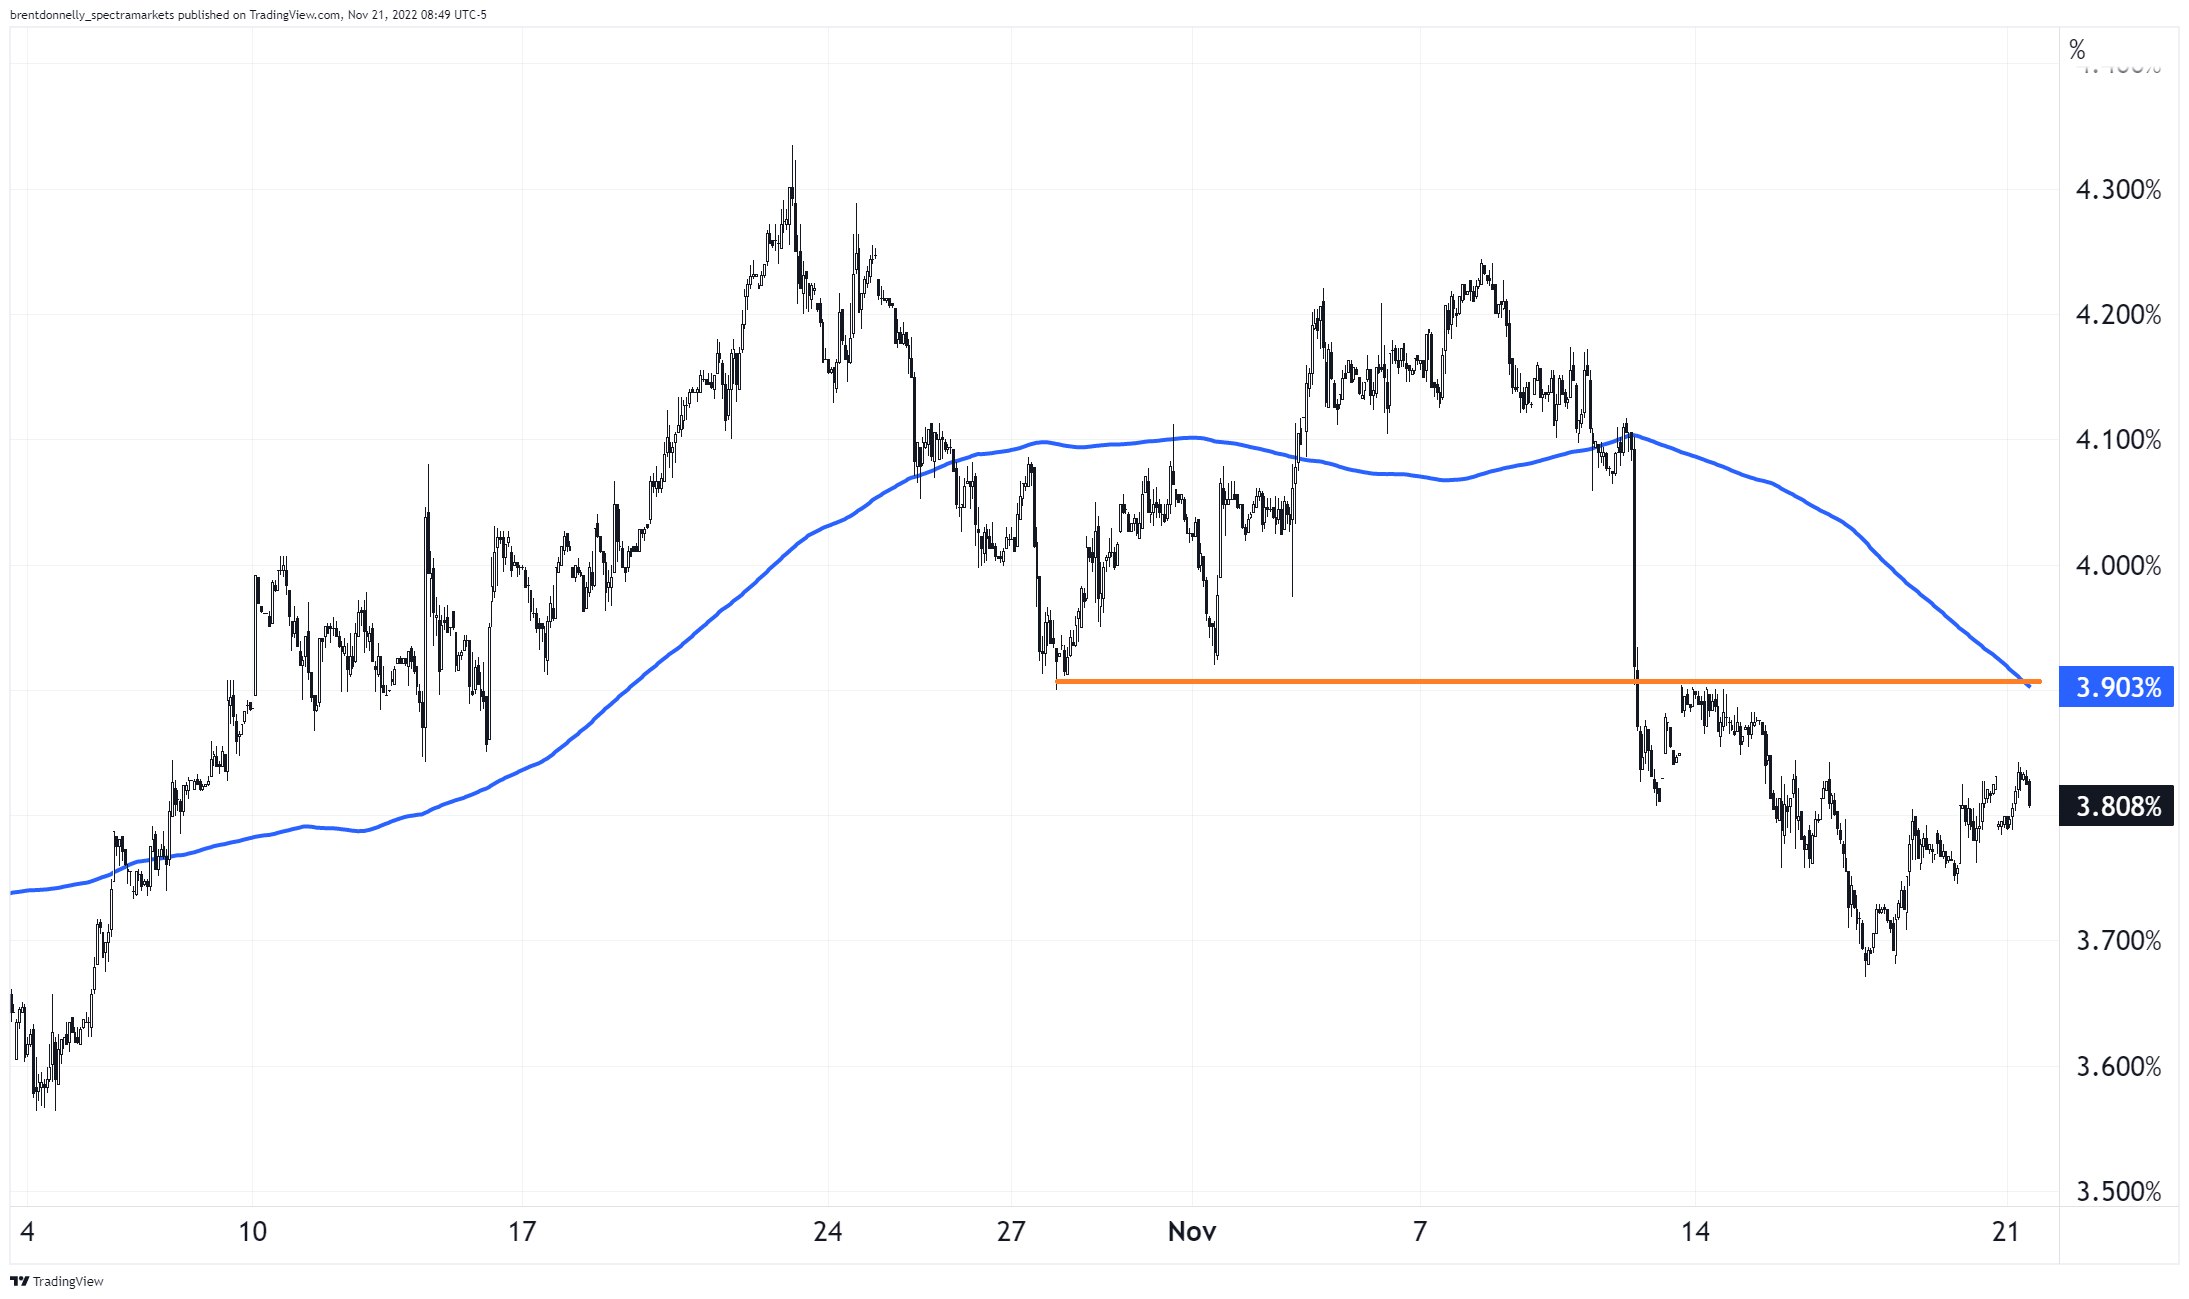
Similar story in US 10-year yields, but flipped of course. You can see in the chart that the old support at 3.90% is now resistance (tested and failed once already). The 200-hour MA is also coming in at that same level. Based on the inversion, the South Korea exports data, and looming pain from lags related to higher rates, long US 10-year looks good, too, with a stop if we take out 4.0%. I’m adding long TY at 112-15 with a stop at 111-15 to my Current Views.
US 10-year yields weak bounce
Final Thoughts
Can AUDUSD go down at the same time as US yields go down? Sure. That wasn’t the way in 2022 but it could be the way going forward if people start worrying about a disinflationary bust.
Have a fancy day.
good luck ⇅ be nimble