Silver, CNH, and a recap and mark to market of the 2025 trade ideas
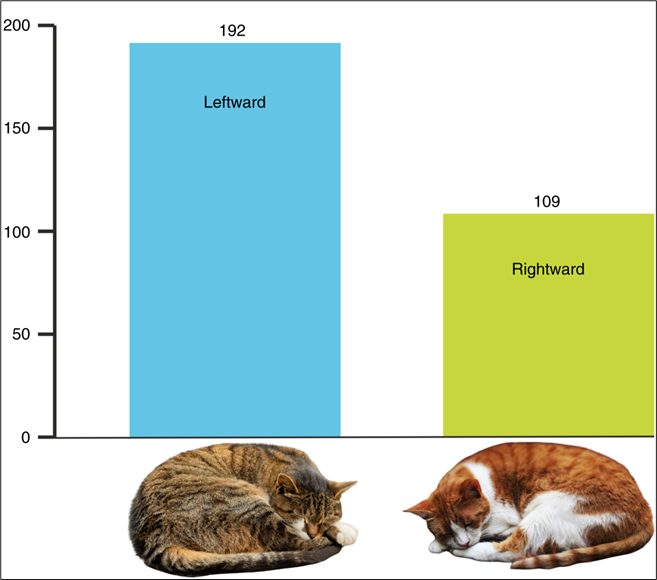
A real graphic from a real scientific paper.

Silver, CNH, and a recap and mark to market of the 2025 trade ideas
A real graphic from a real scientific paper.
02JAN26 EURSEK 10.87 put
25bps off 10.92 spot
Covered half at 10.8050/8150
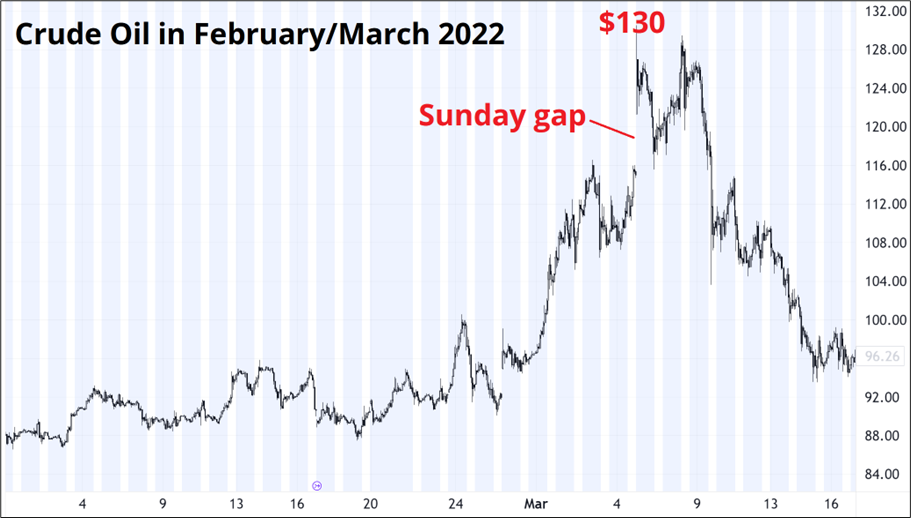
Silver. Is the Sunday Gap high at $84 the high? Sunday gaps can often be mega turning points. Think of oil on March 6, 2022 after Russia went into Ukraine. It traded $130 that Sunday night, retested a few days later, and never traded higher… Ever again.
Or the Sunday gap in USDCAD after the tariffs this February.
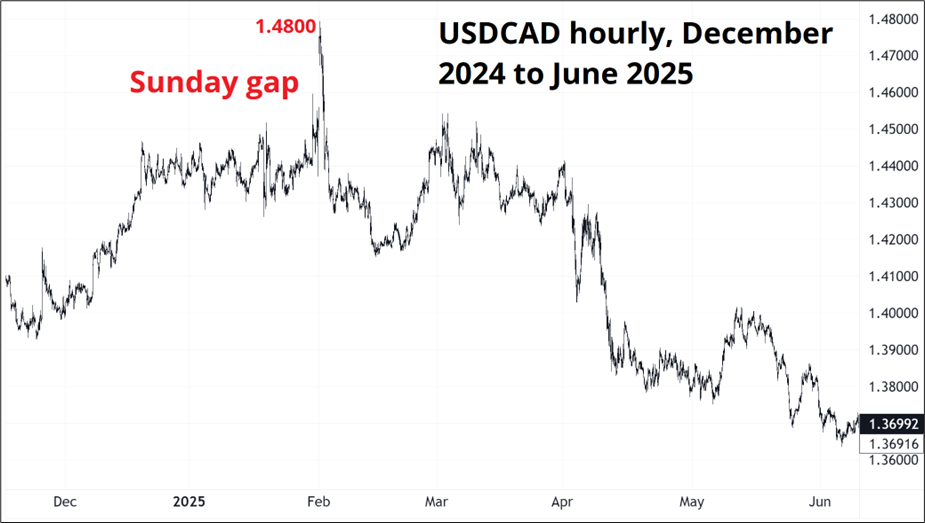
I am not cherry picking. Long-time readers know that I have done many studies of Sunday gaps and they are much more often reversal points, not acceleration zones. The Takaichi Sunday gap in USDJPY (149) is a rare exception that is worth noting. USDJPY has still not traded below its opening price on the Sunday after Takaichi won. As long as silver is below $85, I am bearish.
USDCNH. I took off the USDCNH put fly yesterday, but USDCNH continues to motor lower. This is mildly interesting considering:
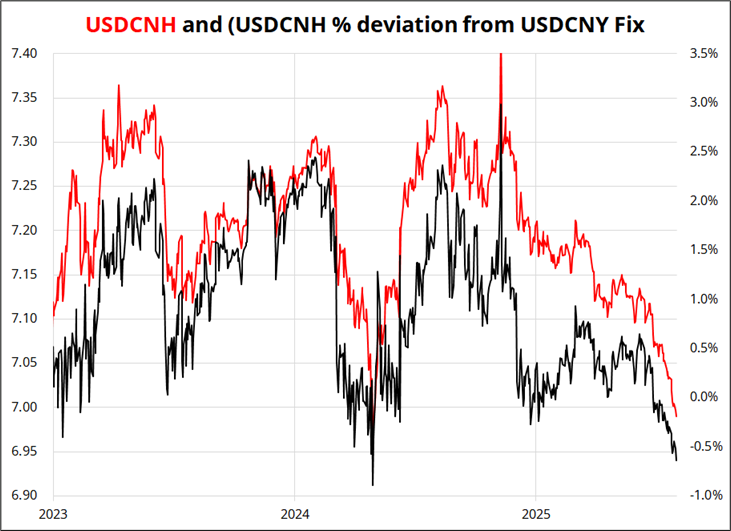
The black line is the difference between USDCNH and the CNY fix (right y-axis) and the red line is USDCNH. So either we are in a new regime, where the PBoC is going to let the yuan appreciate faster, or we are at the bottom of the 2-year tolerance zone and this is the time and place to expect a reversal. I was in the CNH appreciation camp for the last month for reasons that have been outlined by many strategists (trade surplus is getting too big, creating imbalance risk) but the PBoC commentary (“We do not want an overshoot”) scared me off. If we are in a different regime, I would not expect the PBoC to be pushing back and I would not expect them to be fixing higher (as they did last night).
I will be sad to miss a CNH appreciation trend, but at 6.99 the risk/reward on long CNH looks poor to me unless you think EURUSD is about to take out 1.1850. Which I don’t. The biggest risk now to the bull case is not a massive spike higher but a boring continuation of the quasi-peg regime and theta bleed over January and February.
Today is my trade ideas recap for 2025. On October 24th, 2017, I wrote the following after reading Philip Tetlock’s excellent book Superforecasting:
One of Tetlock’s big beefs, which is a pet peeve of mine too, is the litany of forecasts that stream daily on CNBC, Bloomberg and the internet without any scrutiny or follow-up. Specifically, the relentless stream of “Crash Imminent” predictions is a complete joke. These inaccurate, one-way forecasters are not called out, they are instead deified as “the famed economist who correctly predicted the collapse of 2000 and 2008” etc.
Most analysts that get credit like this predict a crash every year or two and then claim credit in the very few years their call is right. There is no verification (and many forecasts are so open-ended they are impossible to verify) so anyone can make any prediction and it is more important how famous they are, not how accurate they are. I don’t mean to pick on a specific website or forecaster—As an industry, Wall Street is simply terrible at following up on the flood of forecasts we make every day.
It is pretty weird how we don’t even have much data on who is good at forecasting the main US economic data, when this is easily verifiable with a bit of work. Anyone know the Brier Score of the top 10 forecasters of US economic data? Is their forecasting skill persistent? There are many reasons not to follow up on forecasts but most of them suit the forecaster not the users of the forecast.
For example, people sometimes ask me to publish my trade idea outcomes. I hesitate for four reasons:
The thing is, though, after reading Superforecasting I feel it’s lame and disingenuous to make forecasts and then not follow up. So, I will collect and publish my trade idea results. Caveats: My real-world trading P&L can differ dramatically from the P&L of the “Current Views”. Also: I cannot guarantee the accuracy of the data (though I present it, in full and I’m pretty sure it’s accurate). Past performance does not guarantee future results. Ask your doctor if am/FX is right for you.
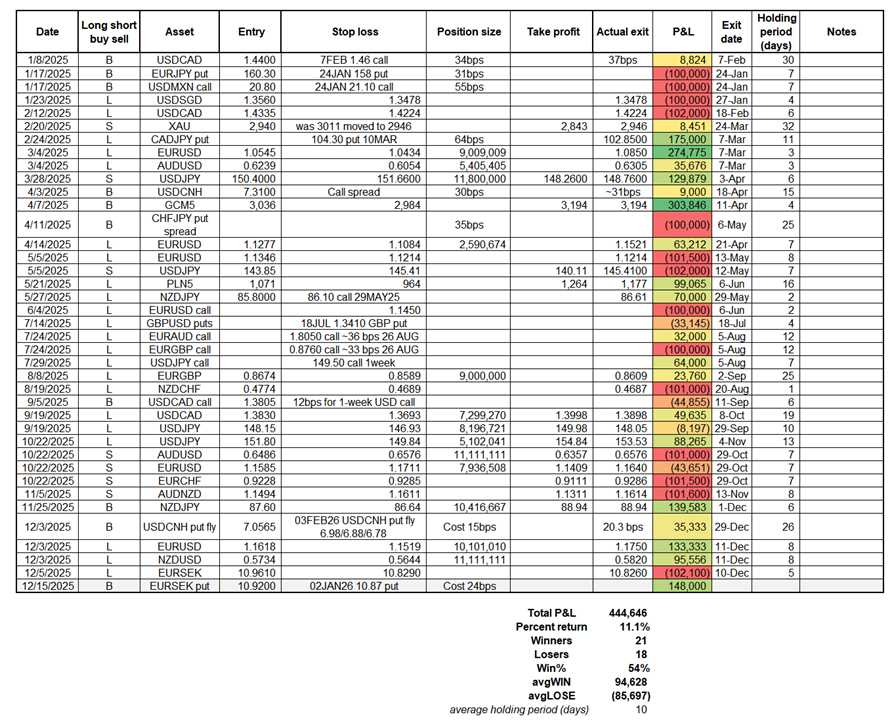
Next, you will find a detailed sheet that shows my trade ideas this year. They are all marked to market at the time I hit send on the email. In order for the trades to be comparable, I assume a portfolio with a $4m stop loss that risks $100,000 on each trade (2.5% of free capital).
The $ amounts are not the point; the point is to normalize the trades because reporting raw % returns on trades makes no sense. What makes sense is to normalize risk based on how wide the stop loss is. Tighter stops = bigger positions and vice versa. So, to be clear: I risk $100,000 on each trade, backing out the position size from the difference between the entry point and the stop loss. This is all fully explained in Chapter 11 of Alpha Trader. The main point of this results exercise is: transparency and accountability.
Takeaways
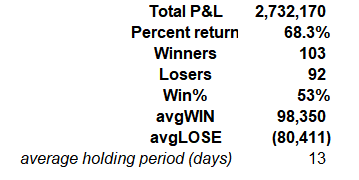
This year was OK but there were long stretches of low and falling FX vol and no USD theme. The data going all the way back to 2017 confirms what I would have guessed: One of my bigger edges is catching the turns in the dollar. When there is no coherent USD theme, it’s harder for me to make money.
I find it amazing how consistently my win rate stays between 51% and 55%. This has been true now for almost 20 years since I first started keeping stats in 2006. The only time I got meaningfully above 50% were years when I had a juicy market making book that provided an annuity.
Looking back at the full four-and-a-bit years of data since I started here at Spectra in September 2021, the directional USD, metals, and equity trades were by far the best. EURUSD had the best P&L of all products (about 30% of the total) and ES, GBPUSD, NZDUSD were next. In the basement were EURCHF, USDMXN, and CADJPY.
Full results back to September 2021:
The days are getting longer in the Northern Hemisphere.
From “Lateralized Sleeping Position in Domestic Cats” by Isparta, Ocklenburg, et al.
Summary
Both vertebrates and invertebrates show a multitude of left–right asymmetries of brains and behaviors1. For example, cats, dogs, and many other species have a preferred paw when handling food. But why should humans and other animals have lateralized brains? Based on a large comparative approach1, it is likely that asymmetries serve several purposes. First, by specializing on one limb or one side of its sensory system, the contralateral hemisphere goes through life-long cycles of motor and perceptual learning, thereby increasing the speed of processing and motor efficacy, decreasing reaction time, and enhancing discrimination ability. Second, by having two complementary, specialized hemispheres, neural processes are computed in parallel, thereby reducing cognitive redundancy. For example, the right hemisphere excels in processing threat-related stimuli, providing the left visual field an advantage in reacting to a predator approaching from the left. Here, we report that two-thirds of cats prefer a leftward sleeping position, giving their left visual field and thus their right brain half a privileged view of approaching animals without being obstructed by their own body.
And… They summarize the paper in a nice piano-backed video. SCIENCE!
https://www.cell.com/current-biology/fulltext/S0960-9822(25)00507-X
VIA KENT HENDRICKS


A sort of almost unbelievably large move in Brazil. Plus: Short CADJPY.