FX is moving a bit in reaction to higher vol and lower stocks. Today I cover an interesting study on EMH, and the epic short position in corn.
Push and Pull
It was a week of crosscurrents and contradiction

FX is moving a bit in reaction to higher vol and lower stocks. Today I cover an interesting study on EMH, and the epic short position in corn.


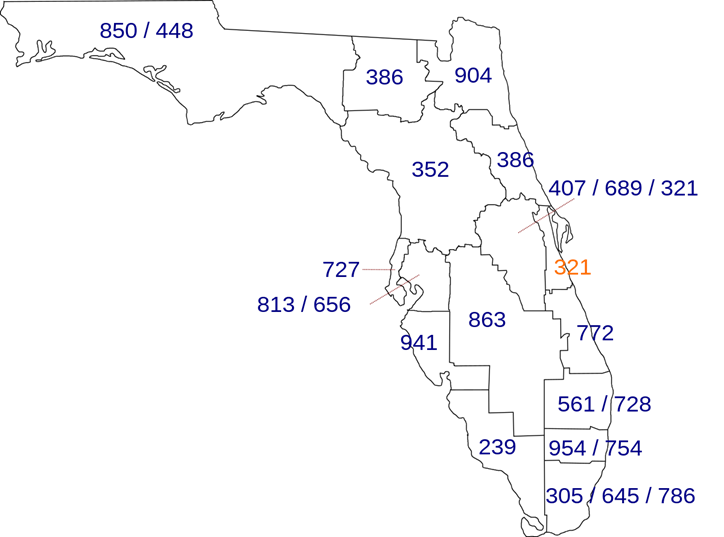
The area code for Cape Canaveral makes sense!
Flat
I remember in early 2000, a smart friend of mine who works at a consulting firm called me and said: “You gotta buy Oracle. Every single one of my clients is buying their products like crazy! Amazing company!” That was the thesis. Good company, buy the stock. Most people in financial markets will recognize this kind of statement as being wildly first derivative because the caller had no idea where the stock was trading, what the price/sales was, or anything. People back then quoted Peter Lynch’s: “Invest in what you know” as if that was the sole criteria he used to evaluate investments. It wasn’t.
Anyway, you know what happened to Oracle stock afterwards. Now, smart people are starting to wonder if AI can actually make money and peak optimism on NVDA may be here. But that’s not why I bring up the Oracle story. I mention it because of a paper called: “Mental Models of the Stock Market” which shows how most retail investors do not understand the concept of “priced in”.
Verdad, a publication I am not familiar with, published a good summary of the paper here. The full PDF of the paper is here. Here is the abstract:
Investors’ return expectations are pivotal in stock markets, but the reasoning behind these expectations remains a black box for economists. This paper sheds light on economic agents’ mental models – their subjective understanding – of the stock market. We conduct surveys with the general population, retail investors, financial professionals, and academic experts. Respondents forecast and explain how future returns respond to stale news about the future earnings streams of companies.
We document four main results. First, while academic experts view stale news as irrelevant, households and professionals often believe that stale good news leads to persistently higher expected future returns. Second, while academic experts refer to market efficiency to explain their forecasts, households and many professionals directly equate higher future earnings with higher future returns, neglecting the offsetting effect of endogenous price adjustments.
Third, additional experiments with households demonstrate that this neglect of equilibrium pricing does not reflect inattention to trading or price responses but rather a gap in respondents’ mental models: they are unfamiliar with the concept of equilibrium. Lastly, we illustrate the consequences of equilibrium neglect. We use panel data on household expectations to show that equilibrium neglect predicts previously documented belief anomalies such as return extrapolation and pro-cyclicality.
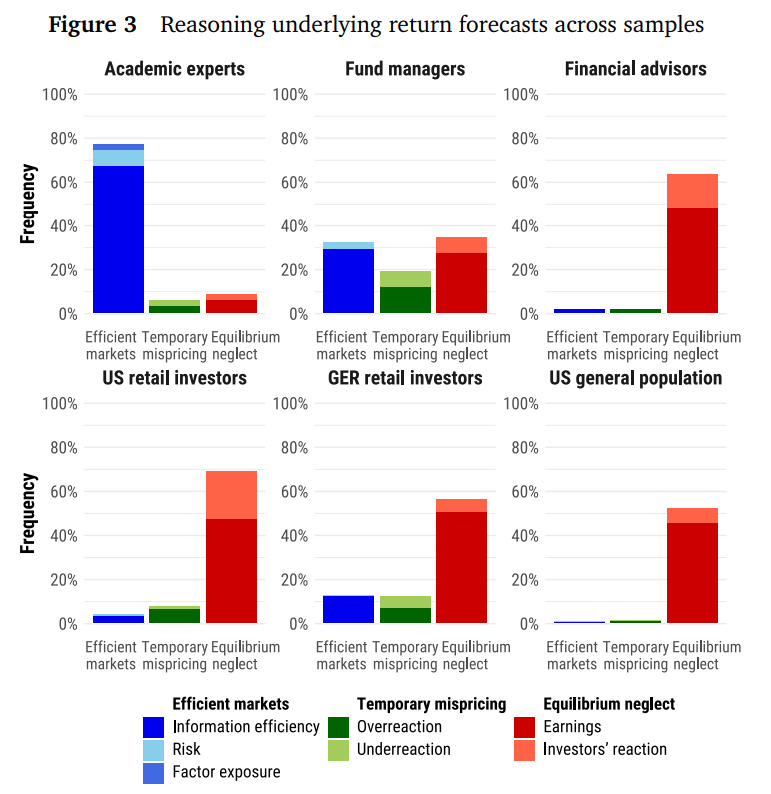
This big red, green, and blue chart summarizes the findings of the paper. The chart shows six investor segments. Blue bars indicate the proportion surveyed who believe that 4-week-old news about a company is meaningless for the future price of the stock. Green bars are people that think 4-week-old good news is now bearish (mean reversion theory). Red bars indicate the proportion that believe 4-week-old good news would still be a reason to buy the stock today. The sea of red probably explains some of the momentum factor in stock markets.

Given that momentum is a real thing in many markets, retail investors who assume 4-week-old information still matters for stock prices going forward are perhaps not totally wrong! But they are probably more wrong than right. While fund managers do OK on this test, financial advisors are just as bad as retail investors and don’t seem to understand the idea of equilibrium or “priced in”.
I do not think that these people in the red bars are actively taking the view that EMH is not valid. They are just using first derivative thinking.
The entire paper is interesting and if you don’t have any big weekend plans, the bibliography offers many other worthwhile papers.
Thanks to Chuck for sending!
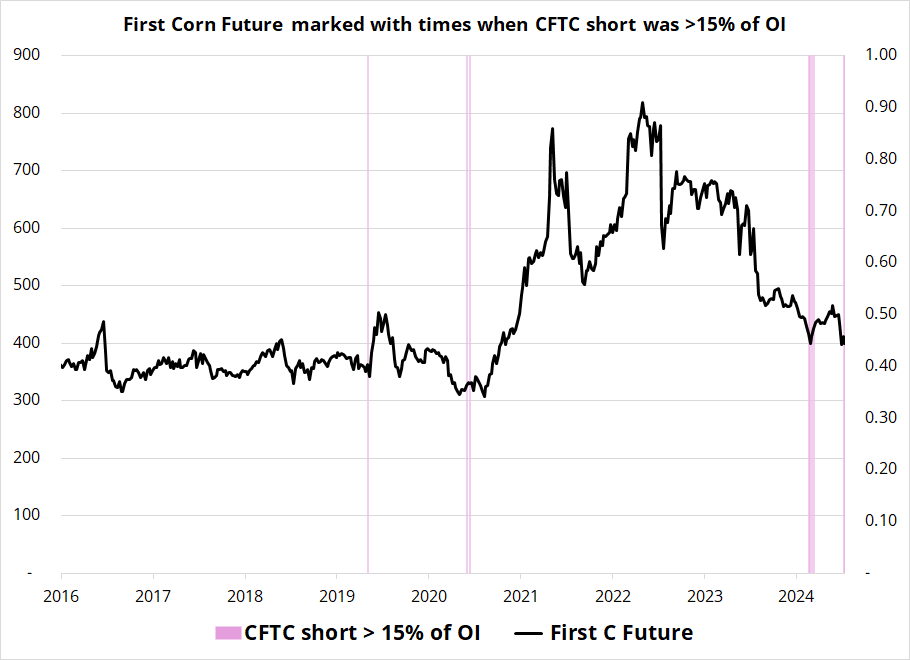
I don’t love to use positioning on its own as an indicator, but it can be a great timing and leverage tool in conjunction with a good thesis. The most powerful positioning indicator is when positioning in something gets to a mega, mega extreme. That is currently the case with corn futures, where the short is greater than 15% of open interest, a condition rarely seen since 2007. The chart I am about to present only goes back to 2016 because there were zero occurrences of this setup in the data from 2007 to 2016.
A problem intrinsic to searching for rare positioning events is that your sample size is going to be small, by definition. One offset to this problem is that I have found this sort of approach works well across many assets and so the sample isn’t as small as it looks. It works in other stuff, not just corn.
Anyway, here’s corn:

There are three non-overlapping signals if you use a 3-month holding period and the signal is 3-for-3 with average 3-month returns of 8.3% and a median return of 8.6%. We now have signal number four. There are no currencies correlated to corn. You just have to buy corn. Or not buy corn.
USDJPY is lower on a combination of higher VIX, lower NASDAQ, and lower global yields. Yields on their own don’t seem to be enough to take down Goliath, but mild risk aversion has now entered the chat. Have a 🚀 day.

HT Yelvz
It was a week of crosscurrents and contradiction

The risk reversal is a bit of a yellow flag in euro, even though I don’t want to believe it
