Unless you think this is 1937 or 2008, stocks look set to rally into midterms.
– Demetri Martin

Unless you think this is 1937 or 2008, stocks look set to rally into midterms.
– Demetri Martin
Spot ref. 5.1850 on 10OCT22
Expires 11JAN23
October 14, 2022
It’s been quite the 24 hours as the market went into CPI long USD and short stocks, doubled down at 3500/3540 in S&P, then covered furiously as earnings, TSMC news, a UK pivot, a huge gamma buy in S&P futures, and extreme bearishness created an equity move rarely seen.
SPX down more than 2% from the open followed by a close up >2% or more has only happened 11 times since 1980. Here they are from 1997:
Let’s call this down 2%, up 2% thing “D2U2”. It is mostly a bear market phenomenon, naturally, because vol is higher in bear markets. Here are the returns after it happens:
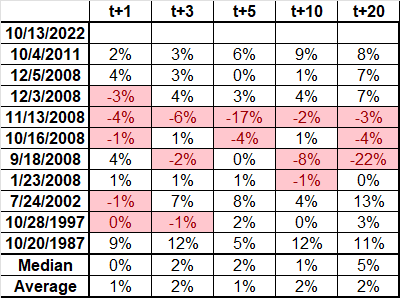
That 20-day forward median return of 5% is excellent; the 20-day median return for the entire sample is 1.3%. You need to manage a ton of volatility, though. You can see from the table that 2008 was a very special time!
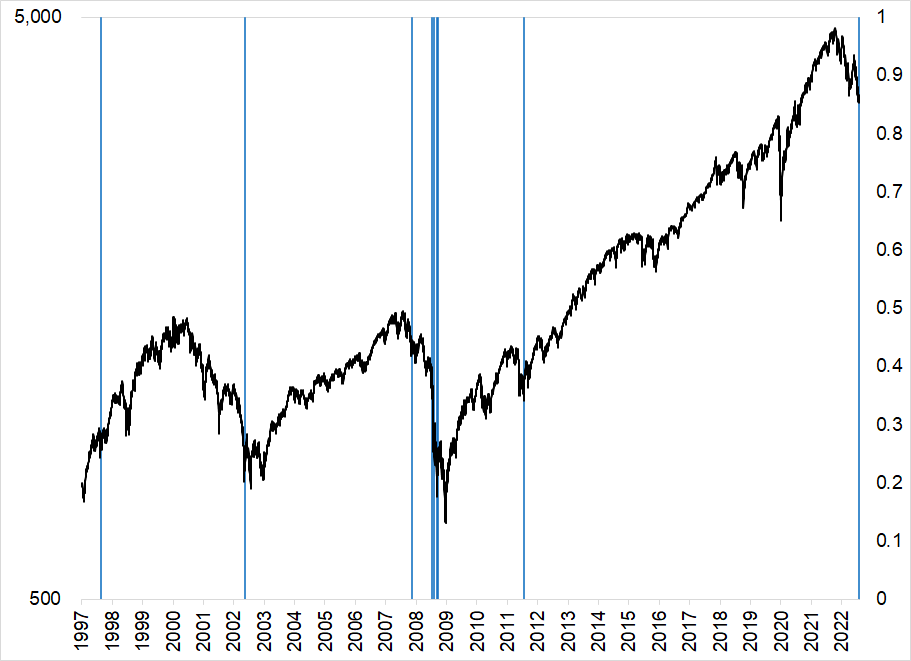
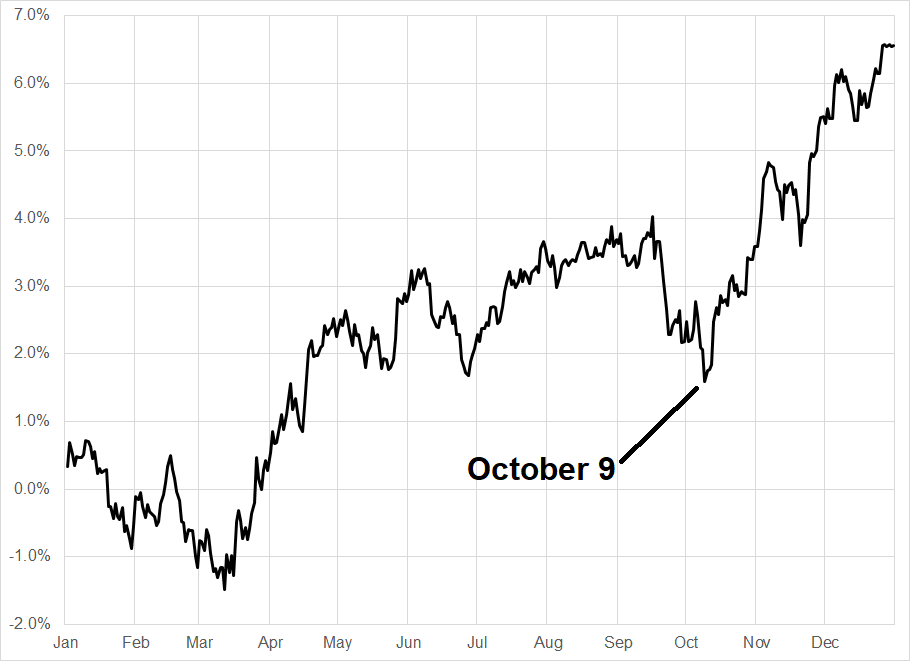
Yesterday’s Speed Queen rinse-o-rama in stocks also coincides closely with the seasonal low date for equities:
Don’t you wish you had some sort of Spectra Markets Trader Handbook and Almanac that would advise you of these important seasonals, in real-time, while also offering trading tips and plenty of space to write down your daily plans and goals? You will soon! We are finishing it up now and it should be on Amazon in a week or so.
Given the horrendous start to the year in stocks, I was curious what other horrendous years looked like going into the end of the year. I filtered by January to September performance, ranked the years, then found the worst five years and looked at what they did from October 1 to December 31. Here is the chart:
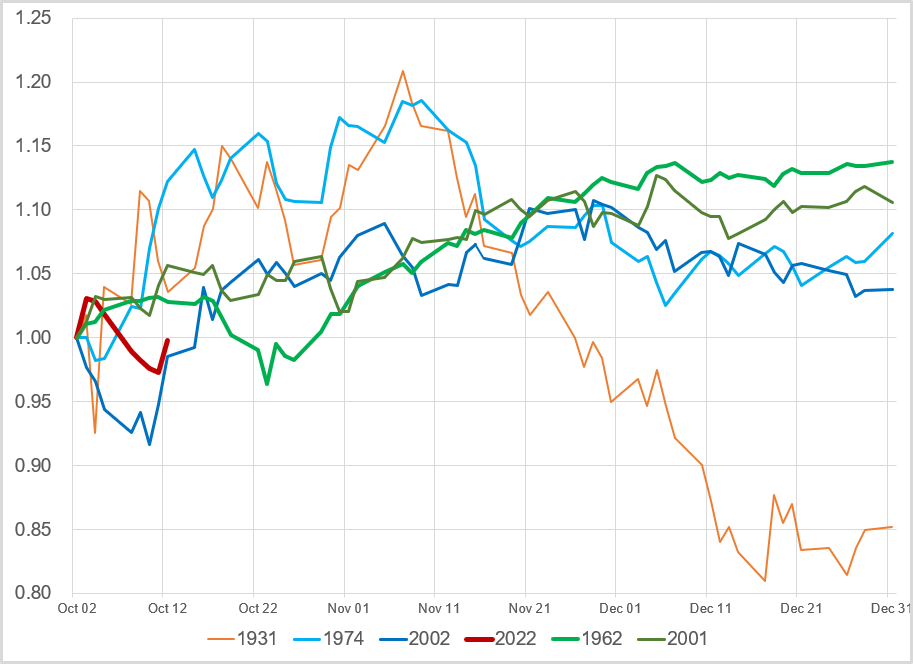
Indexed to: October 1 = 1.0
Very good performance into mid-November, which confirms the D2U2 scan. Bullish. Then, I thought… A sample size of five is pretty small. What if we look at the worst 10 years? Here’s the chart:
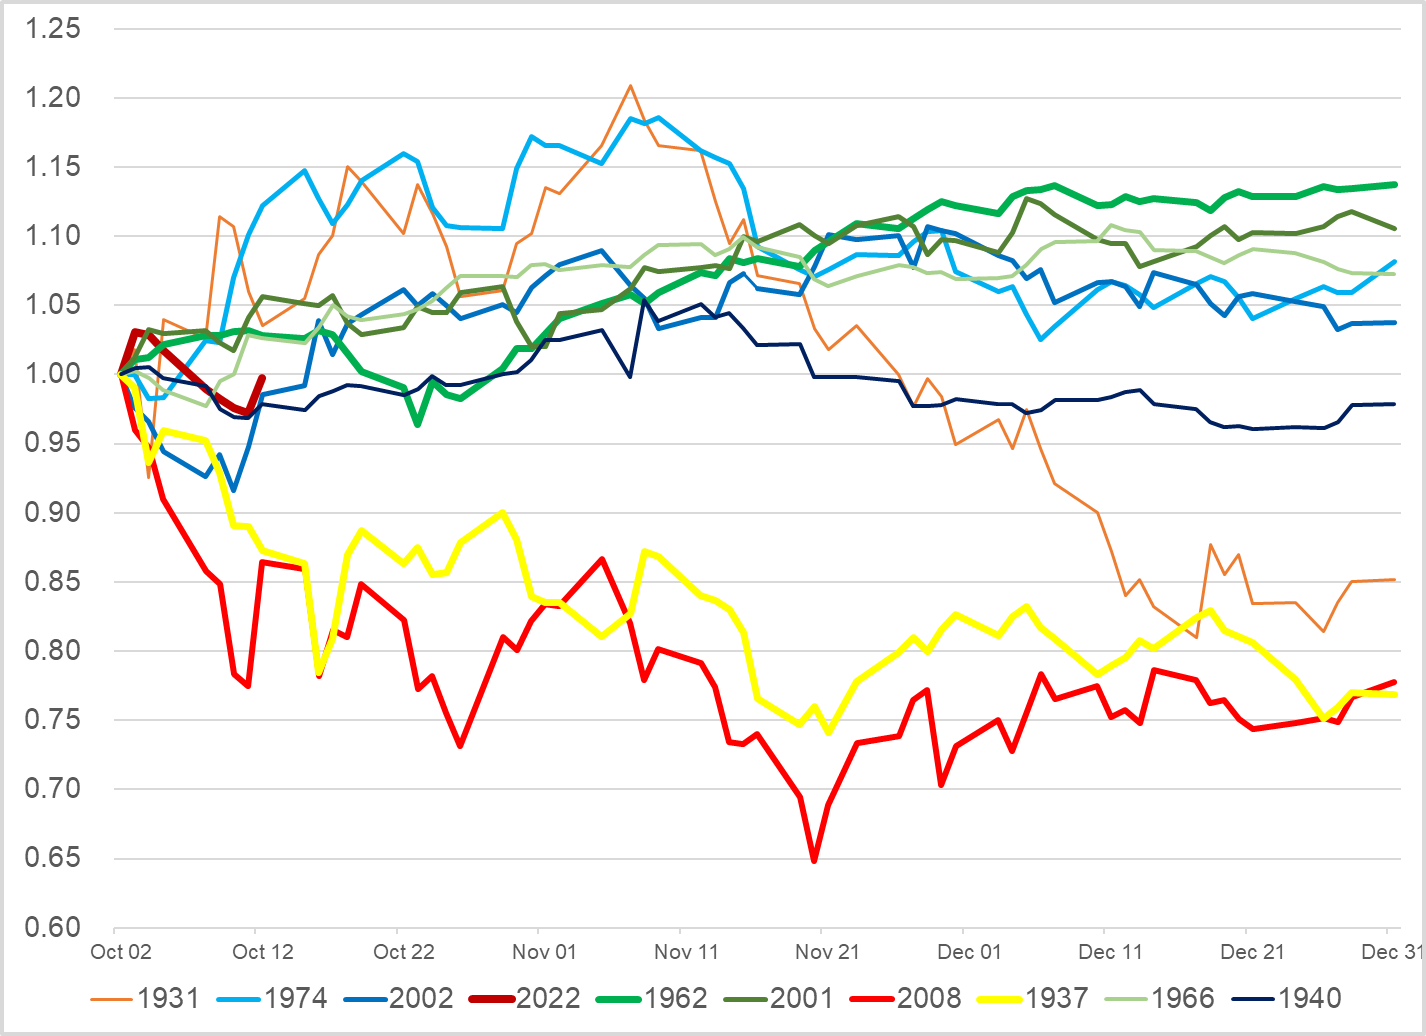
Hmmm. A bit less attractive as 1937 and 2008 were complete dirtnaps. Then again, stocks were cratering way before October 14 in both of those instances. As I have said many times, this market feels much more like the dotcom bubble burst than 2008 and so a move higher into the mid-terms (like 2002) makes more sense to me than a 2008-style collapse.
There does not have to be a reason. The reason can simply be that sellers are burnt out and flows turn positive into year end, despite the hellacious macro regime. Mr. Blonde agrees.
I am bullish risky assets for a few weeks, but taking it easy for now because I already have the BRL trade and the China Party Congress is this weekend. For whatever reason, there is still a cohort of North Americans and Europeans who are looking for some sort of “COVID Zero is over” announcement this weekend, even as everyone I speak to in Asia says “no way” and the major party mouthpieces in China continue to extol the virtues of the COVID Zero™ policy.
A 5%-10% rally in stocks would put us between 3875 and 4060 going into mid-terms
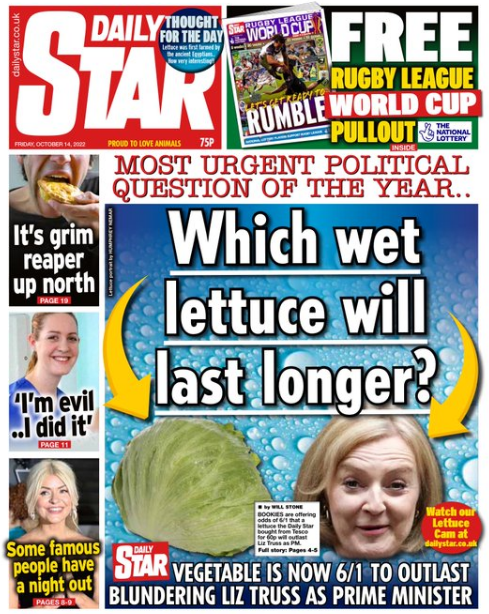
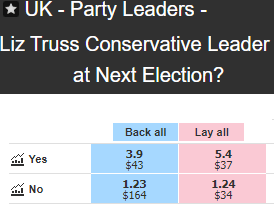
Liz Truss is on the ropes. Betfair odds:
Have a funny weekend.
Source: Demetri Martin
