
Today, a short discussion of how I use RSI and a quick thought on the role of positive interest rates in setting the price of money in a functioning capitalist economy.
highlights
am/FX: RSI (and Capitalism)

December 28, 2022
RSI (and capitalism)
The standard way to use RSI is that when it breaks below 30, you wait for it to come back above, and buy. And the opposite for breaks above 70. As someone who hates being late to a party, I have a different approach. I like to look for moments when the RSI breaks under 20 or above 80 and jump in right away.
I would not do this solely based on the RSI; I would need some sort of thesis to go along with the technical signal. Here’s a recent example of one that worked in FX.
AUDNZD with 14-day RSI
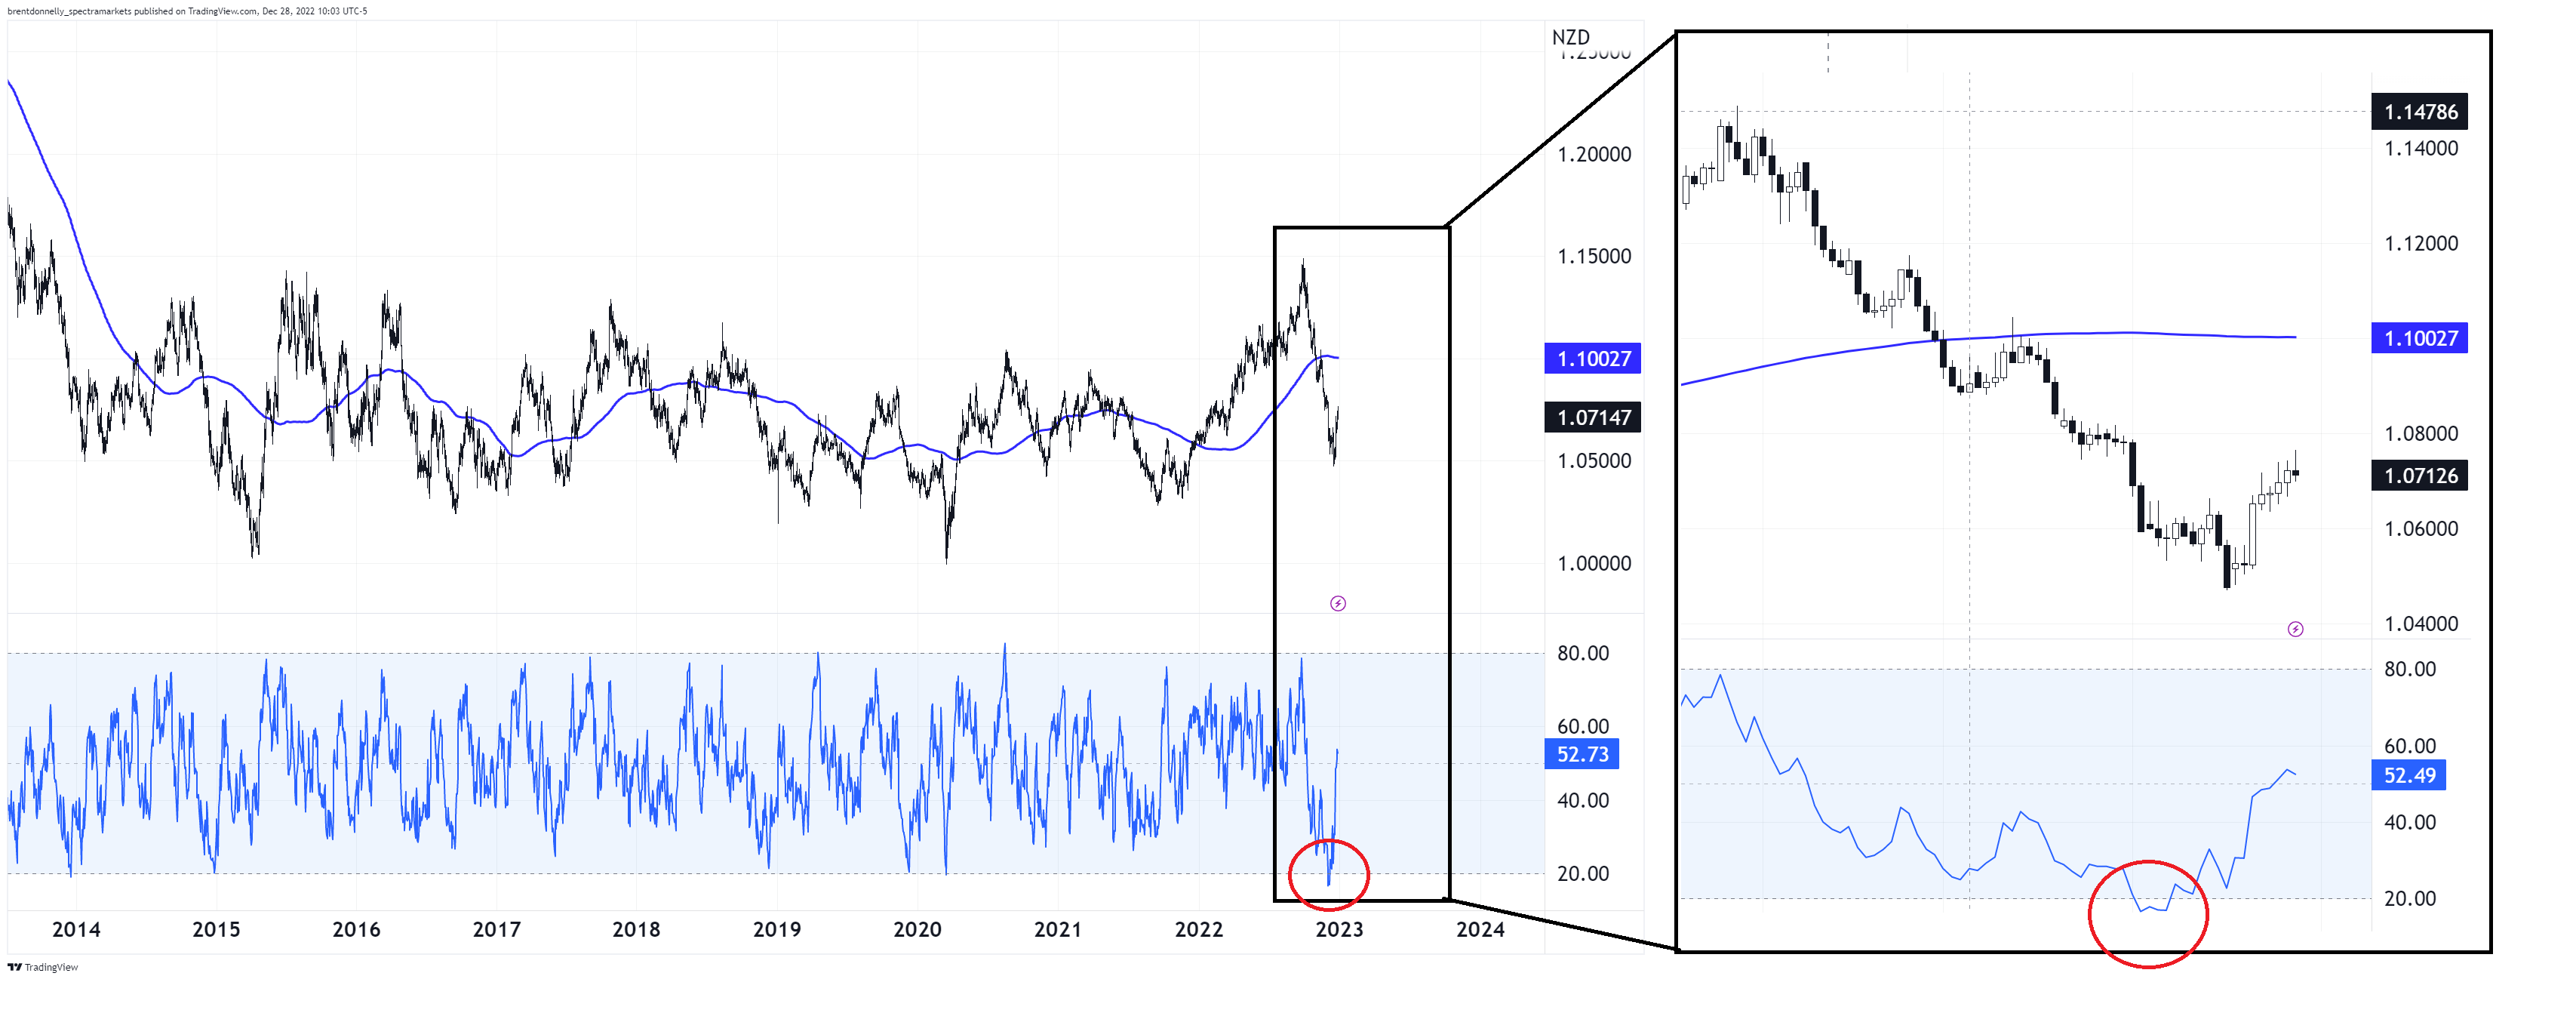
I set the parameters for the blue band on the bottom to 20 and 80 so that you can see the breaches. There are very few. Most of them coincide with overshoot and reversal, though the execution of the fade can take a few years off your life and there is nothing guaranteeing that this works every time. I have not backtested it, though that is a project I will start today. I’ll report back to you on my findings.
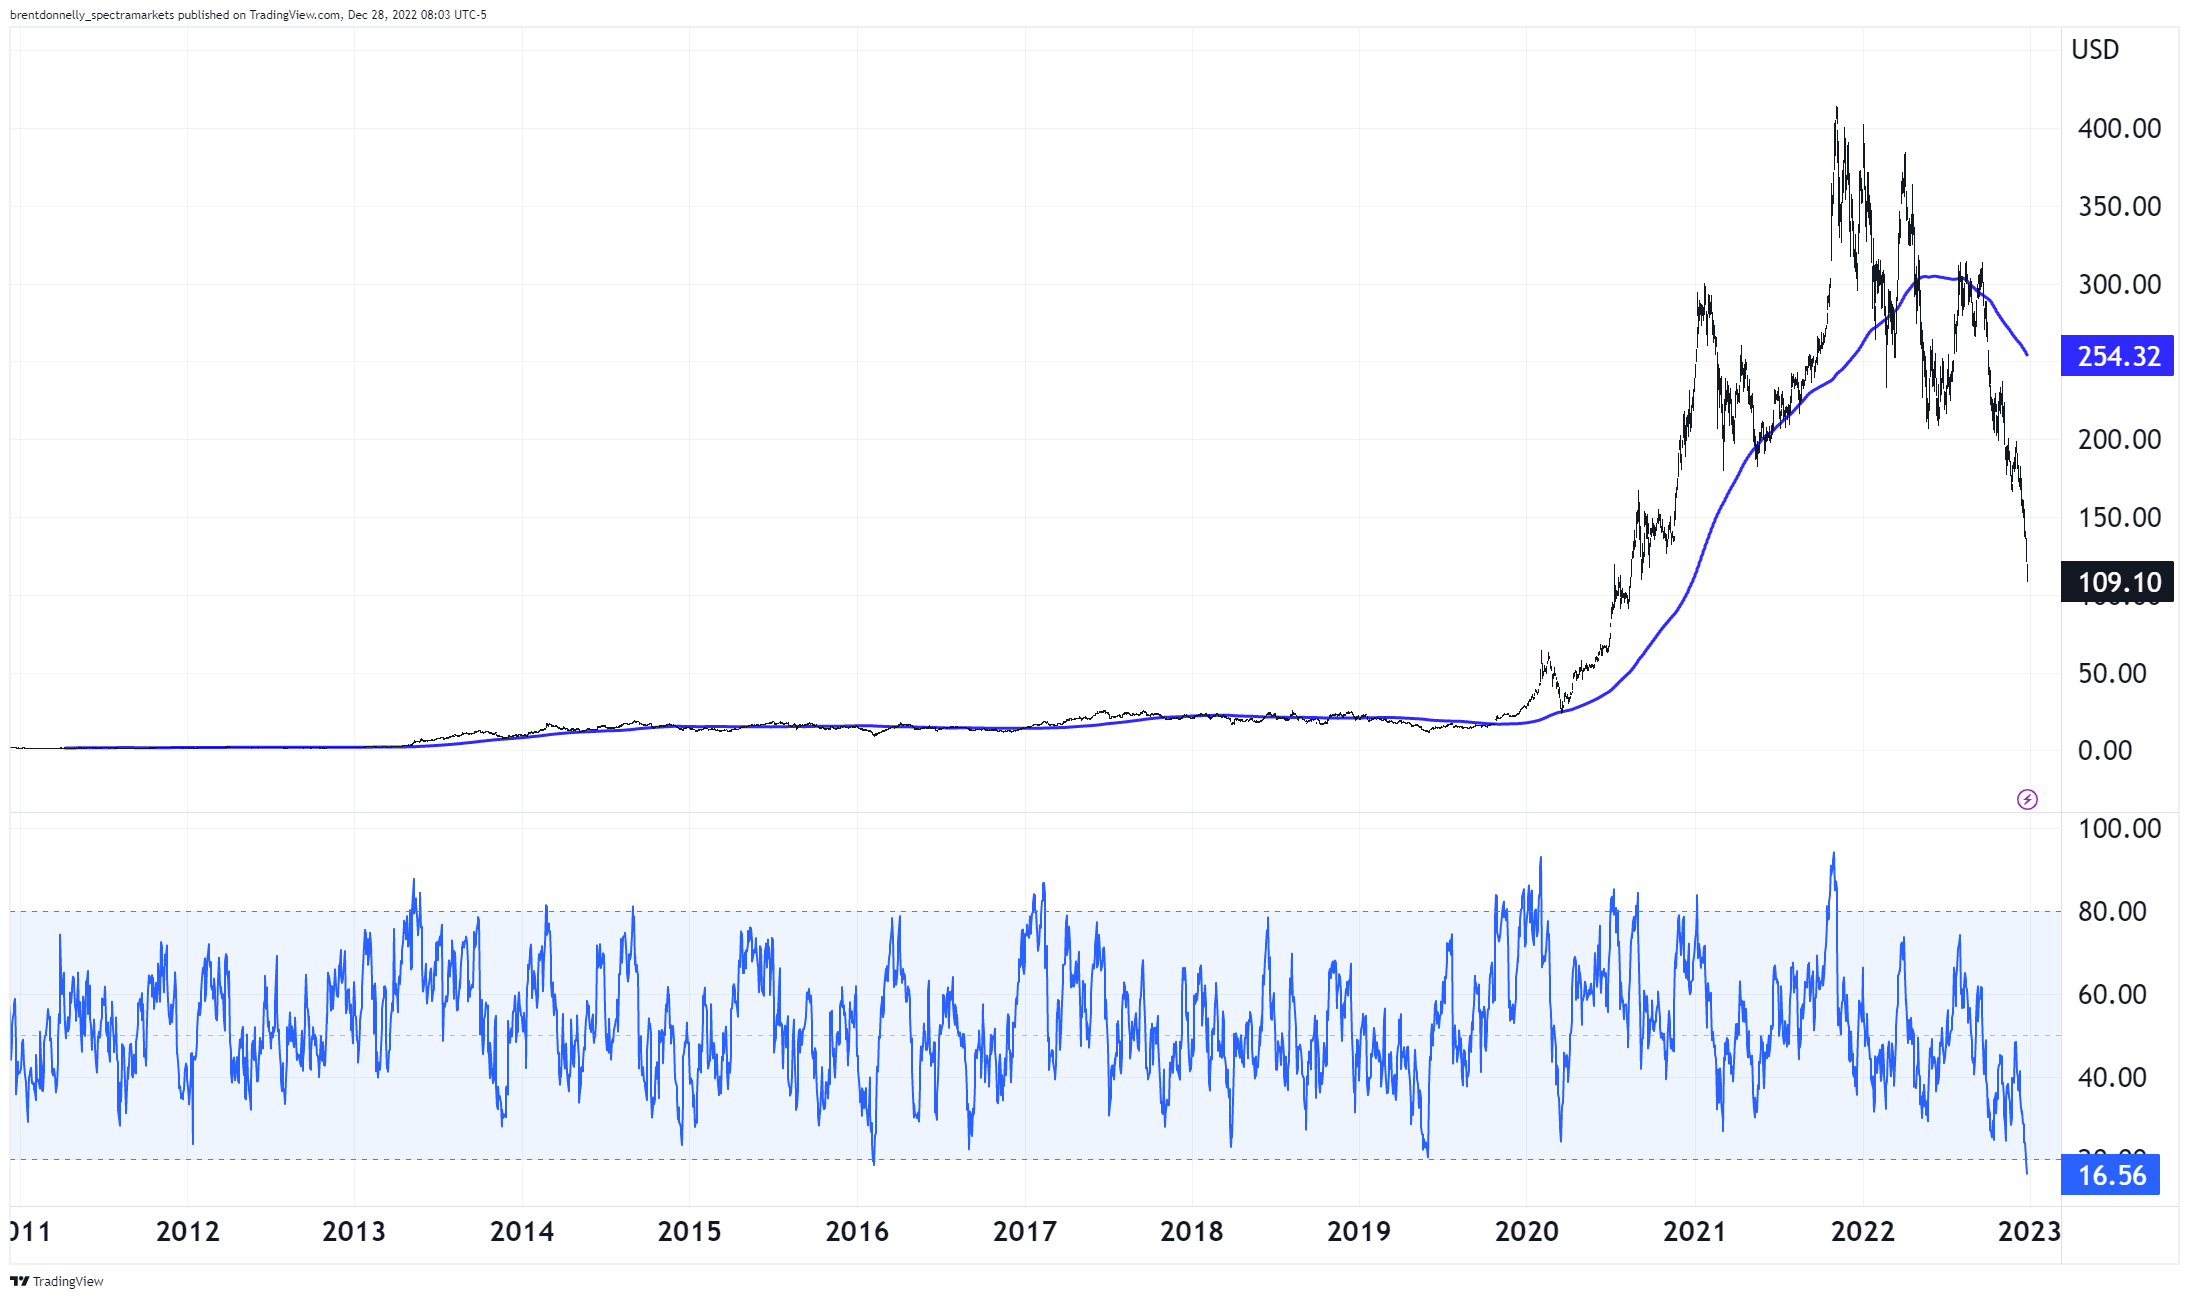
This is generally not a stock trading newsletter, and I’m not giving investment advice here, but the reason I have RSI on the mind today is that TSLA just hit its all-time low on the 14-day RSI.
TSLA with 14-day RSI
The stock still trades at 4.6X sales, which is -ahem- a tad higher than, say, Mercedes-Benz at 0.5X sales. But the ratio is now more in line with TSLA history before it was embraced by the “any valuation is OK when the story is fun enough” crowd as part of the meme stock bubble.
TSLA price-to-sales
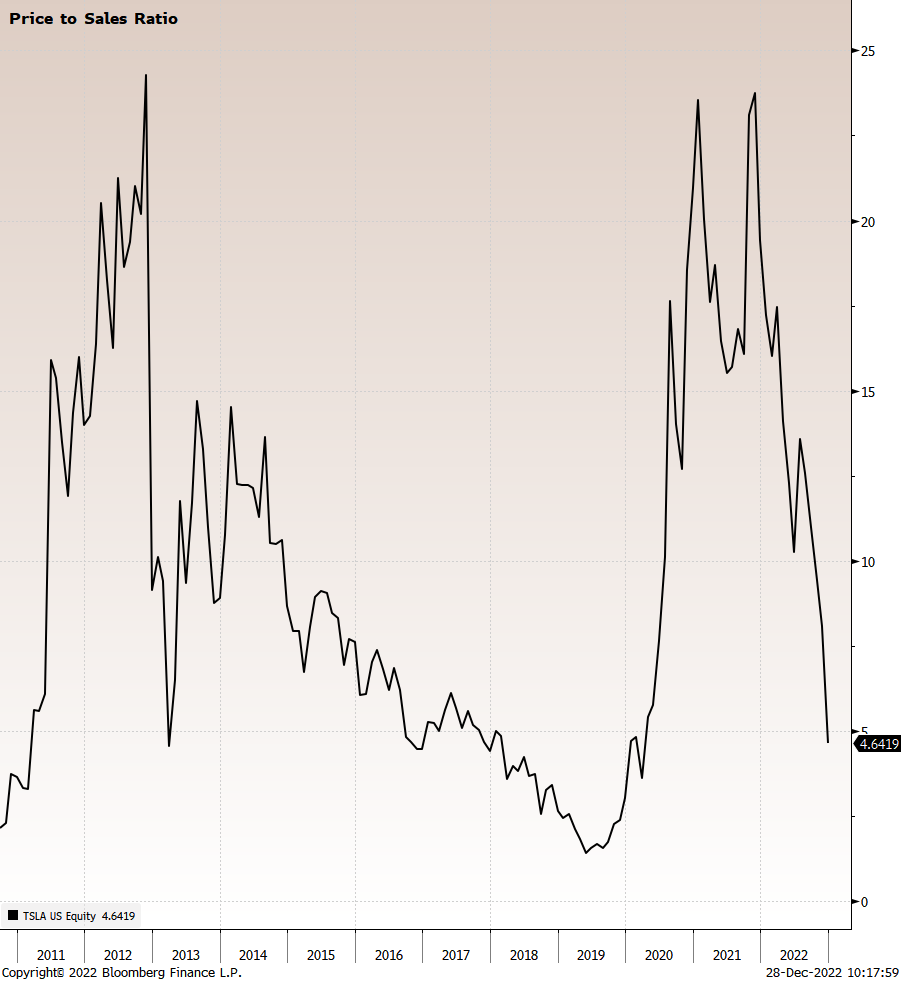
Note that a price/sales ratio of 25X is defensible when you are a 4B company like TSLA was in 2011. It is completely indefensible when you are one of the largest companies in the world, by market cap. Trees do not grow to the sky.
Anyway, I’m not a CFA, but I have traded through two huge tech bubbles now. Price-to-sales is a simple and logical way to cut through the community-adjusted GAAP noise and see one, easy-to-understand valuation metric. Like I said, price/sales is less meaningful for tiny companies but matters for big ones. Here’s a modern way of looking at it.

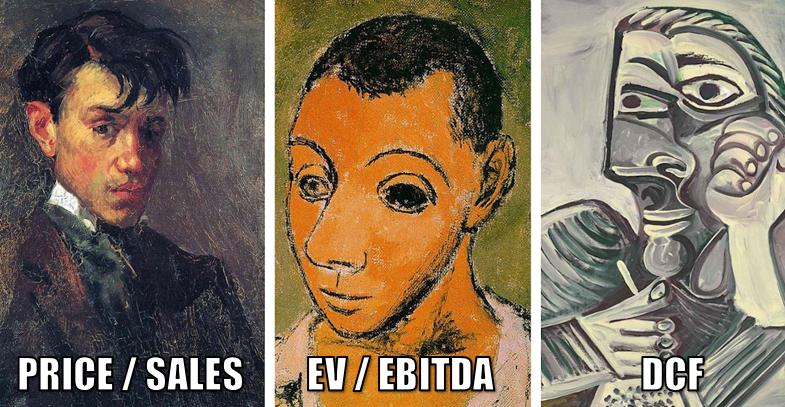
Both images from: https://twitter.com/Bardamu_31
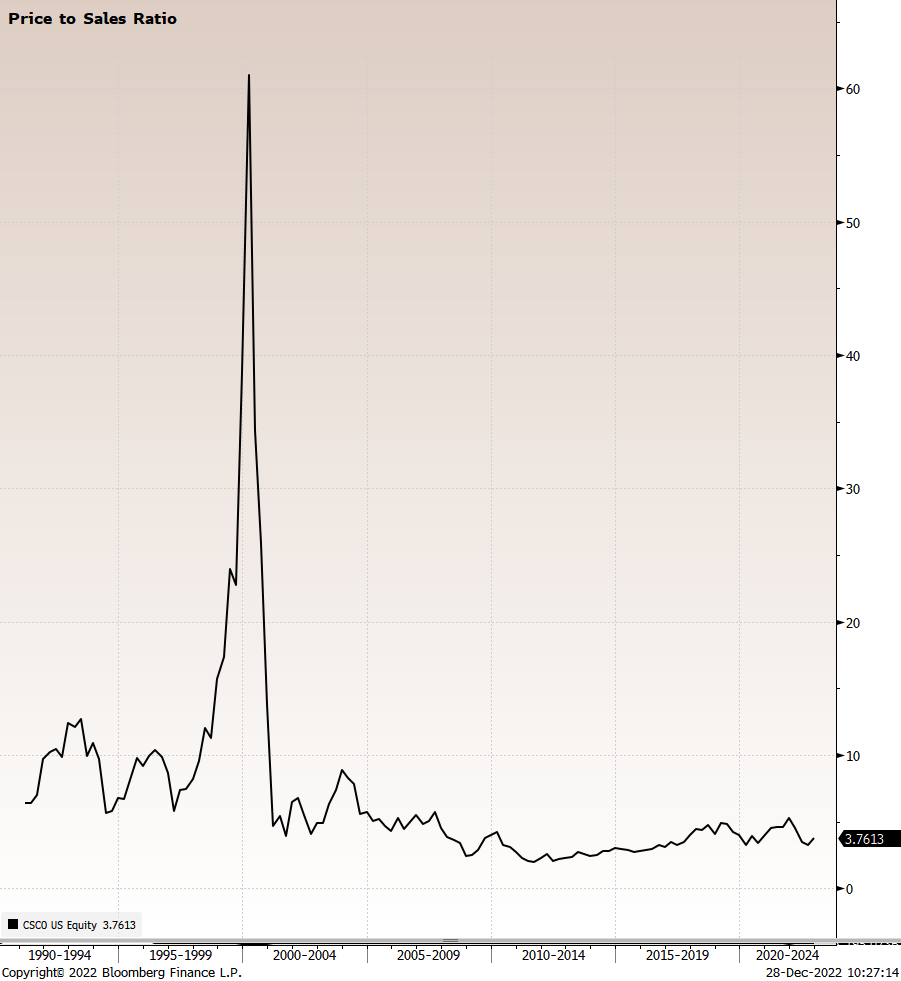
And just for fun, here’s CSCO price/sales.
CSCO price-to-sales, 1990 to now
Anyway, if you are interested in owning an automaker that trades at 4.6X sales, this might be your moment. Tax loss selling and window dressing are probably playing a big part in the selloff in TSLA as its owner has temporarily left the building to pursue a $44B hobby that has aggressive political overtones. Fund managers who don’t believe in the Musk message, or whose investors or managers don’t believe in the message, are probably cutting TSLA holdings before year-end holdings are published.
The stock is down almost 50% this month, the RSI is at an all-time low, and the deadline for tax loss selling is Friday. As far as countertrend punts go, you could do worse. A bounce back to 150/165 would be in the realm of possibility for TSLA in JAN/FEB.
Did I mention this is not investment advice?
TSLA is micro. What about global macro?
During the holiday period, I tend to go off the normal am/FX script a bit (as you experienced yesterday with my short piece of fiction). Also, I feel that FX is in a random walk mode here as the rise in US yields and wicked steepening has taken the mojo out of the bullish JPY and bearish USD trades for now.
Amidst all the 2023 economic pessimism, I ask you: Would you rather invest in a world of 1% inflation and 0% rates where nobody ever goes bankrupt? Or a world of 3% inflation and 4% rates where unprofitable companies are destined to fail as they can’t afford to roll their debt?
As Frank Borman, ex-astronaut and former chairman of defunct “Eastern Airlines” once said:
Capitalism without bankruptcy is like Christianity without Hell.
We might look back at the end of 2023 and see this reset to higher rates as a good thing, not a bad thing.
By the way:
Frank Frederick Borman II (born March 14, 1928, pictured at right) is a retired United States Air Force (USAF) colonel, aeronautical engineer, test pilot, businessman, and NASA astronaut. He was the commander of Apollo 8, the first mission to fly around the Moon, and together with crew-mates Jim Lovell and Bill Anders, became the first of 24 humans to do so, for which he was awarded the Congressional Space Medal of Honor. As of 2022, he is the oldest living former American astronaut, eleven days older than Lovell. Have a well-mapped out day.
good luck ⇅ be nimble
The overview effect
The overview effect is a cognitive shift reported by some astronauts while viewing the Earth from space. Researchers have characterized the effect as “a state of awe with self-transcendent qualities.”
The most prominent aspects of experiencing Earth from space are: appreciation and perception of beauty, unexpected, overwhelming emotion, and an increased sense of connection to other people and the Earth as a whole.
The effect can cause changes in the observer’s self-concept and value system and can be transformative.
An alternative to the Mercator projection

“On a typical world map, such as the classic Mercator projection, Greenland appears misleadingly enormous – yet few observers pause to note the inaccuracies. Mapmakers rarely question other basic assumptions, such as drawing north at the top.
But if the Earth resembles ball spinning through space, are ‘up’ and ‘down’ so self-evident? Better maps can provide fresh perspective and make viewers aware of unspoken assumptions.
The Hobo-Dyer projection shows accurately the relative size of different land areas, while preserving north/south and east/west lines of bearing. It also gives the Southern Hemisphere visual prominence, imagining a globe that has been recentered Down Under.”
https://worldhistorycommons.org/hobo-dyer-projection-worldmap
