Yields made new highs, but fixed income volatility did not. That is one more reason to be bullish world. I am bullish, and scared.

Some words, like “pom-pom”
are objectively more fun to say
than others (like isthmus)

Yields made new highs, but fixed income volatility did not. That is one more reason to be bullish world. I am bullish, and scared.

Some words, like “pom-pom”
are objectively more fun to say
than others (like isthmus)
Stop 150.56
Take profit 145.11
Stop 10.92
Take profit 9.88
Spot ref. 5.1850 on 10OCT22
Expires 11JAN23
October 20, 2022
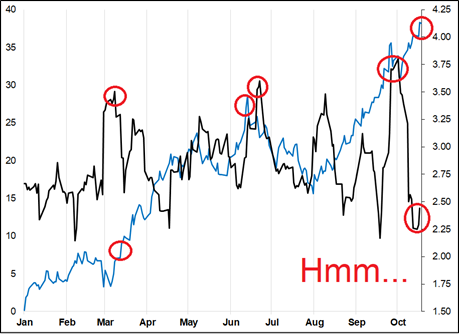
I can’t quite put my finger on it, but something feels different in the market. Yesterday, I was chatting with Mr. Blonde, and he mentioned the lack of fixed income volatility. I think maybe that’s what I’m feeling here. My first chart today shows 10-day realized volatility of TLT (the US bond ETF) vs. US 10-year yields.
The red circles show that each new 2022 high in yields was met with a correspondent pop in realized volatility. This time, we have new highs in yields, but vol is low.
d i v e r g e n c e
Perhaps as we approach terminal, restrictive, and 3m/10y inversion, the market sees less capacity for tail risk in rates? That is, rates are going up, but the range of outcomes is narrowing, and the path is just as important as the destination. Maybe the tail move already happened! This move from 1.50% to 4.00% is already epic.
This is not a reason on its own to go long stocks or argue for overall capital market stabilization. But the three tail risks were: UK fiscal calamity, EU energy collapse, and convex explosion higher in US yields… All three look less scary today than they did a month ago. Way less scary.
My chart is extremely zoomed in, and measures of fixed income volatility like MOVE are not coming off anywhere close to what 10-day realized vol is doing. Obviously. So, some caution is warranted on my conclusion here. That said, prior new highs in yields triggered new highs in vol. This one didn’t. That is meaningful to me.
Then, you have bullish equity seasonals into year end, of course, and the blowoff bottom in spoos (bad news / good price) last week.
As discussed yesterday, I remain bullish risky assets and bearish USD. But plenty scared. I still think USDNOK lower, USDBRL lower, stocks higher and yields top out short-term. The choppy price action in stocks looks like the market is mega short gamma, which makes sense because the short-dated options market is exploding in volume and there are a ton of contracts expiring tomorrow. Here’s how gambling short-dated options trading has progressed since the GFC:
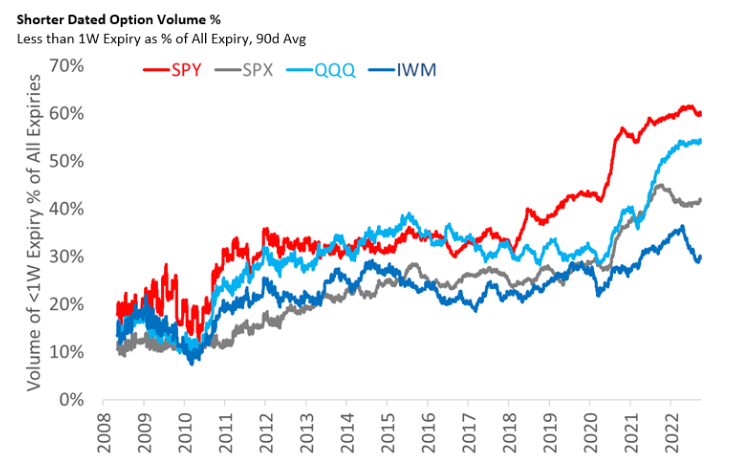
https://twitter.com/dunleavy89/status/1582460825909940224
There is a theory out there that the MOF has changed strategies. Instead of dropping 10 billion USDJPY on the market and watching USDJPY bounce back like a SuperBall™… They are going to duck and dive and slap back the market or smooth it without any formal announcements after the fact. This approach is a bit less risky if you are afraid of looking stupid. Less risk of losing face/credibility if people don’t know for sure that you’re involved. Price action last night around 150 supports the theory:
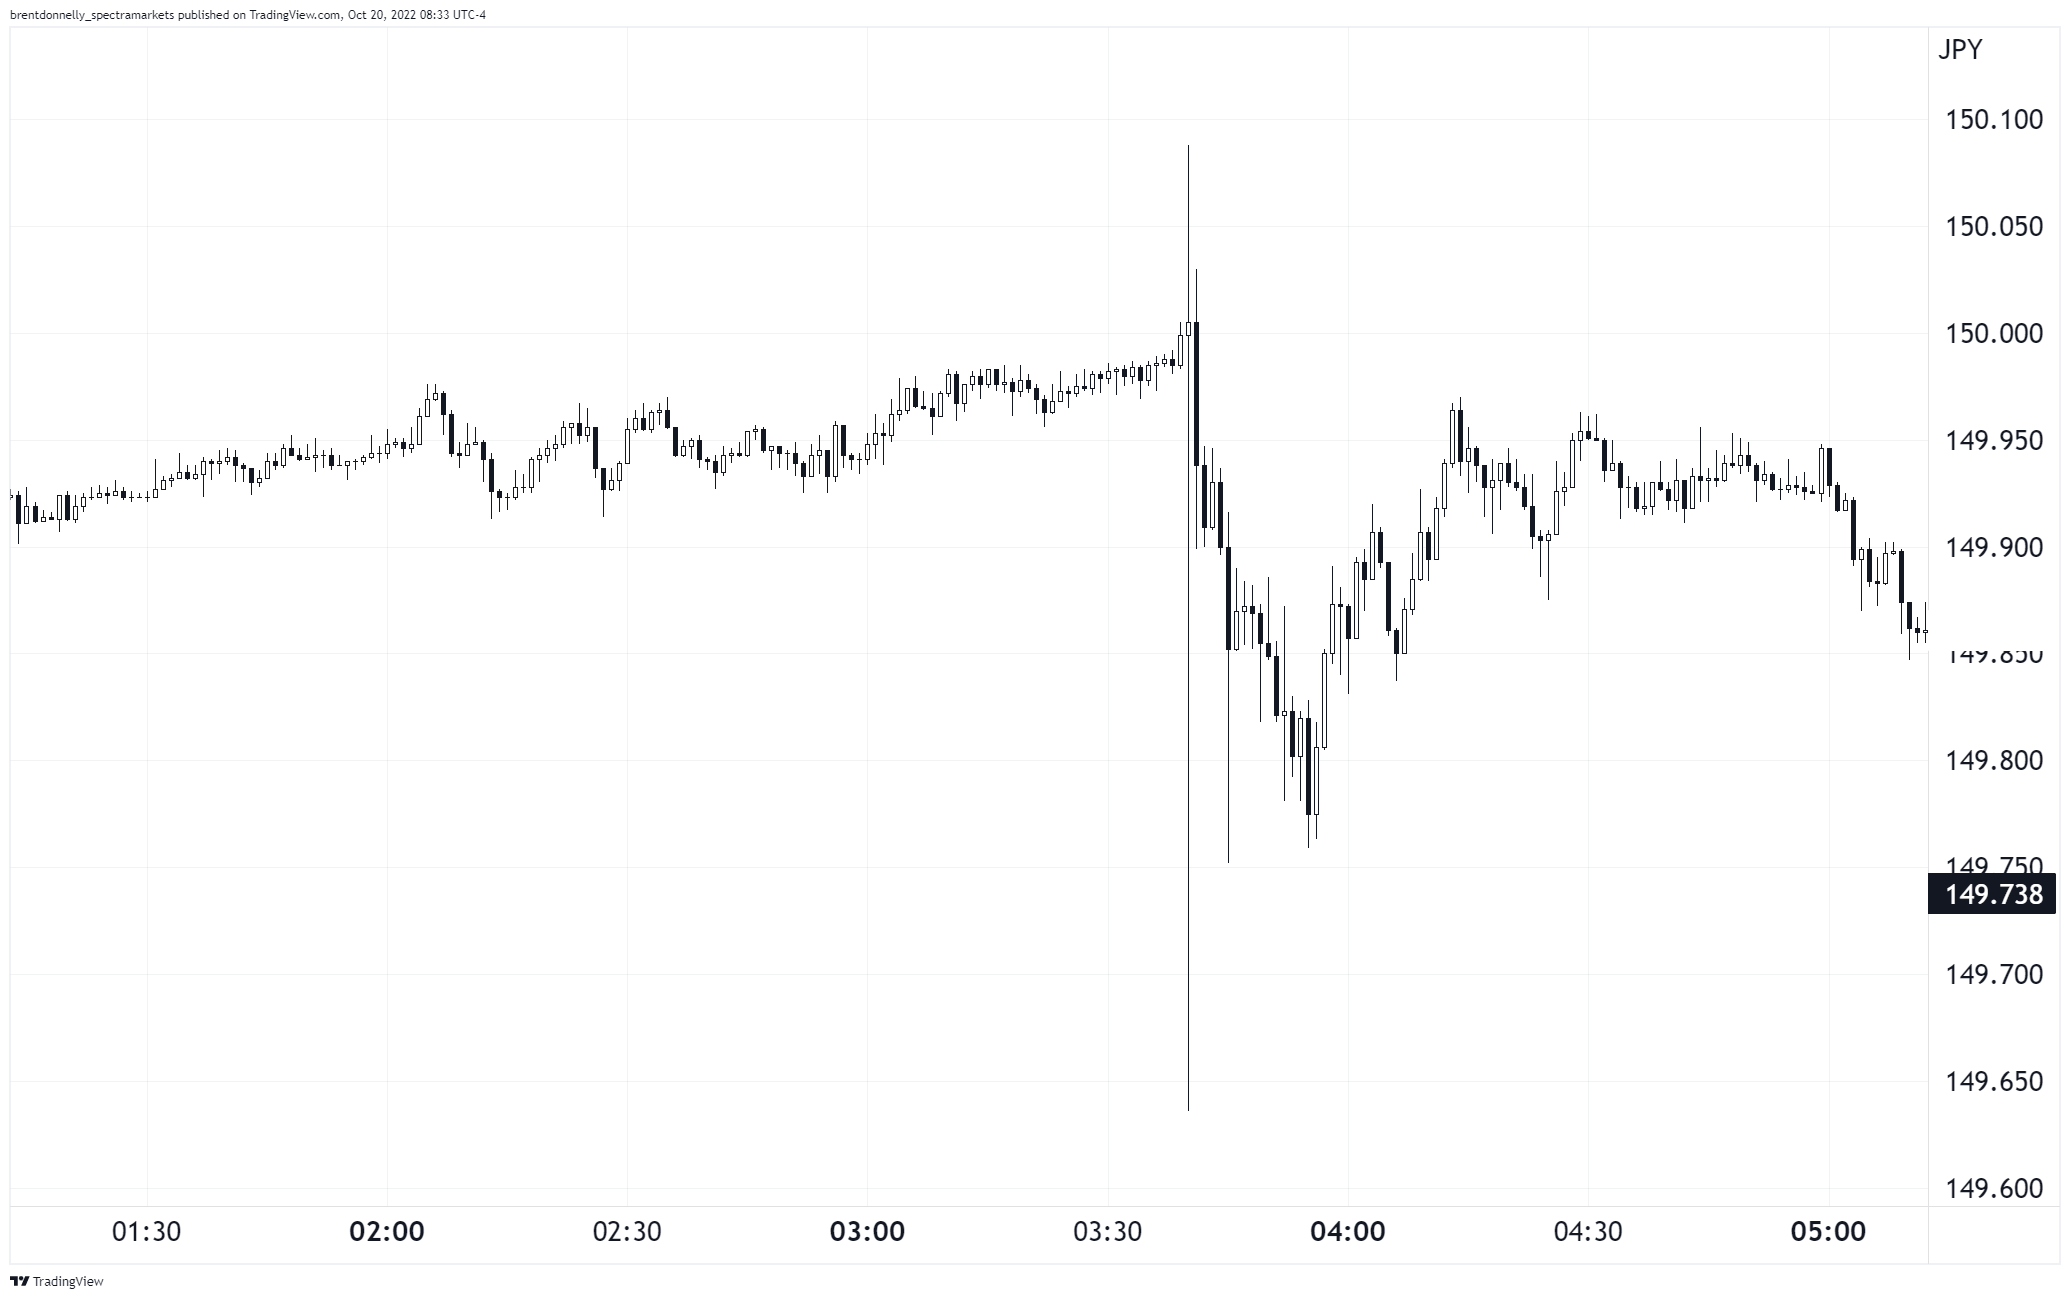
Prior attacks on the super round 10s looked like this:
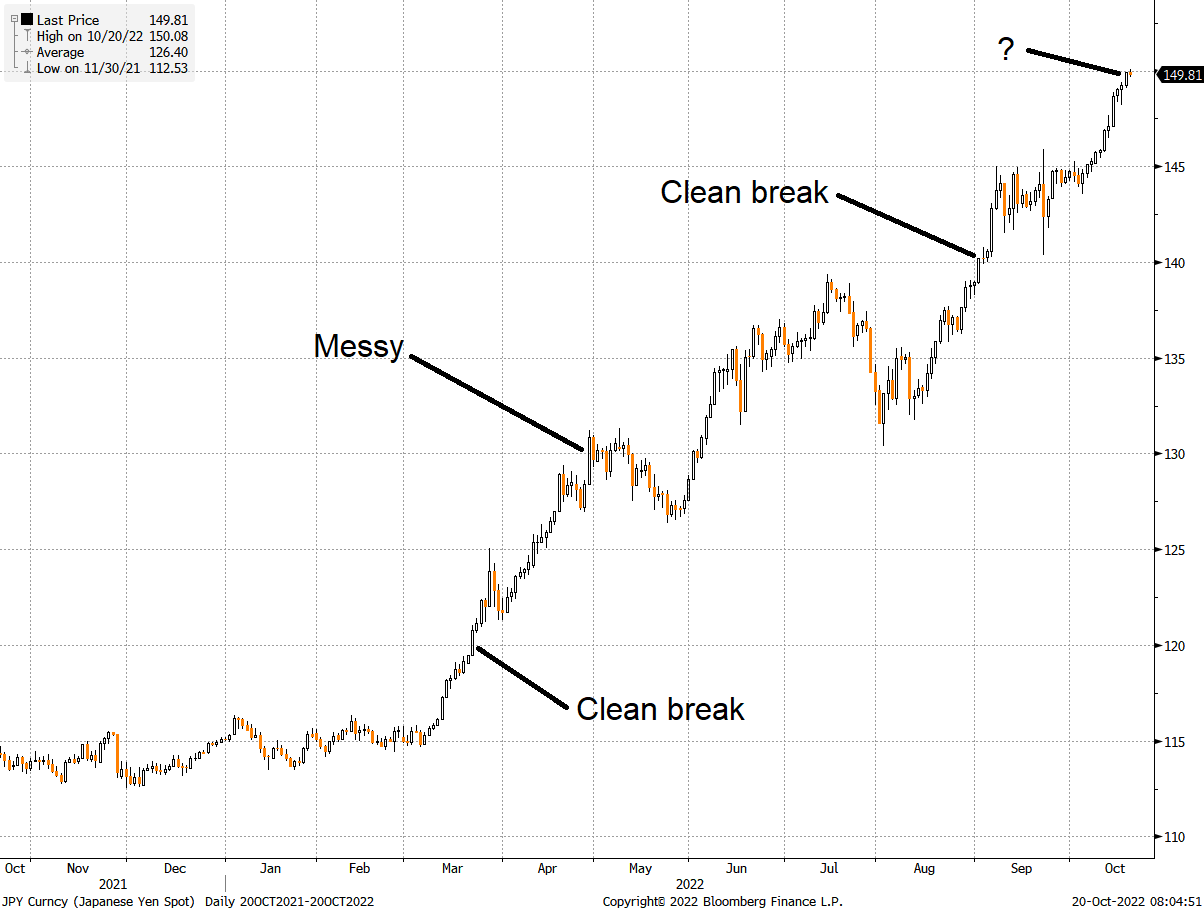
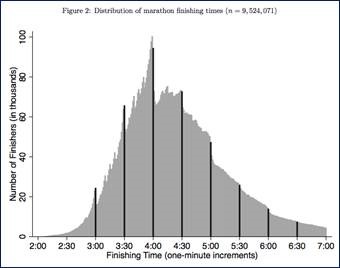
The price action around 150.00 is important and I still think short USDJPY here with a stop at 150.56 makes sense. I’m adding that to the sidebar. Human beings have a special fascination with round numbers and 150 is about as round as they get. Example of round number bias: For many amateur marathon runners, a finishing time of 3:59:58 is a great success while 4:00:02 is a disappointment. People will push themselves to the absolute physical brink to break the four-hour barrier. And it works! See here:
See Appendix A for more on Round Number Bias.
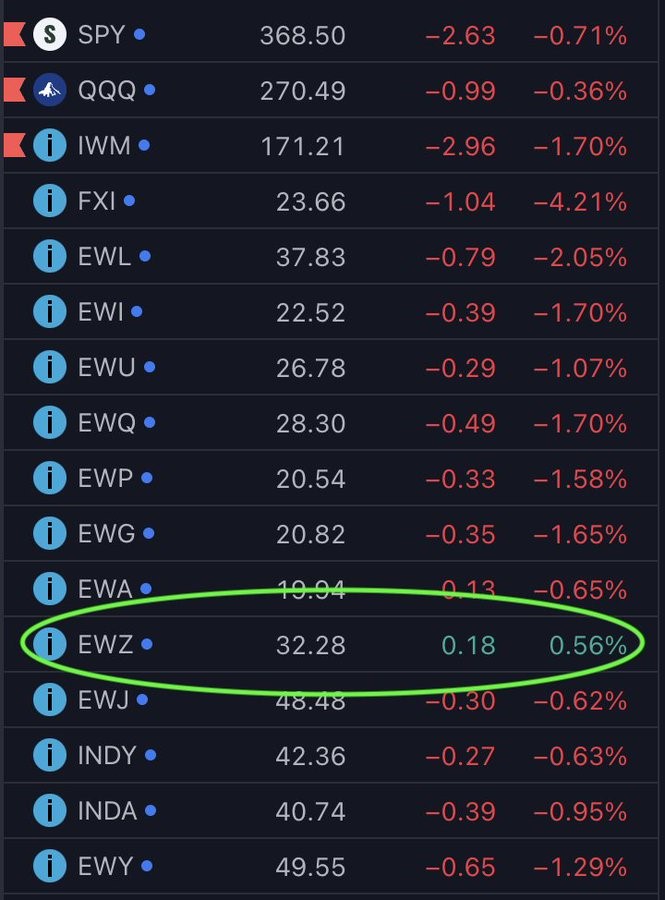
Interesting relative performance from Brazil yesterday. While the long EWZ or short USDBRL trade has been boring so far, I still like it very much (see am/FX: Brazil is excellent for full explanation.)
https://twitter.com/options_insight/status/1582868278623379456?s=46&t=o5fX7ujzKgNZhHG98ivavQ
Have a decorative day.
When you fill your car with gas, do you sometimes have the urge to round it off to the nearest dollar, even though you are paying with a credit card? Do you get a tiny thrill watching a car’s odometer roll over from 99,999 to 100,000? For many amateur marathon runners, a finishing time of 3:59:58 is a great success while 4:00:02 is a disappointment. These are examples of round number bias.
Human beings tend to pay attention to round numbers and treat them as special or more important than other numbers. OK, sure Brent… Who cares?
You should.
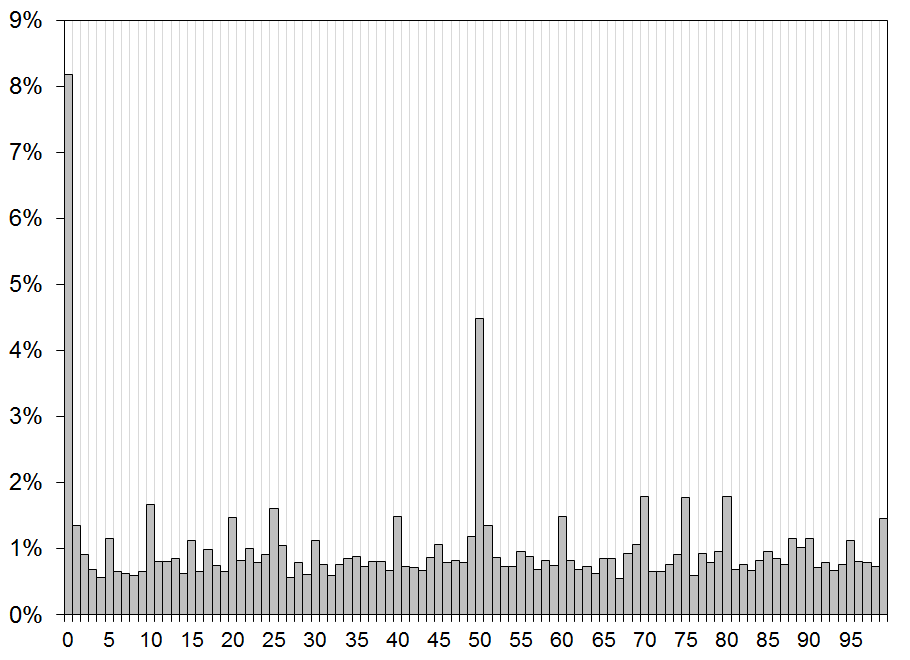
Round number bias appears in financial markets, and while this knowledge will not be life- or career-changing for you, it will save you from the occasional big disappointment. Due to round number bias, many market participants leave their orders on the round numbers. Many more than you would see if orders were randomly or evenly distributed. I will show you two examples from the world of equities, but these anomalies are present in every market I have studied.
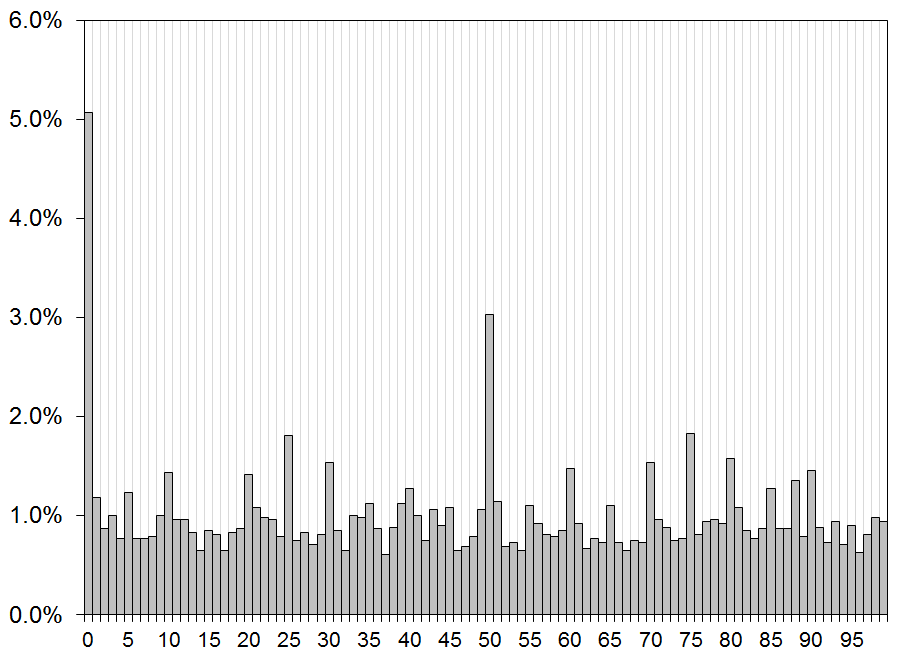
The two charts that follow show the distribution of the last two digits (the cents) of each daily high and low in TSLA and NFLX from 2015 to 2020. For example, $520.40 would be 40. $765.00 would be 00. $509.33 would be 33, etc. Note the huge overrepresentation of highs and lows at 00 and 50, exactly as round number bias would predict (00 is far, far left).
Therefore, if you leave an order to buy at, say $473.01, you are statistically more likely to get filled than the person with an order at $473.00 or $472.99 because the majority of buy orders will be on the round number at $473.00. Most days, you’ll probably get filled at any one of those three levels, but the occasional time you get filled at 01 when you would not have got filled one cent lower can have a big impact on your performance.
On the flip side, if you are leaving stop loss orders, always leave them on the correct side of the round number. Sell stops should be below 00 and buy stops should be above. The day you leave a stop loss at $474.99 and the low is $475.00, you will feel like you got lucky, but these tiny alterations in behavior can sometimes be skill masquerading as good luck.
P.S. When that happens, you owe me a beer.
HT: O-dawg
