The next 10 days are full of important events. The path of inflation and stocks looks a lot like the path from 1918 to 1921.
Larger version at bottom of page

The next 10 days are full of important events. The path of inflation and stocks looks a lot like the path from 1918 to 1921.
Larger version at bottom of page
Long 07FEB EURGBP call
spread 0.8870/0.8920 risking
22 GBP bps to make 50
Spot ref. 0.8850
January 9, 2023
I remain in the USD down, soft landing vibes camp and I think into CPI the market will be much more nervous about a weak number, not a strong one. Whether it’s because of short positions in risky assets, or FOMO over some of the more “obvious” China reopening and global growth rebound trades like AUD, gold, silver, and now maybe oil… A weak CPI and higher risky assets are the pain trade.
Ironically, while the sell side was nearly unanimous in its view that the start of the year will be bad for risky assets, the exact opposite could be the reality. The data right now is not nearly bad enough to ratify the bearish consensus and it’s possible we are looking at a narrative more like 1995 or 2006 right now, not 2001. I will be highly flexible and open to new information but between now and Thursday, I could see a large continuation of the soft landing trade as markets brace for CPI. The soft landing narrative could easily end up being wrong, but who cares for now. It’s in control.
Here are some major events to watch over the next 10 days:
Tokyo CPI tonight at 6:30 pm NY. The JPY trade is in a newsflow quiet period / valley here as we got so much news about hawkish BOJ nominations etc. that I’m not sure there is much for JPY bulls to cheer for in the short-term. That’s why I have been pitching 1-month DNTs over the last week. Strong Tokyo CPI is one thing you can cheer for if you’re short USDJPY.
US CPI January 12. That’s the biggie this week. A weak US CPI number will promote the immaculate rebalancing narrative while a stronger-than-expected number is easier to shrug off given the overall direction of travel is lower prices globally. I’m not saying this is correct; I’m saying this is what the market will be noodling from now ‘til Thursday.
Earnings start January 13 with JPM, BoA, Wells Fargo, and Delta. An important part of the bear thesis for stocks is that earnings are set to crash. I have never seen so many short-term bearish equity views predicated on something so big picture like equity risk premium (ERP). If earnings are not horrendous; it’s bullish. More earnings to watch out for in the next 10 days: January 17: Goldman. January 19: P&G, Netflix, MS.
Bank of Canada Business Outlook January 16. The bearish Canada story, one I am extremely sympathetic to bigger picture, is not borne out by the data so far. Everything from jobs (wicked strong) to delinquencies (microscopic) show a Canadian economy that is ripping along quite nicely. I find it hard to stay bearish CAD until something changes in the data. The Business Outlook Survey is a key input into BoC thinking.
I understand that rising rates should be bad for the world economy at some point, but this is a weird cycle and maybe with US balance sheets so strong and the labor market still way out of balance, the lags are going to be disastrous for Q1 2023 bearish views.
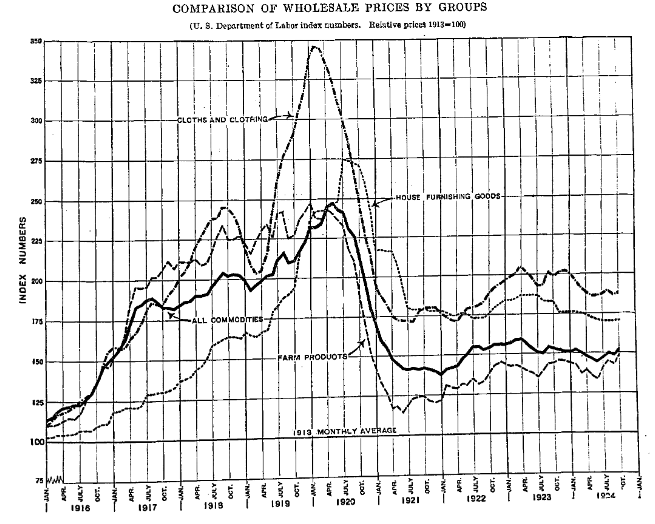
Thinking about CPI a bit more… The path of prices through the pandemic has so far looked a lot like the path of prices through the pandemic of 1918. There are some significant differences to the macro at that time, with the end of World War I etc., but the charts look pretty much the same so far.
Here is what wholesale prices did through the Spanish Flu.
https://fraser.stlouisfed.org/title/survey-current-business-46/december-1924-10277
And here’s what yields did:
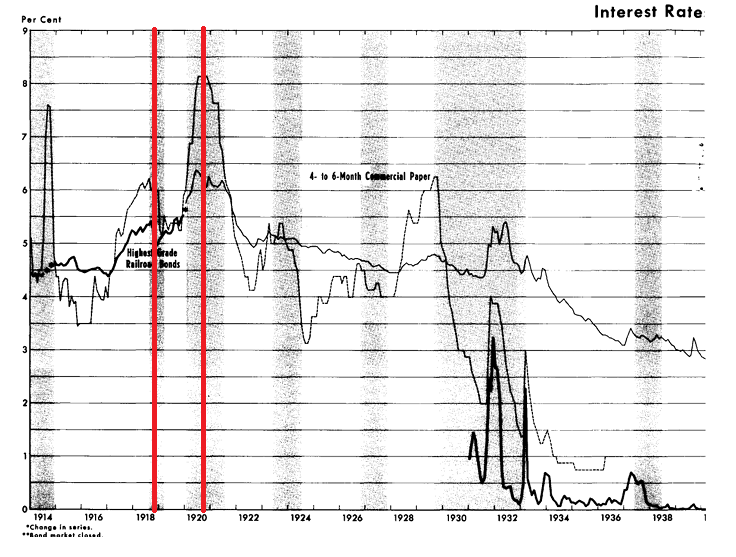
Red lines mark the pandemic
Interestingly, stocks followed a similar trajectory through both pandemics, too. The selloff in 2020 was much larger than anything seen in 1918, the rallies were about the same, and the post-euphoria reversal was bigger in 1920 than it was in 2022. But the general path of inflationary overoptimism was similar in both magnitude and time. And if I had used NASDAQ or ARKK, the overlay would have been nearly identical. But that felt like cheating. Here is the chart.
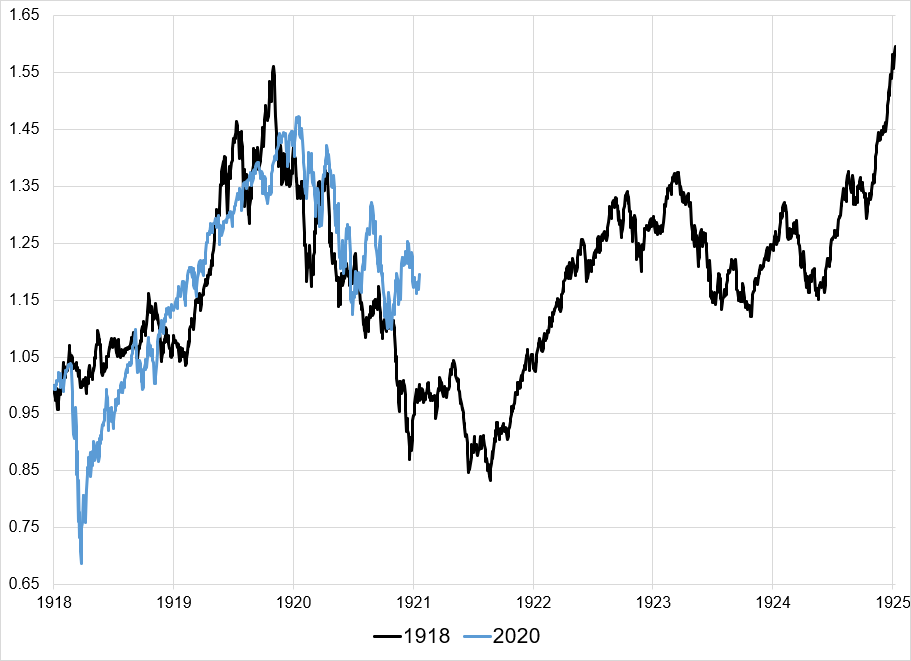
This isn’t actionable, but I thought it was interesting.
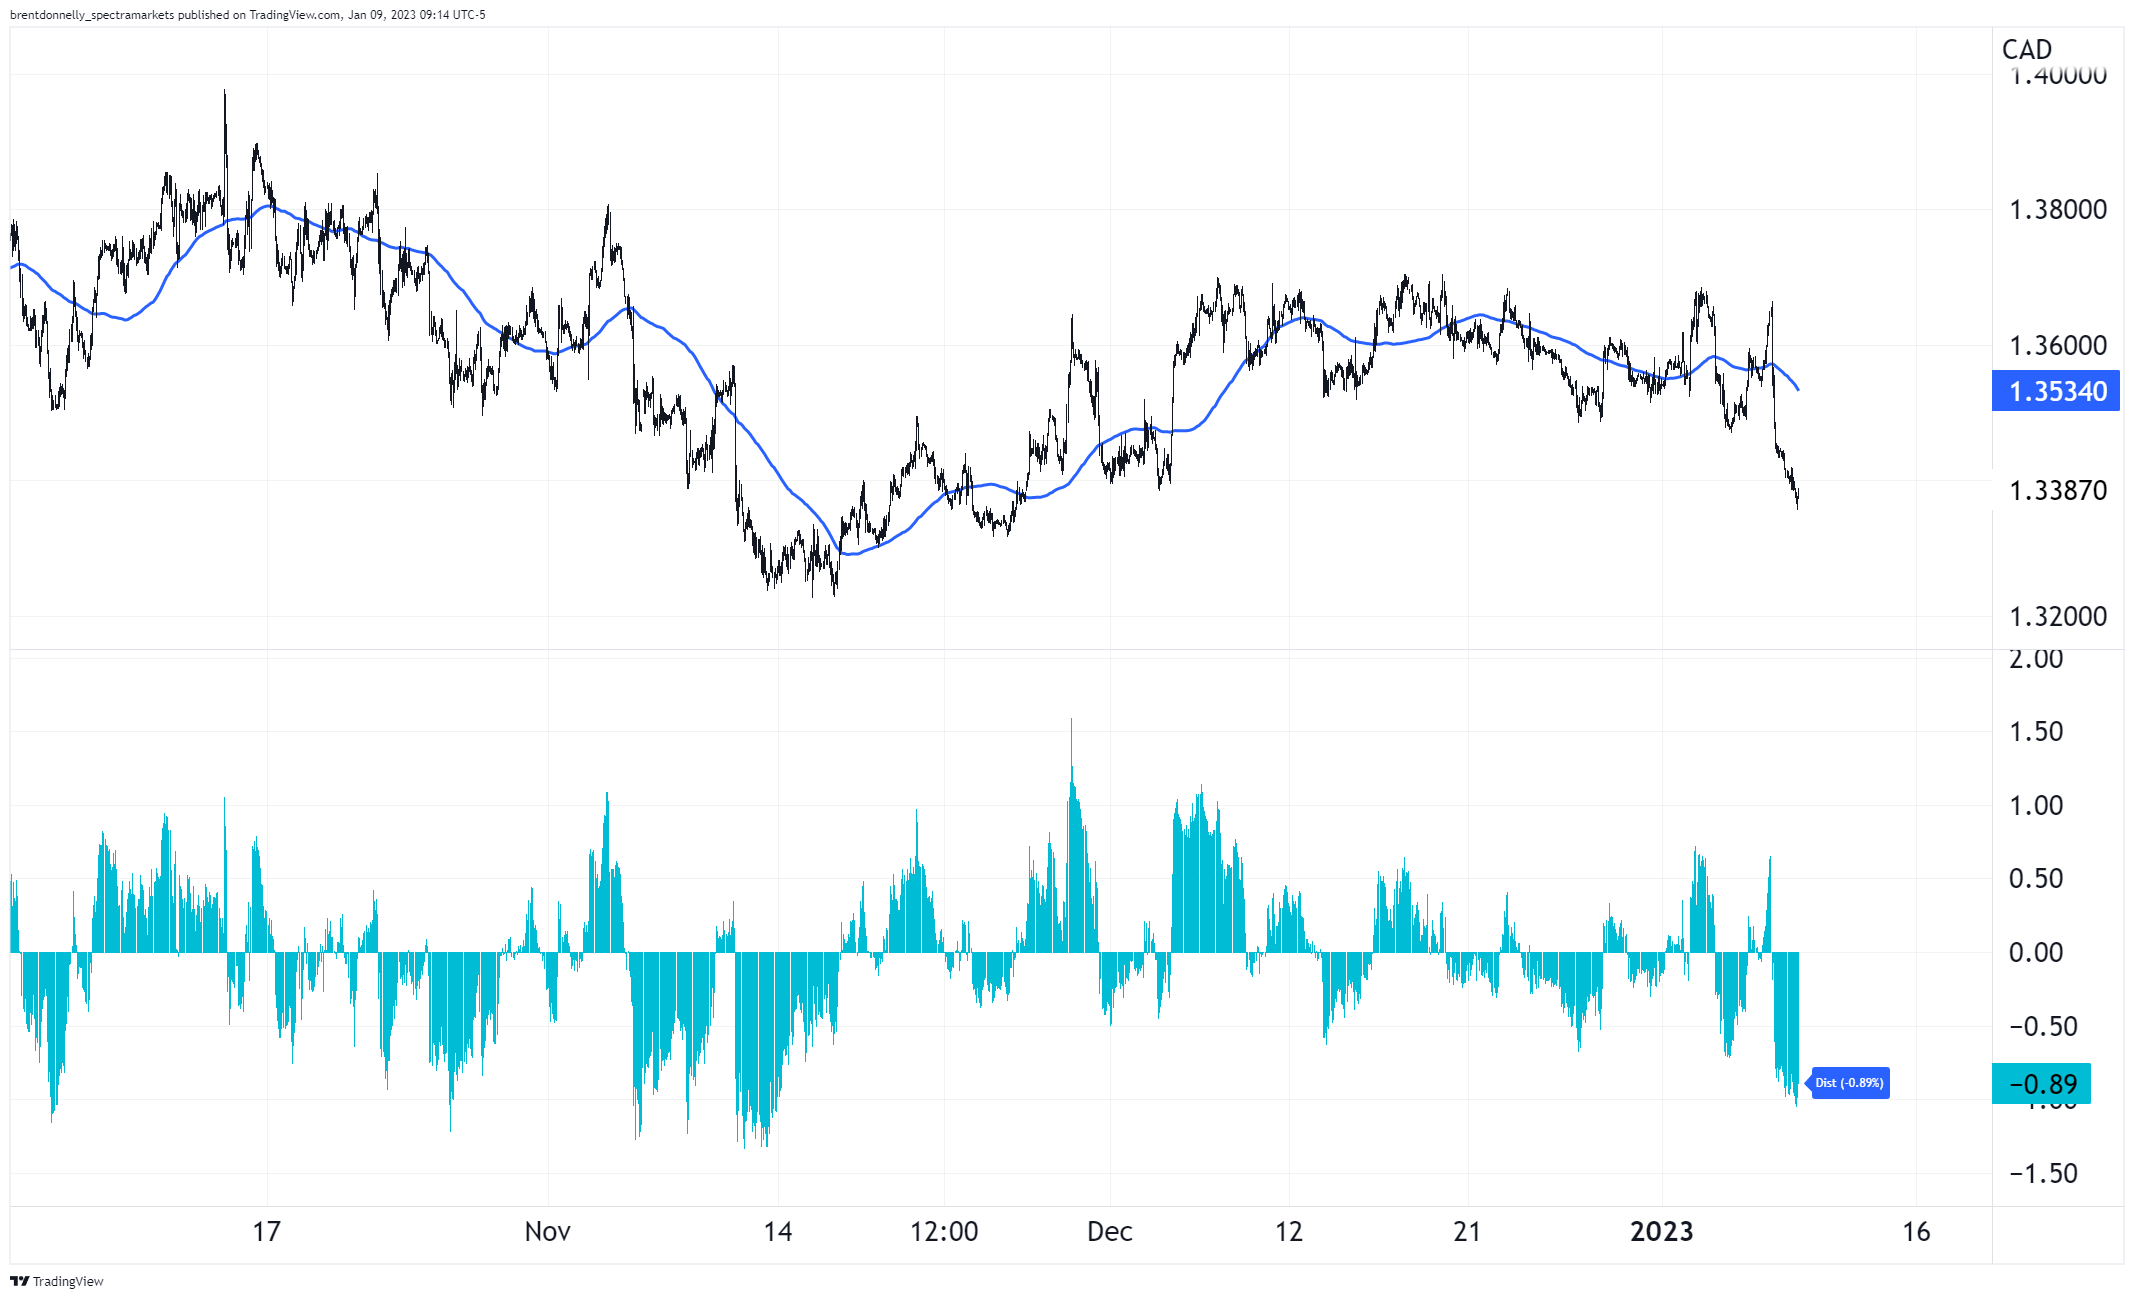
When USDCAD gets more than 1.25% or so away from the 100-hour MA, it tends to mean revert. That comes in around 1.3330/60. Today’s low is 1.3358. Careful with USDCAD shorts in the super short term. This is a very short-term indicator that will resolve itself over the next 12-24 hours.
I have been bullish risky assets and bearish USD so far this year, but I think this is a good year to be particularly Bayesian. This isn’t like 2022 where you could just sell rallies in any asset for first nine months.
Flux is the word.
Have a grossly productive day.
Ht Gitts


A sort of almost unbelievably large move in Brazil. Plus: Short CADJPY.

NZD has a bunch of bullish kickers: Election, seasonality, and inflation