I am not one to call every bull market a bubble, but this moment feels a tad Bubblicious™. Stocks only go up. TINA is alive.

Sorry for sharing this

I am not one to call every bull market a bubble, but this moment feels a tad Bubblicious™. Stocks only go up. TINA is alive.

Sorry for sharing this
28JUN expiry
455 QQQ puts $2.90
TINA is like Jason; it will not die. LATAM is kind of blowing up, EU auto companies are falling off, commodities are soft, China is rolling back over, but the US marches onward and upward. The buy US tech, buy USD trade is in force again and we are ramping a $700B market cap stock 13% higher on a 10-1 split announcement (AVGO). It’s not a bubble, but it’s Bubblicious. Note that AVGO is formerly Broadcom, a dotcom bubble darling.
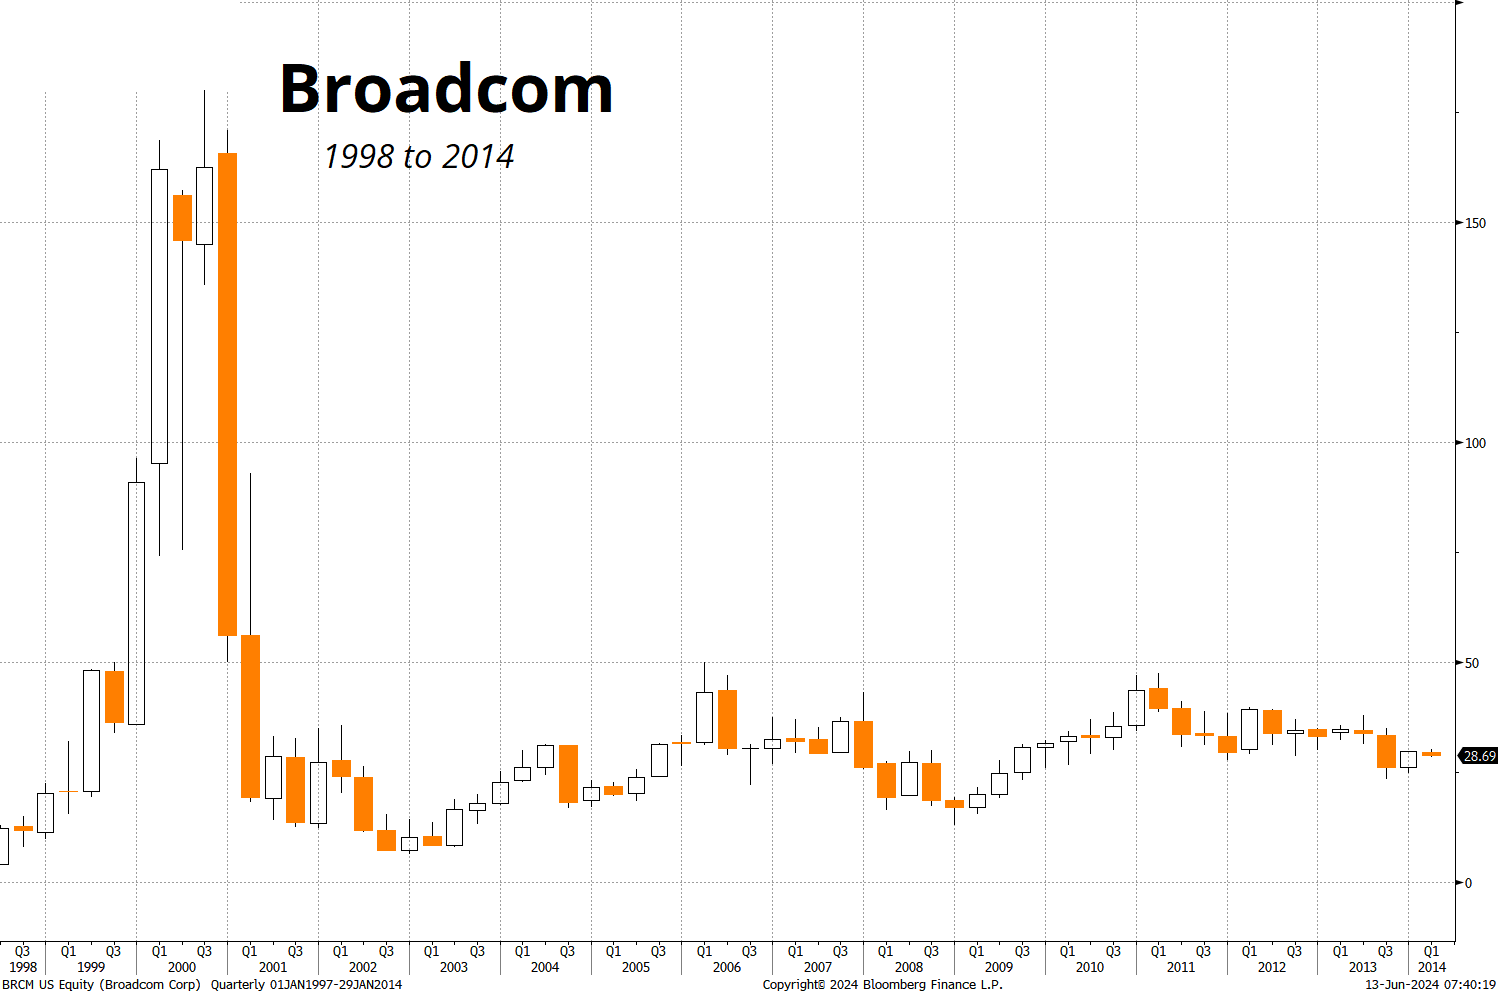
With all this tech ebullience, it should not be a surprise that Eminem (whose major label debut came out in 1999) has the #2 song on the Billboard Hot 100 right now. Like Houdini, this market has escaped the shackles of higher rates and continues to swim up, up, up.
I have no real view here; I took my shot with the 28JUN QQQ puts and barring a Lazarine reversal in those options, I will leave it alone. My philosophy on shorting indexes is that you take a shot here and there; but don’t get obsessed.
Hard is not the same thing as impossible, but sometimes it feels close. This is the kind of thing I’ll try three times a year and if it pays 6:1 once, happy days.
Mr. Bose pointed out to me that it has been difficult to trade from the short dollar side during US Treasury auction weeks of late and that seems like a logical observation in a world where most of the auctions are weak and people are still on edge about fiscal insanity and sticky inflation. The interesting thing is, though, if you look at all days where there is an auction and all days without auctions, the USD-positive effect far predates COVID.
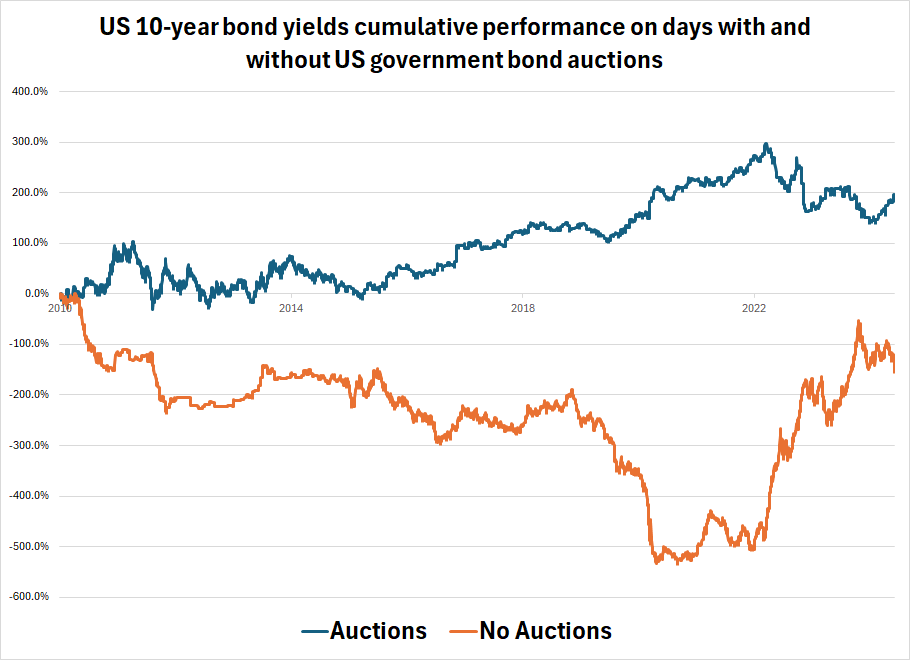
The reason seems to be simple: Yields tend to go up more on auction days. The first chart below simply sums the yield change each day if there was, or was not, an auction. (Thanks to Justin Ross for extracting this data). The y-axis doesn’t mean much, the direction is the main takeaway, but note that 10-year yields were 3.3% at the end of 2010 (when the chart starts) and they are 4.3% now, and that’s why the sum of the blue line and the orange line is (2 + (-1)) = +1 percent.
The next chart shows the same thing for the DXY. While the DXY chart ignores carry, that would not change the overall direction or message from the chart, it would simply show a bit better results for the USD overall on both legs.
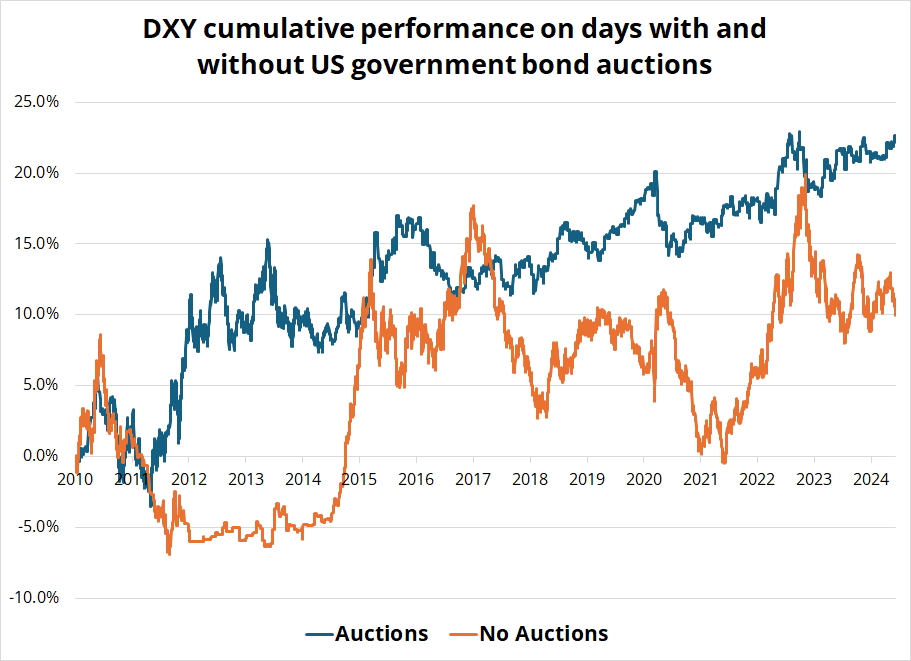
You can see the Sharpe of long USD is much better on auction days than on non-auction days, presumably because of the bias in US yields. You can also see that ECB QE in 2015 completely nullified this effect.
I think this is a modest signal that can be incorporated into timing-related decisions about when to go long or short USD. It’s not persistent enough to scream “SYSTEMATIC STRATEGY” because there are other forces impacting the USD besides US yields (see 2015 ECB QE for example). But still. Interesting. Thanks Suv.
as I am taking an old school two-weeker. This isn’t great for monthly subscribers, so we will extend all monthly subscribers by one month, for free. That is, we will extend your next renewal out by one month for free.
I will not be checking email so if you need anything related to Spectra Markets please contact Justin Ross: [email protected].
For matters related to Spectra FX Solutions (FX trading) please contact Matthew Gittins: [email protected].
I return the first week of July. See you then! Hope you come in like a wrecking ball today.
Miley Cyprus.
A map so bad, it’s good?¹
HT CR
—
¹ Nope. It’s bad.