Divergent economic indicators help the AUDNZD long. It’s not obvious what the next hype cycle in crypto will look like.
Push and Pull
It was a week of crosscurrents and contradiction

Divergent economic indicators help the AUDNZD long. It’s not obvious what the next hype cycle in crypto will look like.


Foreshadowing DJT US Equity?
Short NZDJPY @ 88.55
Stop loss 90.26
Take profit 86.01
Long AUDNZD @ 1.0954
Stop loss was 1.0834
now 1.0923
Take profit 1.1111
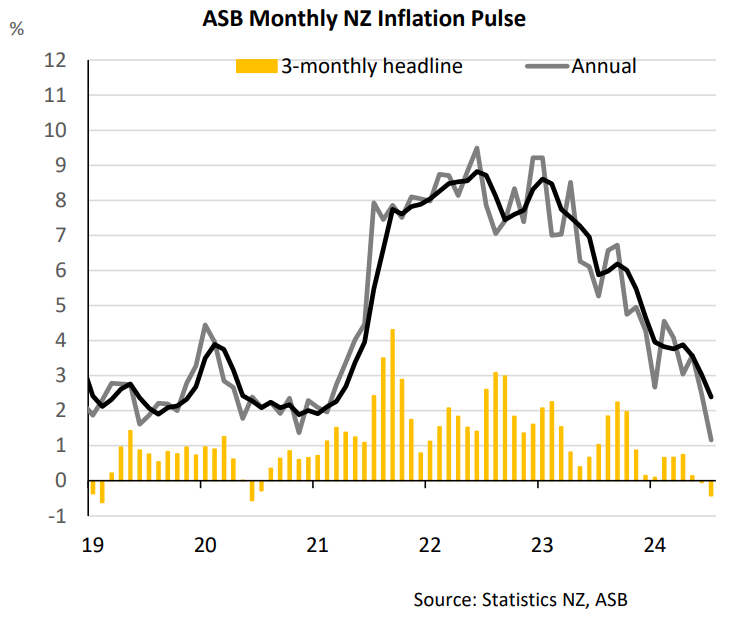
While the primary, official New Zealand CPI statistics only come out on Bloomberg once per quarter, Statistics NZ does publish a monthly series and ASB Bank (NZ) has updated their tracking of that series via this chart.

In the commentary, they note:
The monthly CPI data cover only about 45% of the CPI regimen, and include typically more volatile components, and is not intended to be used as a monthly CPI or a monthly CPI indicator. The monthly CPI data tend to be underweight for stickier services prices that have lifted core inflation lately.
Nevertheless, the data can provide a useful directional signal for overall inflation. Monthly prices rose just 0.1% in July according to our recent estimates, considerably weaker than expected. Prices were down 0.4% over the 3-months to July, the weakest 3-monthlty change since mid-2020. The moderating annual inflation impulse increases our confidence that annual CPI inflation falls below 3% by the second half of 2024. It is still early days, but the July data points to a sharper than expected moderation in annual CPI inflation than what we had previously expected.
The economic story in NZ looks pretty unambiguous: High real rates, overly restrictive policy, falling spending, falling confidence, and lots of room to lower interest rates. Orr reflected this at the RBNZ meeting as they cut and left the door open for much more. I had highlighted the big fall in NZ inflation expectations going into the RBNZ and now it’s worth noting that the opposite is happening in Australia, as inflation expectations have been rising of late. In Oz, real rates are much lower, and policy is loose. See chart.

Neither series is back down to pre-COVID levels, but a quick glance at momentum in each country shows more disinflationary momentum in NZ.
Aussie jobs also came out last night, helping the cause of the AUDNZD higher trade. Tonight at 18:30 NY we get the BusinessNZ Manufacturing PMI and then 15 minutes later NZ PPI comes out.
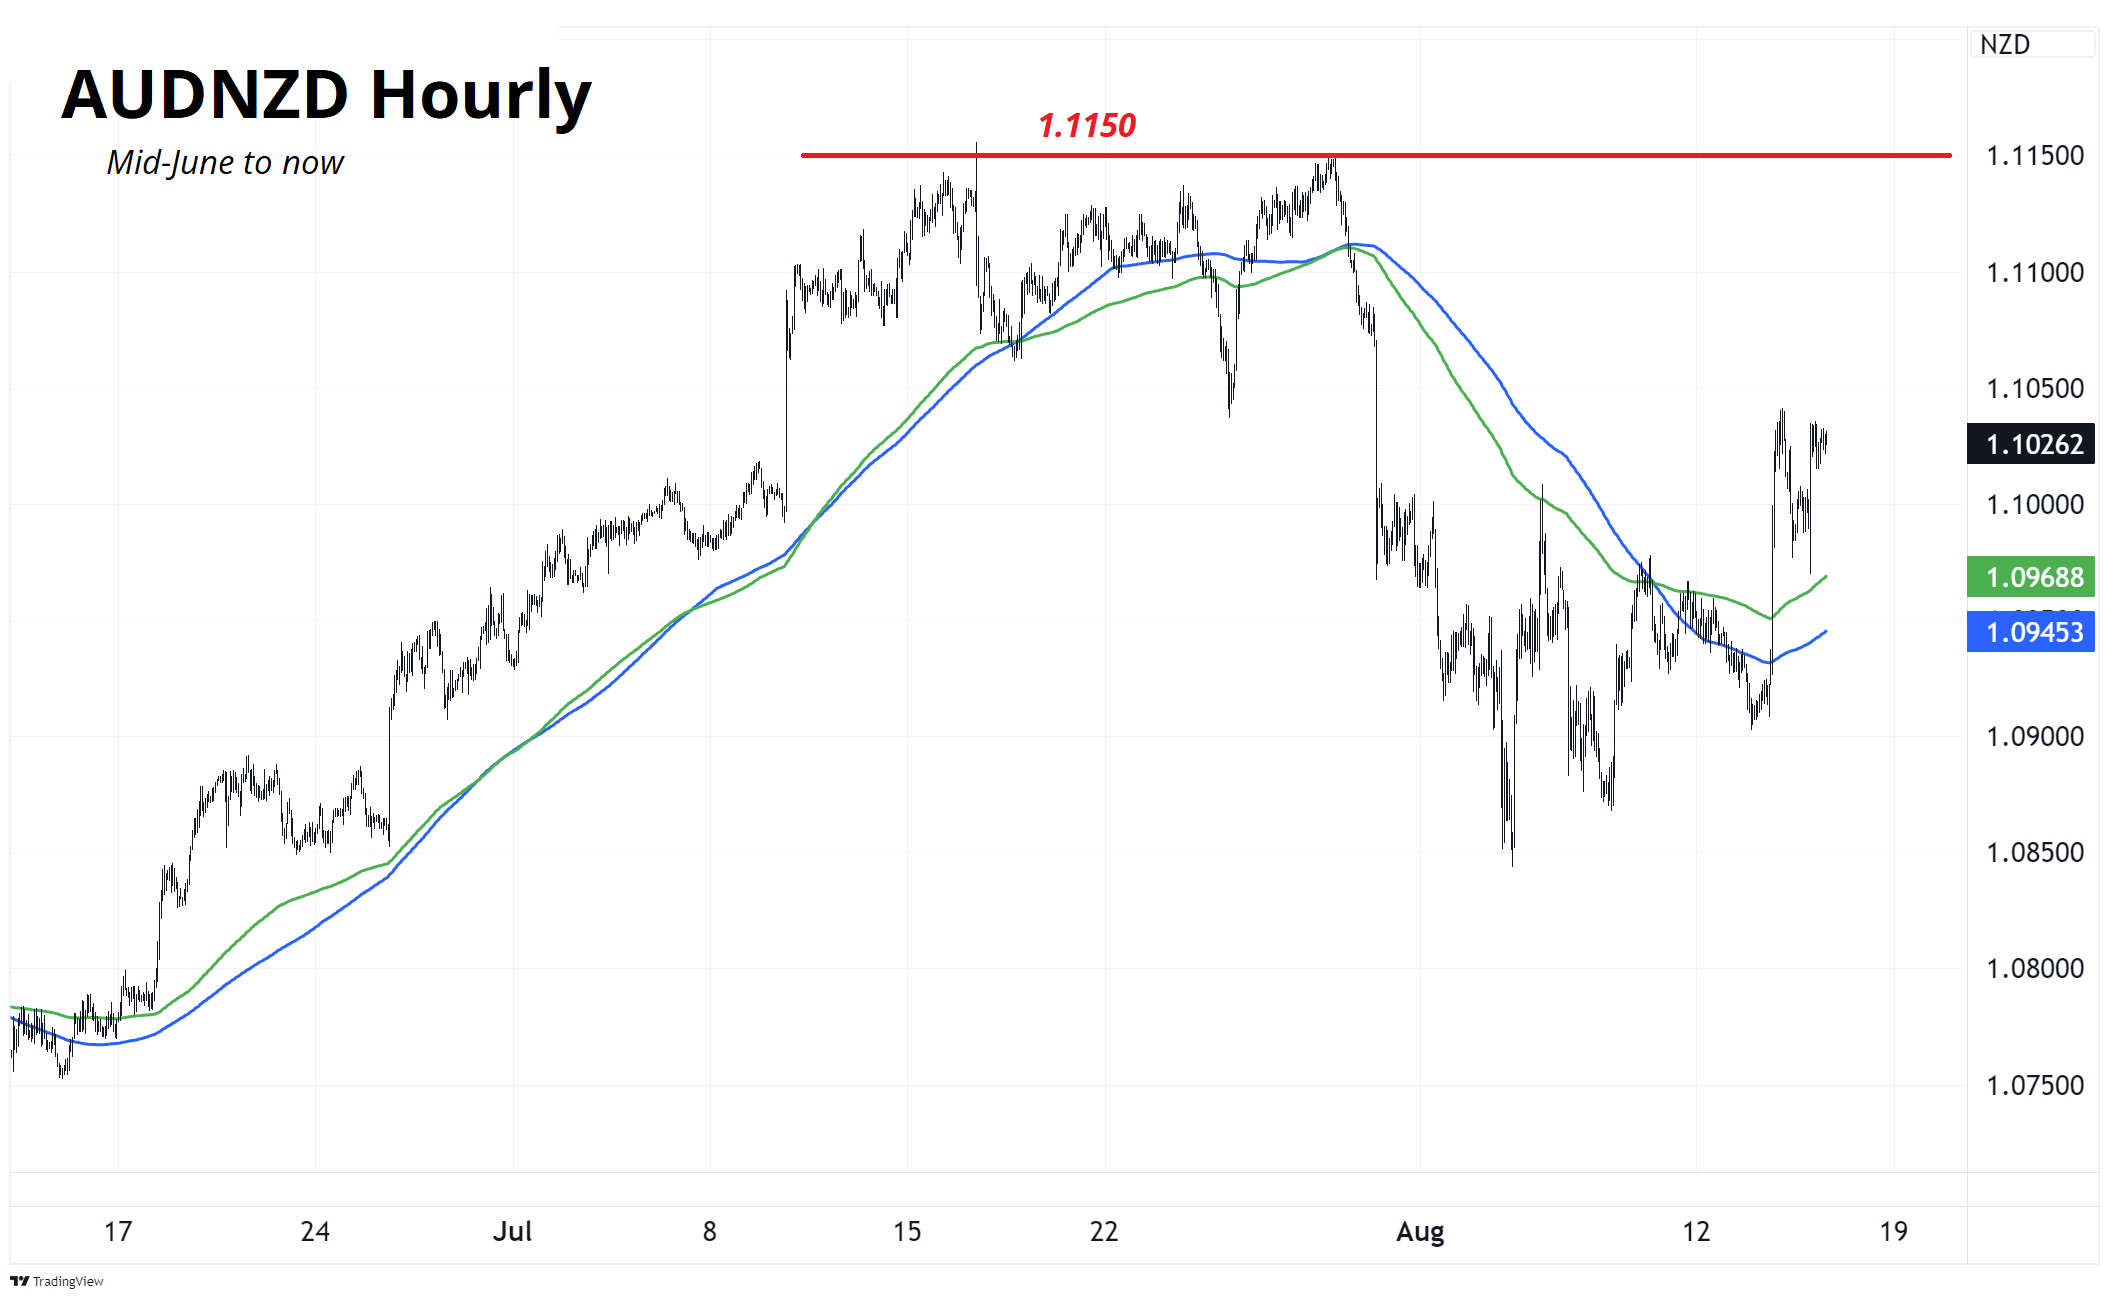
Looking at the next chart below, you see the hourly AUDNZD chart back to before the post-AU CPI bloodbath on July 30. You can see that the 200-hour MAs (green and blue lines) tracked the uptrend well in June and July and those are turning higher now and come in at 1.0945/68.
I had written yesterday that I am moving my stop up to the entry point, but I am making a small tweak as I want my stop loss below those MAs and therefore it’s at 1.0923. I don’t like moving my stop loss to an arbitrary place like my entry point—I prefer to have some technical/charty justification for my new revised level. You can also see that there is all kinds of overhead resistance at 1.1150 and that’s why I think 1.1111 is a good take profit level. Finally, note we are currently making a bull flag inside a larger bull flag. Bullish.

The spot bitcoin ETFs unleashed a new flood of demand for bitcoin, but it feels like we are now well past the peak of that most recent institutional adoption wave. ETH spot ETF buyers who jumped in at the open on day one have never been in the money, not even for 60 seconds. They are now 24% underwater and earning no yield for the privilege. Another one of the dozens of buy the rumor sell the fact moves in crypto.

I don’t find the limited supply = higher price arguments for bitcoin convincing because many financial instruments are in limited supply, including equities. In fact, bitcoin supply is rising while the supply of equities is falling. Sure, the falling supply of equities is not written in code, but it has been true for a long time!
Apple shares outstanding, for example, peaked in 2013 and have dropped 42 percent in a straight line over the past 11 years. Prices are determined by the interaction between supply and demand and if supply of BTC is perfectly known and basically static, then the price is only determined by changes in marginal demand. These changes in demand are dominated by the comings and goings of the institutional adoption story and the various hype cycles that grip and then let go of the crypto market every couple of years.
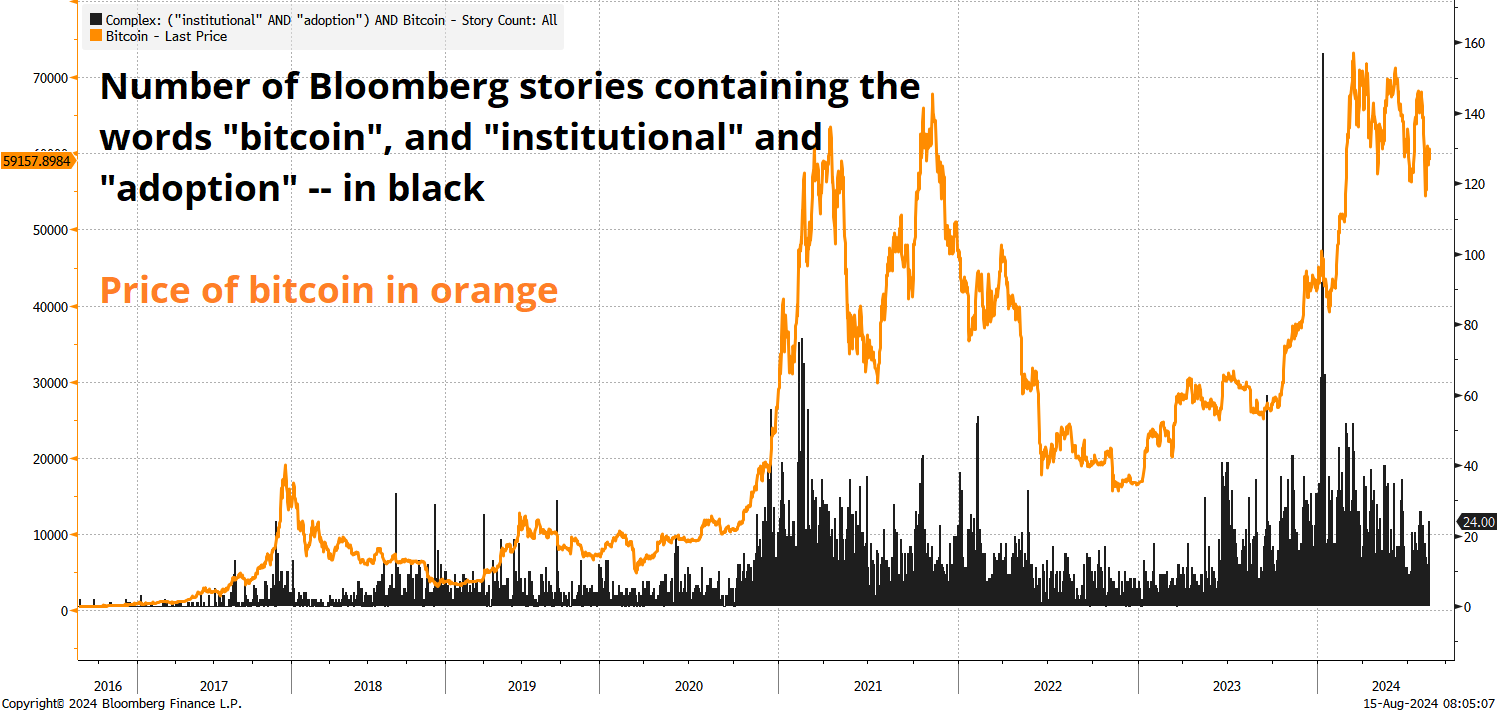
This next chart plots the number of Bloomberg stories mentioning institutional adoption of bitcoin along with the price of the coin. You can see the huge explosion in early 2021 as debasement worries grew and Bitcoin!™ went mainstream, then the massive spike in institutional interest when the spot ETFs launched in 2024.

Another way to look at this is by checking out the spot BTC ETF flows back to the January launch:

You can see that interest was there on launch, but it has petered out significantly as those that wanted the spot ETFs have now bought them, and the most recent hype cycle has lost its mojo. That last flurry of inflows at the start of June coincides with the final push and failure up at 70k. BTC has now made a series of lower highs after the false break of the 69k ATH in 2021.
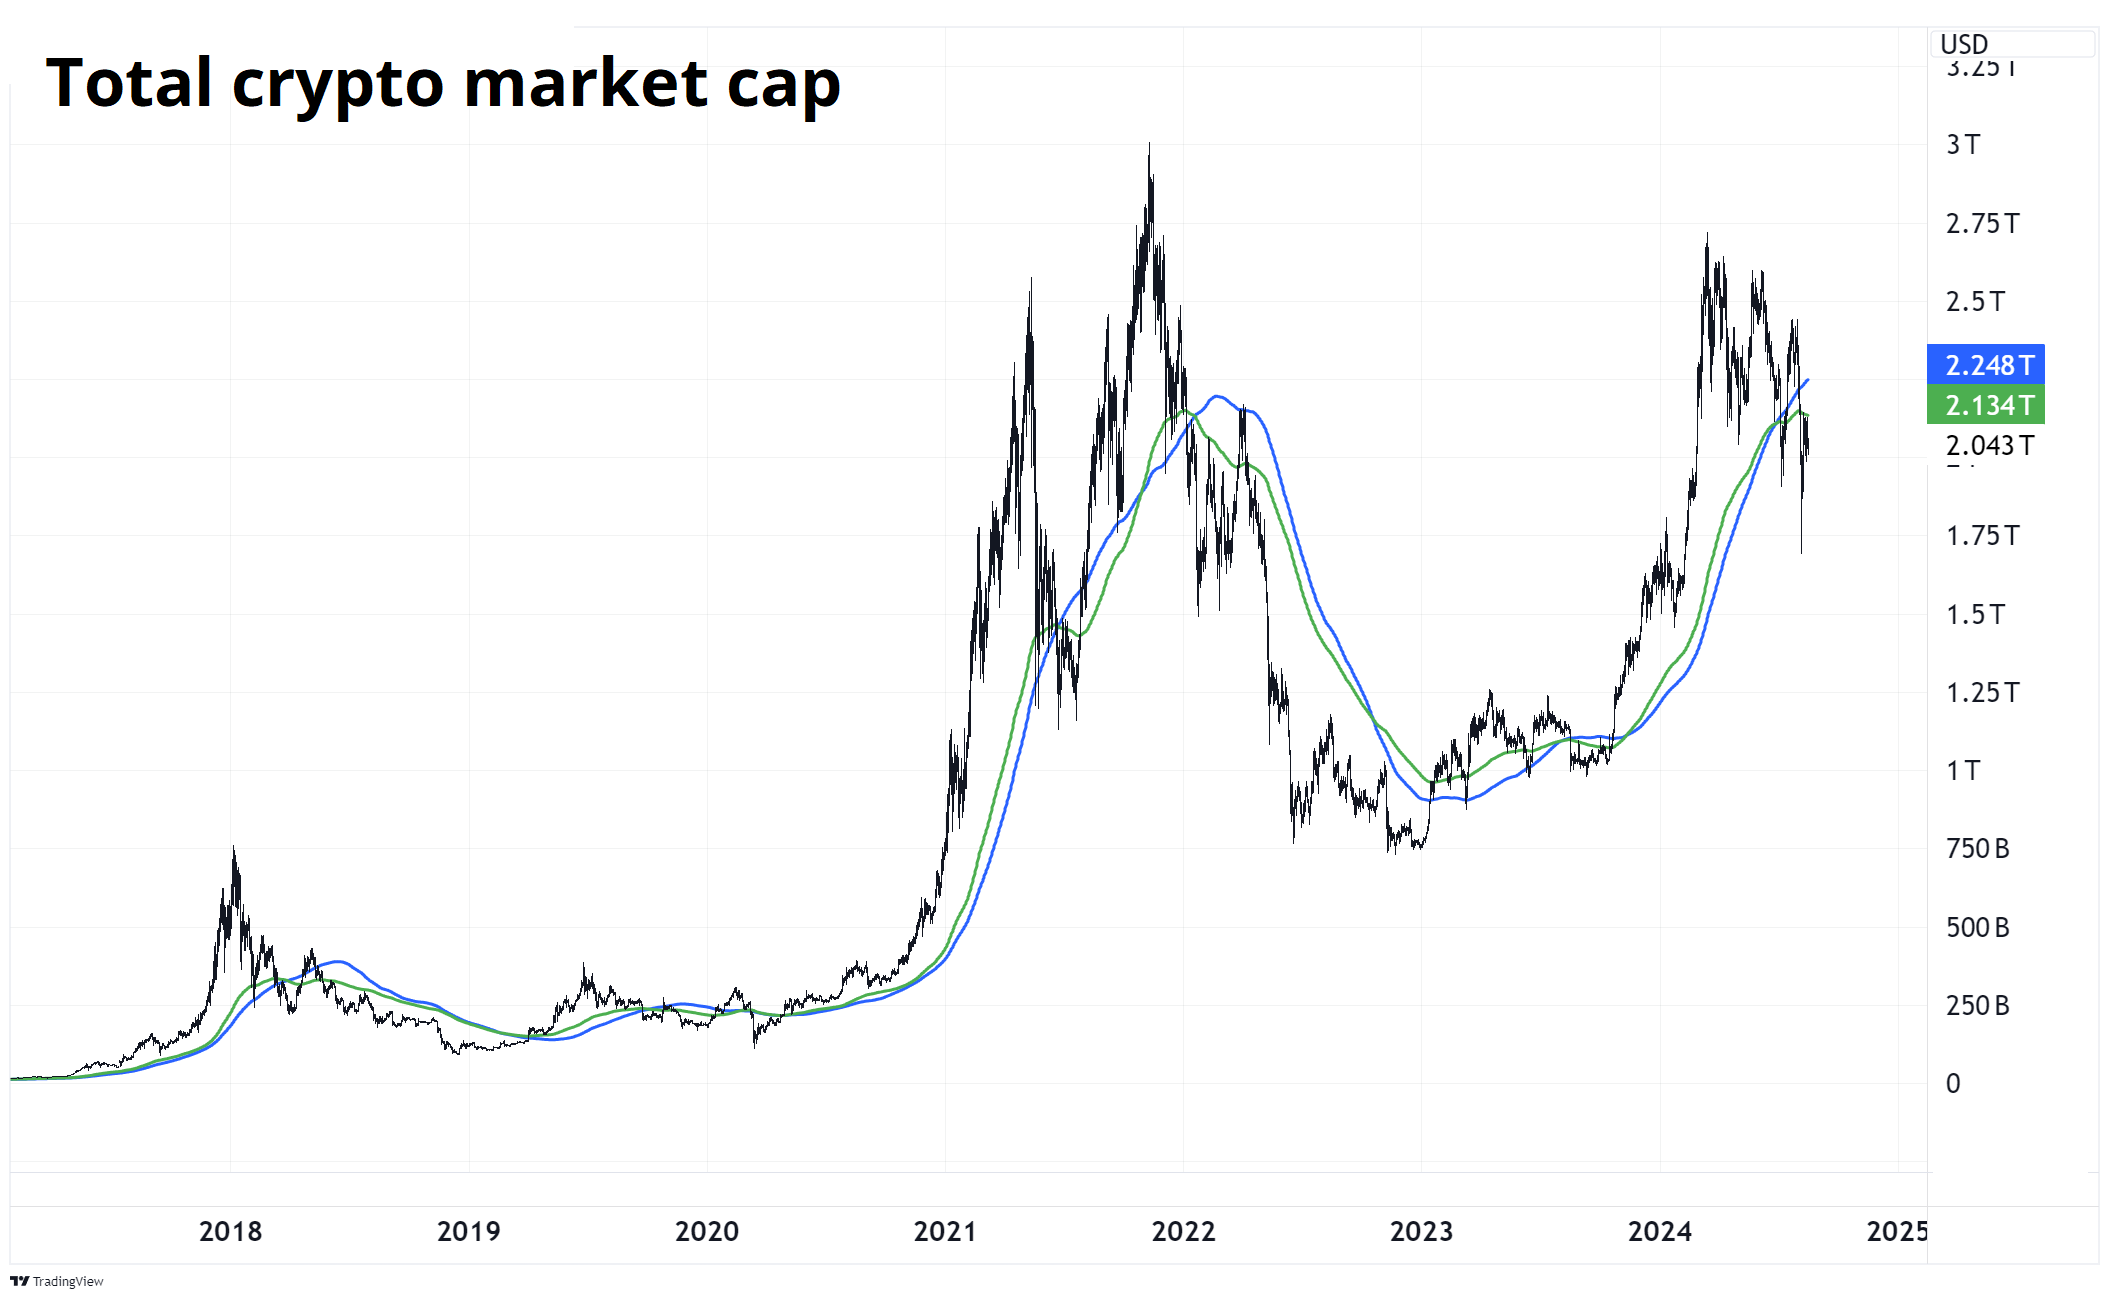
Zooming out, I have concerns.

Looking purely at crypto as an investment or tradeable asset, it’s not obvious to me what the next big catalyst will be. The asset class has been fully financialized and fully embraced by those in the mainstream that have an interest, and while there is no doubt that institutional adoption is taking place, it’s not helping the price.
I am not an expert on crypto, but when I look at the state of the crypto market from 30,000 feet, it looks played out for now. All the juicy price gains have accrued to the early adopters or the canny buy-the-dippers and maybe crypto is just dead money for a while. Perhaps the next catalyst will be central bank adoption? I’m not sure. Any ideas?
I am open to feedback on this as I do not claim to know all there is to know about crypto or BTC.
Have an asymptotic day.

Probably a good forecast for the future path of DJT US Equity
It was a week of crosscurrents and contradiction

The risk reversal is a bit of a yellow flag in euro, even though I don’t want to believe it
