Today’s note covers the big dollar and G10 views from Brazil, with my views mixed in.
Degrossed
It’s not so much the “WHY?” as the “WHAT?” that matters most in markets. Keep your eyes peeled for good news / bad price setups.

Today’s note covers the big dollar and G10 views from Brazil, with my views mixed in.
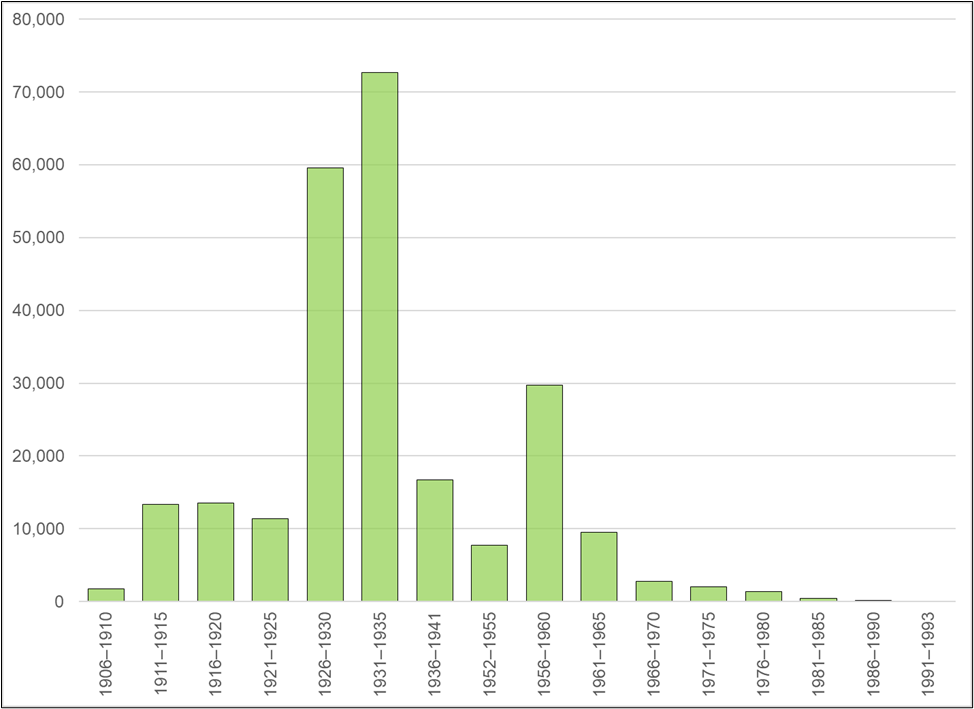

Liberdade in Sao Paulo
Brazil has the largest population of Japanese immigrants and descendants in the world (1.8 million)
First settlers arrived in 1908, escaping poverty and unemployment in Japan, and were heading for the coffee plantations of Brazil’s south which were in pressing need of laborers after the abolition of slavery.
More on last page.
1-year 7.60 USDCNH calls
off 7.2250 spot for ~52bps
This trade is in the trade performance
tracker, but I won’t leave it here past
today as it just clogs up the sidebar
February 6, 2024
One thing that came to mind on my travels to Brazil is that the world is just incomprehensibly large. I left the 20 million people of the NY-Tristate Area to visit two huge cities and perhaps met 100 out of 30 million people in the two cities I visited. When you step out of your bubble it really blows the mind how big the world is.
Following yesterday’s writeup, here are the remaining discussion points from my trip.
Clients on the trip to Brazil were pretty agnostic on the dollar. There was a clear bias to be short EUR vs. something, and long BRL vs. something, but no clear USD view. As with most of our clients, Brazilians are sympathetic to a higher USD but struggling to get involved as the Fed turns from hiker to cutter and levels look generally unattractive. I don’t think the levels matter that much. USDJPY can go back to 152 or higher. EURUSD can go back to 1.05. GBPUSD can go back to 1.23.
The challenge for trading the USD is that most rate differentials (Germany/US and UK/US, for example) are essentially unchanged since last October and rangebound. We need divergence in yields to get a substantial move either way in the USD. Most currency pairs and rate differentials are about where they were when CPI came out on November 14, 2023.
The biggest story for the dollar post-COVID is the regime change as the US has become a net exporter of energy and thus removed a major USD down regime from the matrix. In the past, the easiest short USD trade was when energy prices were ripping. Now, that regime is USD-positive! With one major USD down regime crossed off the bingo card, it’s harder to be bearish dollar.
Here’s a look at a few regimes and how the USD performed. I looked at the 2000s, 2010 to 2019 and 2021 to now because I feel those are the three main FX regimes in my career. 2000s was USD diversification ending with the GFC, 2010 to 2019 was secular stagnation and ZLB regime and 2021 to now is the post-COVID hypercycle.
The first regime to look at is oil up or down. You can see that oil up more than 1 standard deviation used to be sell USD and now it’s tiny buy. This is using change in CL and DXY in any given week.

The other regimes have been somewhat constant. Here’s 2-year yield vs. DXY.

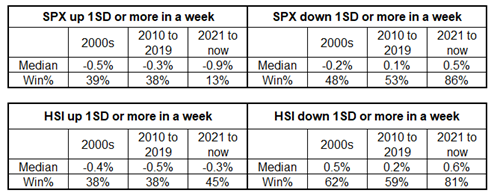
Despite the American Exceptionalism theme that percolates now and then, the reality is that big moves up in stocks have been associated with moves lower in the USD, even post-COVID. And lower stocks = higher USD. You can see the relationship with HSI has been more reliable across regimes than the relationship with SPX. This makes sense because Chinese outperformance is a good proxy for the middle of the USD smile. Tables show 1-week performance of DXY in various regimes.
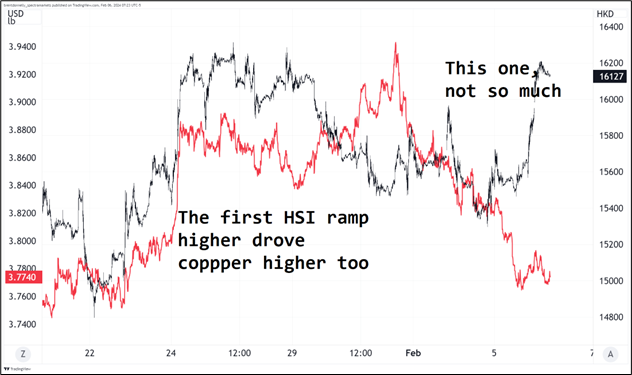
That said, the conversation in Brazil frequently touched on the idea that the current round of stimulus from China is financial, not economic stimulus and therefore the impact on the USD is less clear. If China stimulates and that boosts growth, investment, and commodities, you sell USD. But if they stimulate and that just rips stocks higher with little impact on the real economy… Is that a reason to sell USD? Probalby not. We got an interesting example overnight as unlike the first rally in Chinese stocks on the “China mulls stock market stimulus” story, the second ramp higher in Chinese stocks saw no rally in copper.
Hang Seng Index vs. copper futures
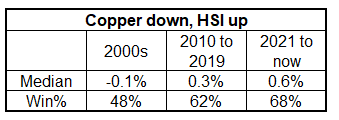
This made me curious whether it’s copper or HSI that’s the better indicator of the middle of the USD smile. You can test this by looking at weeks when copper went down and HSI went up. The results are clear: Copper down HSI up is a USD bullish regime—it’s not the middle of the dollar smile. Here’s 1-week DXY performance when copper is down and Hang Seng is up. While this was neutral in the 2000s, it’s USD bullish now.
Overall, I am more bullish USD simply because I have never been a believer in all these rate cuts, and I think the path of least resistance is higher USD. But we really need more interest rate divergence to get a meaningful move in currencies. If everyone is just priced to cut about four times this year and that doesn’t move… It’s hard to get super excited either way. For what it’s worth, I don’t think the MOF will intervene above 150 this time. 160/162 will be the new 150/152.
With such strong population growth, Canada’s economic performance is bad. The slack and vulnerabilities of the Canadian economy are on display, similar to NZ. It seems hard to believe the Fed will cut more than the BoC this year and yet Canada is priced for 3.3 and the US is priced for 4.5. Still, without a catalyst, USDCAD just floats around. Directionless.
There is quite a lot of attention on this Friday’s revisions to CPI. Remember that on January 16, Waller said:
One piece of data I will be watching closely is the scheduled revisions to CPI inflation due next month. Recall that a year ago, when it looked like inflation was coming down quickly, the annual update to the seasonal factors erased those gains. In mid-February, we will get the January CPI report and revisions for 2023, potentially changing the picture on inflation. My hope is that the revisions confirm the progress we have seen, but good policy is based on data and not hope.
I’m not a fan of the way everyone looks at 3-month and 6-month annualized and extrapolates benign YoY outcomes. If you did that in 2021, you would have thought inflation was going to 15% or something. 3m annualized changes dramatically each month as you drop 33% of your inputs and get a new replacement figure. If the structure of the past inflation data changes due to adjustments and they drop the back-end data and raise the more recent figures, the 3m and 6m annualized figures will look less rosy. More background in a Fed blog here. The data should come out on the BLS website at 8:30 a.m., though the first headline I could find on Bloomberg for last year was stamped 8:53 a.m.
Europe is stuck in the middle of a trade war and there is a high likelihood trade wars will escalate over the next 12 months. China has been subsidizing various industries like EVs, defense, and semis while the US has been funding multinational factory building in the US, but the EU has a much harder time with tariffs and subsidies due to the fragmented, multinational political system. China and the US can slap on tariffs and do internal subsidies much easier than the EU.
Related:
https://www.noahpinion.blog/p/tariffs-are-coming
Trump is bullish USD because of tariffs, not economic policy. While most agree Biden and Trump would run similar MMT-style procyclical fiscal policy (Trump tax cuts, Biden domestic investment)… The big difference is the 10% global tariff envisioned by Trump. That’s mechanically USD-bullish.
Finally, a couple of thoughts on the US data.
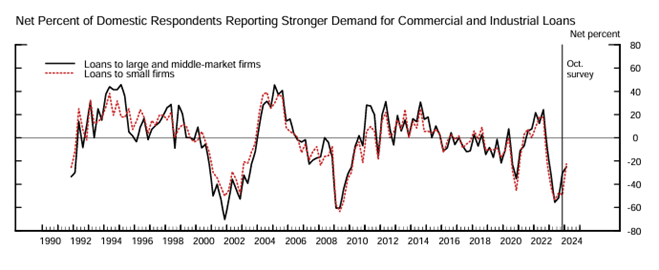
Instead, there’s still a huge cohort of analysts finding fault with every number, including yesterday’s release of the SLOOS. The SLOOS has turned more optimistic so now people are saying “yeah but the levels are still bad.” Yes, but they’re getting better, just like you would see as a mid-cycle slowdown bottoms out.
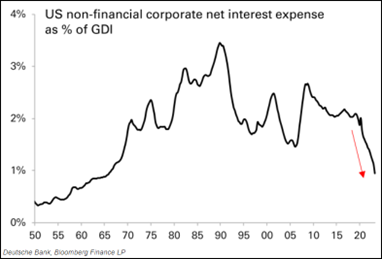
US corporates are incredibly well-positioned and have rolled their debt so successfully that rate hikes from 0% to 5.5% have led to lower interest payments in aggregate. Here’s a chart from George Saravelos via John Authers.
If the current economic expansion was on cruise control even when SLOOS was at 2008 levels, imagine if credit demand picks up again! Even a bit!
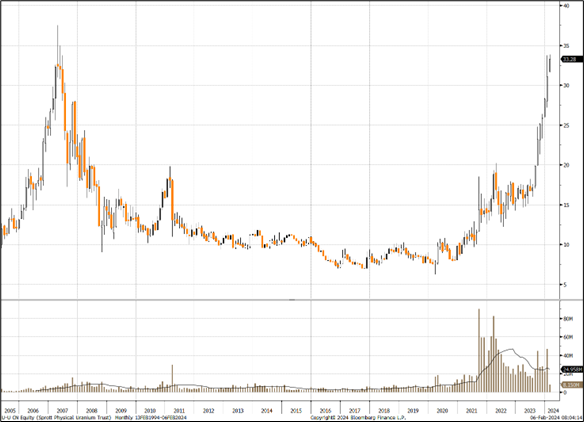
Even in Brazil, the consensus long uranium view came up a few times. I know nothing about it, but this retail fervor for uranium reminds me of 3-D printing in 2012. Or umm.. Uranium in 2007. Note declining volumes on this leg of the rally too.
Sprott Uranium Trust, 2005 to now
Good sushi in São Paulo: https://guide.michelin.com/us/en/sao-paulo-region/sao-paulo/restaurant/huto
The Spectra FX Positioning and Momentum Report
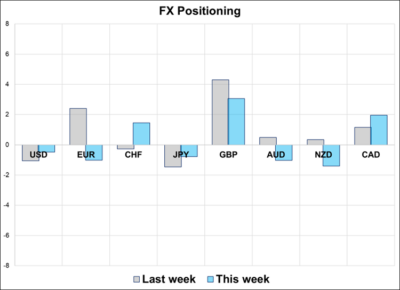
Hi. Welcome to this week’s report. The USD position is near zero as CTAs remain long, fast money has been whipsawed by the idiosyncratic, non-systemic New York Community Bancorp news, and real money remains mostly parked in high-carry / low-vol emerging markets FX. Weirdly, the CFTC continues to buy and sell GBP at the worst possible times.
Three Observations
1. The overall scores show a low trader commitment to FX overall, and this is consistent with client conversations as risk is mostly concentrated in rates markets as currency themes have been ephemeral. The G10 vibes in Brazil match this as most Brazilian HF managers are bearish EUR, long BRL, and active in various crosses with no strong commitment to the big dollar. Last week’s wild price action with the banking jitters followed by Mitchell-Hooper-strong US data caused much trading pain and few gains.
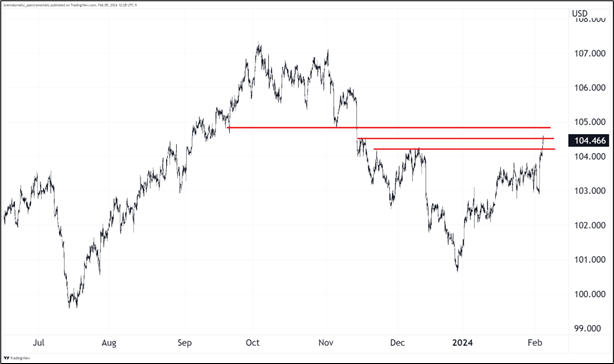
While some clients refuse to buy USD because of the levels… We are only back to 50% recovery from the November CPI Day sell off in the USD. There are three lines of resistance on the chart. From lowest to highest they are: the December double top (broken), the November bounce high (right here), and the base of the SEP-NOV 2023 range at 104.75 (broken support becomes resistance). Through 105 you have 106 and then 107 as two more layers of resistance before the 2023 high of 107.40. The 2022 high was 115.00.
DXY hourly, summer 2023 to now, with nearby resistance marked
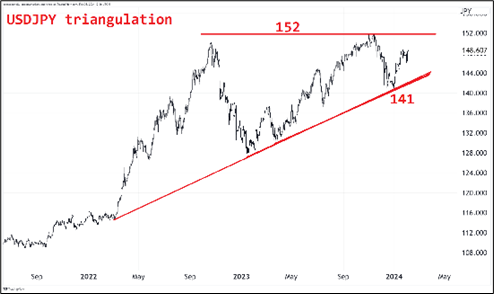
2. Carry traders and CTAs are still long USDJPY but specs have given up on the trade completely as the BOJ story looks to be dead, everyone likes yields lower, and there is some lingering concern that the MOF might intervene again at 150/152. Given MOF interventions tend to rely on a combination of USDJPY speed and level, we believe it’s unlikely they will intervene at 150/152 this time. We first got up to 150 a year and a half ago and we have been above 140 for eight months. Therefore, the speed condition is not met. 160/162 is the new 150/152.
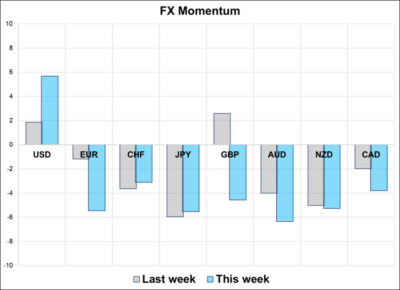
3. GBPUSD positioning shows the market long while momentum is negative. This is a fairly common occurrence in our data set (this report started October 2022) and it’s mildly bearish. One month after this condition, GBPUSD is down an average of 30bps and down 8 of 12 times. The effect is not huge but if you plot it on a chart (see below), you can see that positioning stays stubbornly long cable even as momentum drops.
GBPUSD daily marked with times Spectra positioning score was long GBP and momentum score was negative marked in purple

GBPUSD is too oversold to take action here (it’s overly stretched vs. the 100-hour MA, for example), but it is worth noting once again that GBP positioning tends to be a good-to-excellent reverse indicator throughout the 1.5-year existence of this report. This is partially a reflection of the lack of trend in GBP, but also reflects shockingly bad GBPUSD timing on the part of the CFTC.
—
G10 FX Positioning and Momentum Scores

That’s this week’s report. Thank you for reading.
It’s not so much the “WHY?” as the “WHAT?” that matters most in markets. Keep your eyes peeled for good news / bad price setups.

Taking profit on the USDJPY and looking for a way to get short GBPUSD for corporate month end.
