The days of 1% S&P 500 moves might be in the rearview

Adult thinks: Ugh, I need to kill those, they are so ugly and my neighbors are going to hate me.
Child says: “Mommy, look at all the beautiful yellow flowers!”

The days of 1% S&P 500 moves might be in the rearview

Adult thinks: Ugh, I need to kill those, they are so ugly and my neighbors are going to hate me.
Child says: “Mommy, look at all the beautiful yellow flowers!”
Short USDCHF vol expiring 30APR
Sell put spread: 0.7800/0.7780
Sell call spread: 0.7860/0.7880
Risk 1 to make 1.1
I have written in the past about why skew matters when assessing overbought and oversold signals. USDJPY extreme oversold, for example, is a buy but overbought USDJPY is not a sell because USDJPY goes down fast and up slow. Same deal with stocks. This asymmetry is further compounded in stocks because of the mega positive drift in the stock market across whatever sample you choose.
Right now, the VIX is down and SPX is up five days in a row. This is a somewhat overbought condition you don’t see very often. Out of more than 4,000 trading days back to the start of 2010, you only saw this 22 times. Is that a reason to expect a reversal? No. 20-day forward returns are maybe a tiny bit worse than if we were not in this state, but barely. Here is the data. Note the small samples when you get above five days in a row.

I do feel like we are in for a consolidation at this point, not because we are overbought but simply because people are burnt out and the market cannot sustain wild energy for long periods without new stimulation from news flow. And the news flow is sparse right now. Making matters worse, the economic data is completely irrelevant for a few months until the war filters through to the lagging nature of the releases.
No news is good news, but it’s not going to be enough to trigger another series of 1% daily gains for stocks. We should settle into the normal 17 VIX kind of regime where the average daily change for the S&P 500 is 0.6%.
In the next charts, I show a scatter of VIX vs. change in SPX using daily data back to 2010. The first one shows all the data and the second one shows only when VIX is 20 or lower.
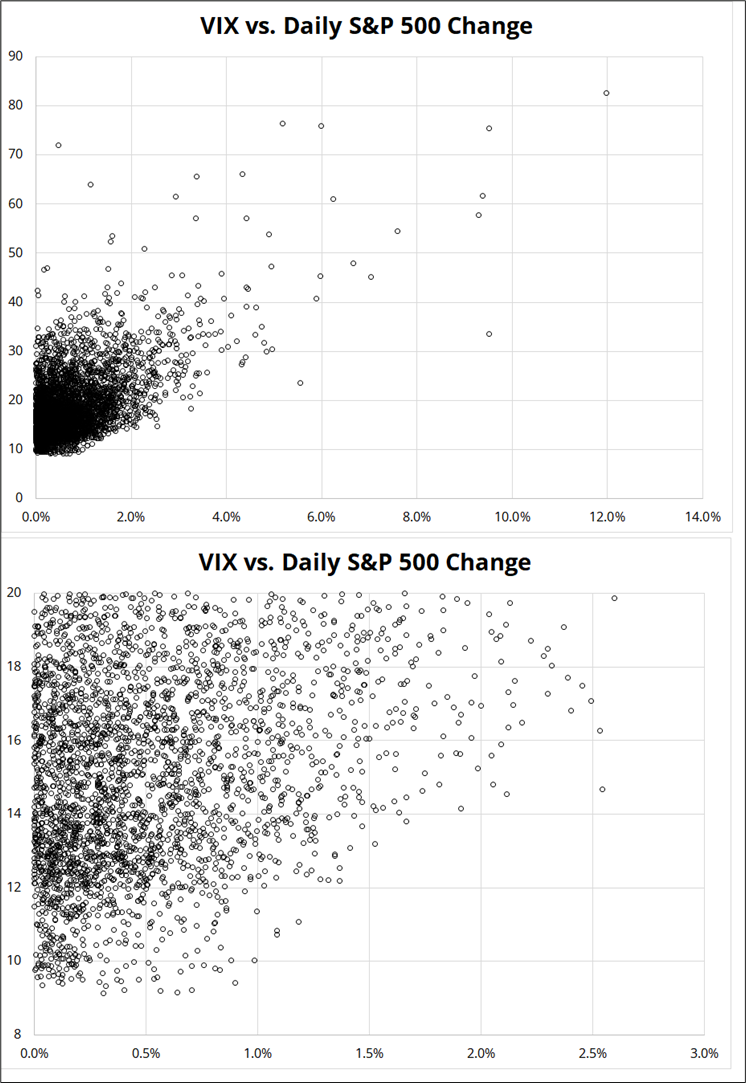
This is all stuff you know, but it’s a reminder that we have just switched regimes here and are probably back into something that’s a bit less wild. Trade accordingly.
The policy shock in 2025 (Liberation Day) and the one in 2026 (War in Iran) came around the same time of year and feel similar. The walkback/turnaround and the recapture of the 200-day MA in one quick jump both rhyme. But when I overlay the two, you can see that the Liberation Day shock was much more of a quick smackdown and rebound, whereas the war trade was a 1-month grinder. I suppose one takeaway from the chart was that if you were slow to FOMO back into stocks in April/May 2025, you never got much of a dip.
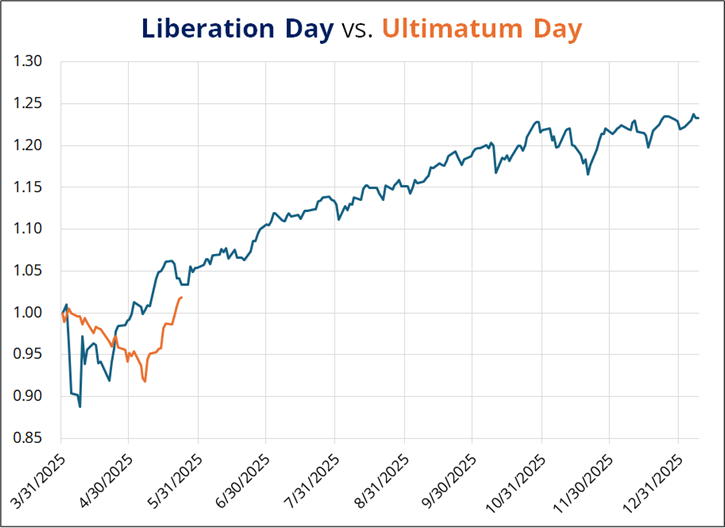
The chart shows S&P 500 rescaled to 1.0 one week before the policy shock.
I will write more about this concept in Friday Speedrun later, but I think the equity market takeaway for now is that the market is more worried about the shortage of AI tokens than it is about the shortage of oil. Frequent outages and issues with Claude this week only further highlight the enormous strain on the inference ecostructure.
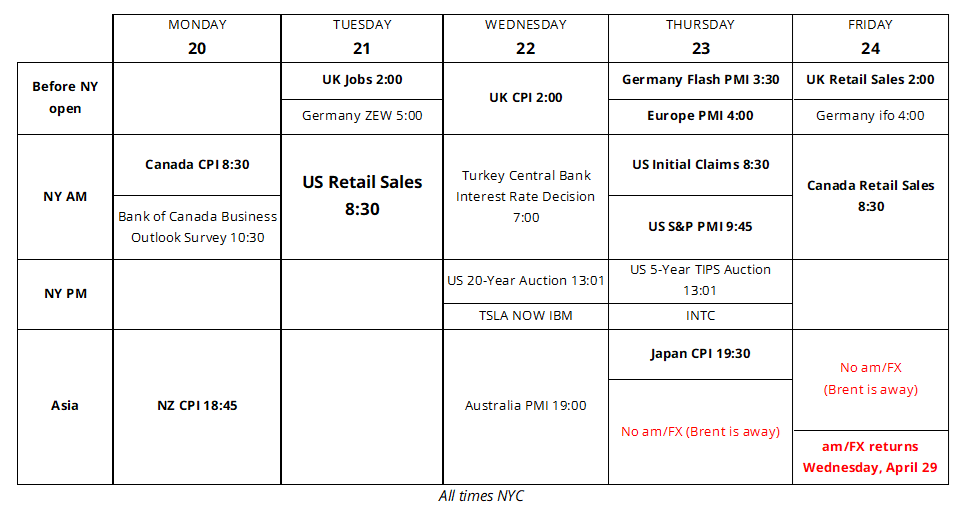
As discussed earlier, the economic calendar feels a tad irrelevant, but I figured I’d make one anyway, just in case. I suppose you could say that Retail Sales are potentially interesting as we check in to see how the U.S. consumer is adapting to the current gasoline price rise. Most of the high-frequency stuff from the banks suggests that the consumer remains okay. The high end keep spending and the low end struggle in silence as equities ramp to the ATH.
I have been leaning bearish USD since turn of the month, but I think this is a good zone to take some profits. I don’t expect a reversal, just a loss of momentum and a consolidation. USDCAD specifically is at the first big target. The chart looks like a bit of a mess, but the takeaway is simply that the two spike lows in March were 1.3650 and 1.3680 and the 1.3650 level has been a pivot in both directions a few times. Covering short USDCAD here, especially if it’s via long vol, is probably a decent idea. My base case is we chop 1.3650/1.3750 for a while.
The lack of participation from USDJPY and USDCNH this week also makes me wonder a bit about whether we stall here as the DXY chart is now midrange in nowhere land. Here’s this week’s FX performance, by currency, vol-adjusted by number of daily ranges it moved.
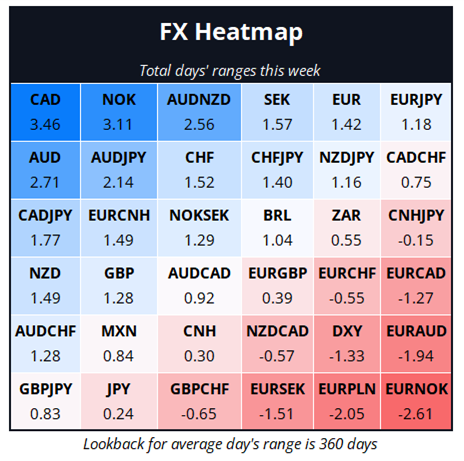
CAD and NOK played catchup while CNH and JPY flatlined.
I wish you a wild, beautiful, and colorful weekend.
Adult thinks: Ugh, I need to kill those, they are so ugly and my neighbors are going to hate me.
Child says: “Mommy, look at all the beautiful yellow flowers!”
