Inflation down, yields up.
The world is a vampire.

Inflation down, yields up.
The world is a vampire.

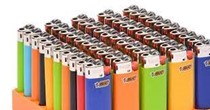
Lighters were invented before matches.
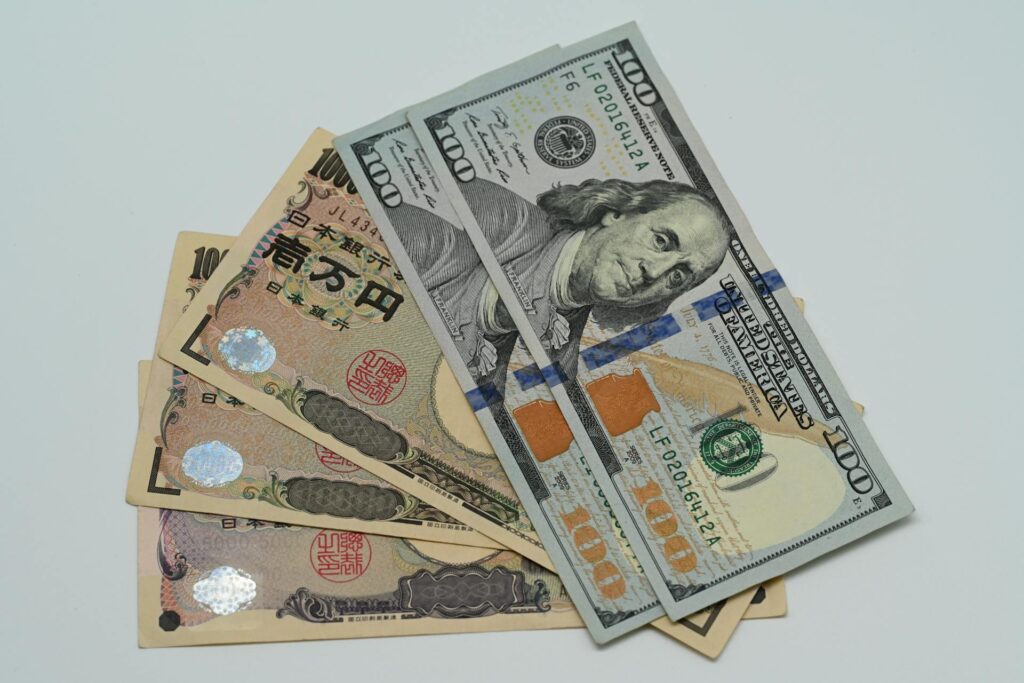
Go short USDJPY at 150.09
(limit order)
Stop loss 152.26
Take profit 146.57
October 5, 2023
As structural and supply/demand factors have dominated markets over the past quarter, standard macroeconomics has taken a back seat. US economic surprises peaked in July, the US jobs market is normalizing, inflation is surprising to the downside in many countries, but any concern about the global economy (or joy over falling inflation) has taken a back seat to bond supply, a global repricing of interest rates, OPEC gamesmanship and downside bond market momentum. Here is a chart comparing inflation to US 10-year yields.
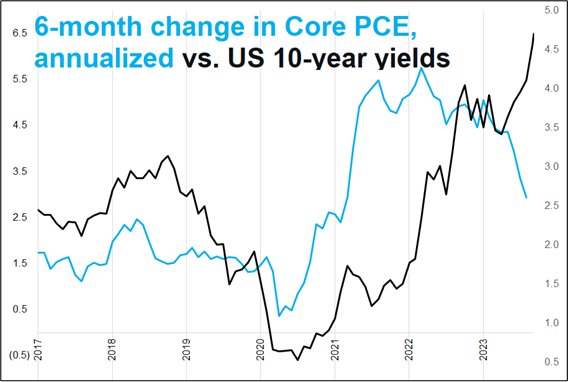
Traders who went long bonds looking for lower inflation have found their prescience rewarded with a boot to the head. Yields are a pure momentum trade and it’s hard not to wonder if the bond vigilantes have landed on US and Japanese soil.
While my memory is more like Dory’s than Rajeev Meena’s, this chart reminded me of the very first am/FX I wrote at Spectra. At that time, inflation was rising but bond yields were going the other way. Here’s a screenshot from that 14SEP21 piece (am/FX: Unanchored).
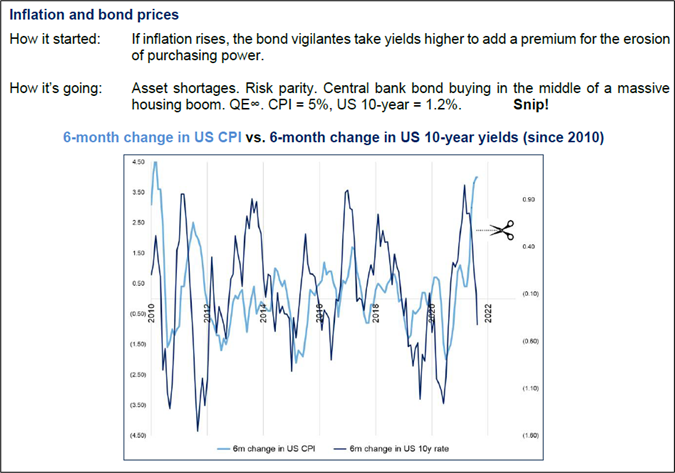
Bonds were wrong that time. Unless they are pricing a debt crisis, they are probably wrong again this time. We will see.
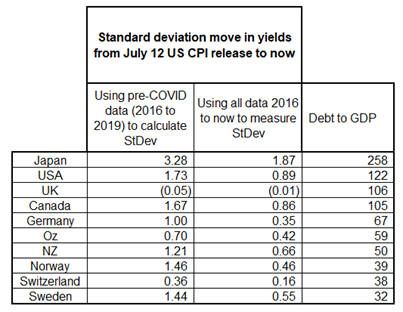
If this move in global yields was partially related to concern about debt levels and the rise of the bond vigilantes, one might expect to see a relationship between gross debt levels and the change in yields for various countries. Here is the data: The move in yields started off the lows made on July 12 as US CPI came in weak. Yields have gone straight up since then. I calculated the standard deviation of yield moves using both pre- and post-COVID because I think that provides greater context, but you can just look at the first column of numbers or the second one to compare country by country. Japanese yields have moved twice as much as any other country.
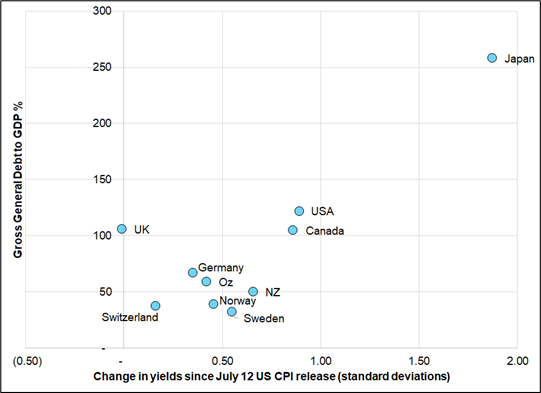
While this is probably a lot more about starting levels and extreme low volatility in Japanese yields pre-2020, there does seem to be vague connection between debt levels and yield moves. The UK is a major exception as yields there are flat since July but maybe you could argue the vigilantes already had their turn with the United Kingdom back in 2022.
What’s that you just said? You would like to see the data on a scatterplot? Ok!
The gross debt to GDP data comes from the IMF and here is a map of that data.
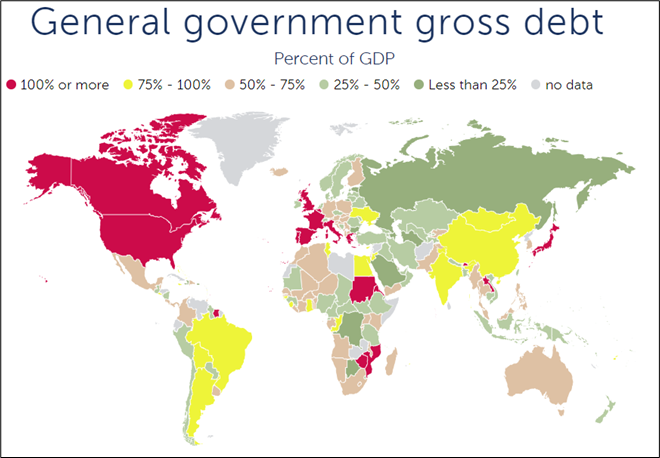
https://www.imf.org/external/datamapper/GGXWDG_NGDP@WEO/OEMDC/ADVEC/WEOWORLD
Debt is a stock and GDP is a flow, so you can question the usefulness of debt/GDP but as interest rates rise, the debt/GDP equation matters because interest payments are a flow and so is GDP. So debt/GDP is not a stupid stock vs. flow comparison if it flows through to flow vs. flow. Which it will as rates rise and the US rolls at worse yields.
I’m always torn on this stuff because it’s been an evergreen doom and gloom story since 1985 or so, but if the market cares about it, I will start to care about it. Does the evidence I have supplied show a clear connection between yield changes and debt/GDP levels? Not really. Japanese yields are going up the most because they were the most suppressed. Does it suggest that individual debt levels are contributing to current yield moves? Probably. Swiss rates were just as low as Japanese yields and they are not going nuts. But then again, Swiss inflation is falling and Japanese inflation is rising. It’s complicated.
No call to action here, just some food for thought.
A weird but understandable aspect of USDCAD over this three months of relentlessly rising yields is that it has maintained its negative correlation to oil BUT oil has gone up and USDCAD has gone up. This is possible when the reaction function of the currency is asymmetrical so when oil goes down, USDCAD goes up a lot and when oil goes up, USDCAD goes down a little.
I created a chart of the running change in USDCAD, separating up days in crude from down days. The result is interesting and explanatory.
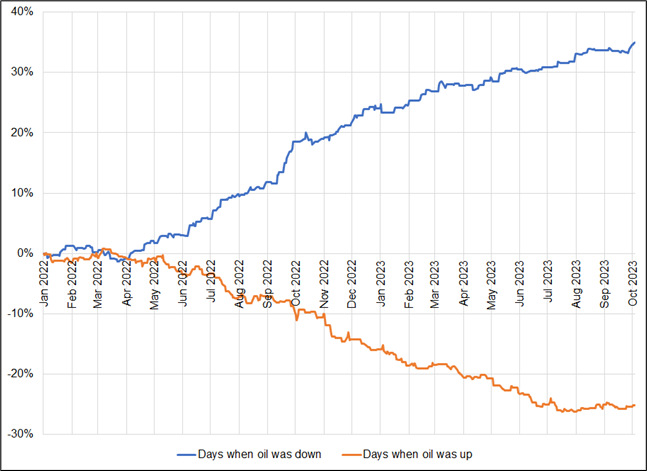
In the period covered by that chart (January 2022 to now), oil has gone from 76 to 84 while USDCAD has gone from 1.2750 to 1.3730. Yet in this period, USDCAD had an inverse correlation to oil (-34%).

You can see how the orange line (USDCAD performance on days when NYMEX crude goes up) flatlined right in mid-July when the bond market spew began. This is another example of how you can be right (bullish oil) and lose money (short USDCAD) when trading proxies. Even when you get the direction of one variable AND the correlation right, you can still lose money.
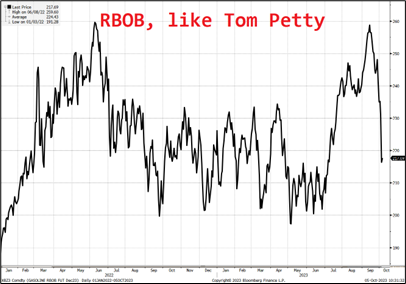
A good short read: https://squareman.substack.com/p/ghosts
Have a lit day.

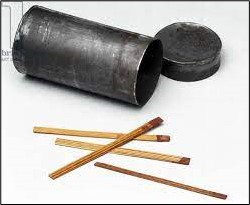
Matches, originally called “friction lights” were invented in 1826. That year, John Walker, a chemist in Stockton on Tees, discovered through lucky accident that a stick coated with chemicals burst into flame when scraped across his hearth at home. He went on to invent the first friction match.
The first real lighter was invented in 1823 though impromptu lighters made from pistols were fashioned much earlier. The first Zippo came out in 1933.


A sort of almost unbelievably large move in Brazil. Plus: Short CADJPY.

NZD has a bunch of bullish kickers: Election, seasonality, and inflation