The Esteemed Chairman has a second chance to say what he really means today.

Do you recognize this guy?

The Esteemed Chairman has a second chance to say what he really means today.
Do you recognize this guy?
Long USDJPY @ 132.08
Stop loss 130.34
Take profit 134.69
Long USDCAD @ 1.3393
Stop loss 1.3279
Take profit 1.3644
Long 07FEB EURGBP call
spread 0.8870/0.8920
(expires today)
February 7, 2023
Powell is the only thing that matters today as we see whether he changes tune on total indifference to the loosening in US financial conditions since June. Post his dovish FOMC, we’ve got a huge bounce in ISM and New Orders and the lowest Unemployment Rate in my lifetime. The last time the UR was 3.4, the Beatles were recording Abbey Road and Neil Armstrong was getting ready for his trip to the moon. Below, just for fun, a list of all the months where US Unemployment was below 3.5%.

If the esteemed Chairman feels like the market reaction to his presser and/or the subsequent run of data has the Fed message offside, he can set the record straight today. There is room for huge volatility today at noon as the market should react whether Powell holds the line on the “disinflation, we won!” narrative or delivers something more squeamish.
Sidenote with regard to that table above: There was a recession in July 1953. And another in December 1969. That is to say, extremely low unemployment is a normal condition right before the start of a recession, but the timing is impossible. Unemployment was extremely low in 1951, 1952, and 1953, then recession. It was extremely low from 1966 to 1969, then recession. A very low UR is not a sign that recession is imminent, nor is it a sign that recession is not imminent. It’s a lagging indicator.
I think risk/reward into Powell is to bet on a hawkish outcome and higher dollar because the weak side in fixed income continues to be higher yields and the short USD positions are not yet completely cleansed. The market can’t process the change in narrative fast enough.
Also, the bearish equity signal from (VIX up + SPX up >1%) since stocks closed last Thursday at 4179 (see am/FX: Stocks down, USDCAD up) is still in force. The half-life of the signal in the past has been about 5 trading days, so it’s reasonable to stay bearish into Wednesday/Thursday. Obviously Powell matters most today, but we are still in the window where excess euphoria can continue to unwind and that reinforces the asymmetry through the Chairman’s interview at the Economic Club of Washington. There is no prepared text, so Powell has a chance to freestyle today.
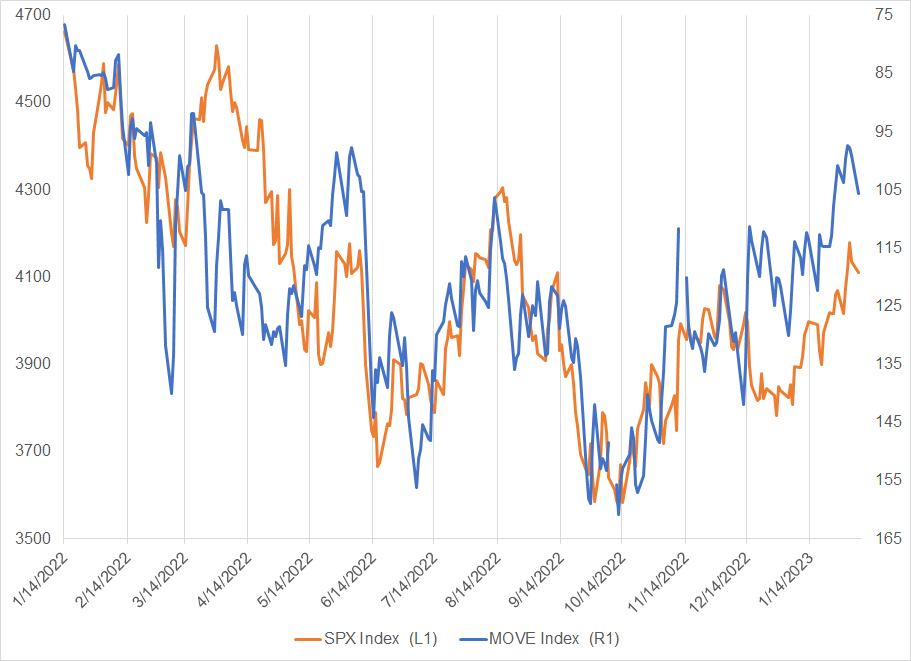
Keep in mind that a critical facet of the equation for equity markets is the volatility of yields. The stock market can handle slowly rising rates but higher rate vol and higher rates at the same time is generally bad for stocks.
Here’s a chart of the MOVE Index (1-month, yield curve weighted bond volatility) vs. SPX over the past year or so. Bond market volatility is in blue and the series is inverted because higher bond market vol = lower stocks, generally.
While Powell is key today, the other key to the bond market will be the January data for the US. It looks like we might have hit some kind of crazy sentiment extreme in December and the January data look substantially better around the world as China reopening hopes and warm weather in Europe have helped steer us away from the abyss. Here is a heat map so you can see what has come out so far. The first four lines are ISM and ISM new orders, then you have the various jobs figures and then NAHB housing and Michigan.
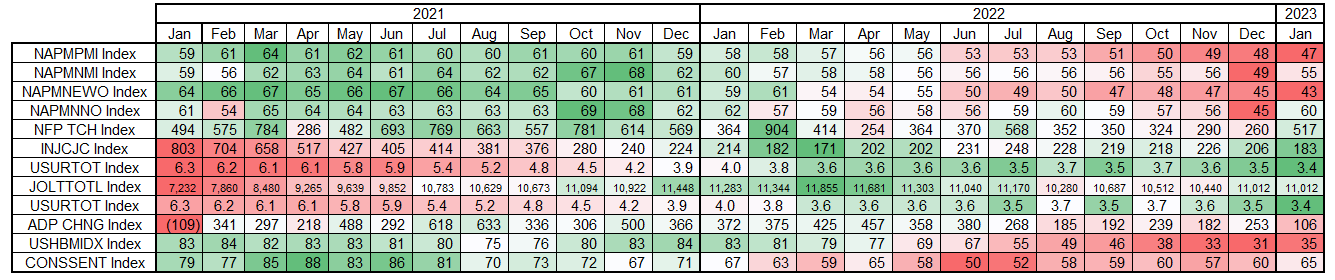
The persistent strength of the jobs market stands out, as does the bottomy look to the December data. We need more Q1 2023 data to get a clearer view of what’s going on because sentiment data are all over the place and jobs data don’t tell us much since we have known the US jobs market is tight for more than a year.
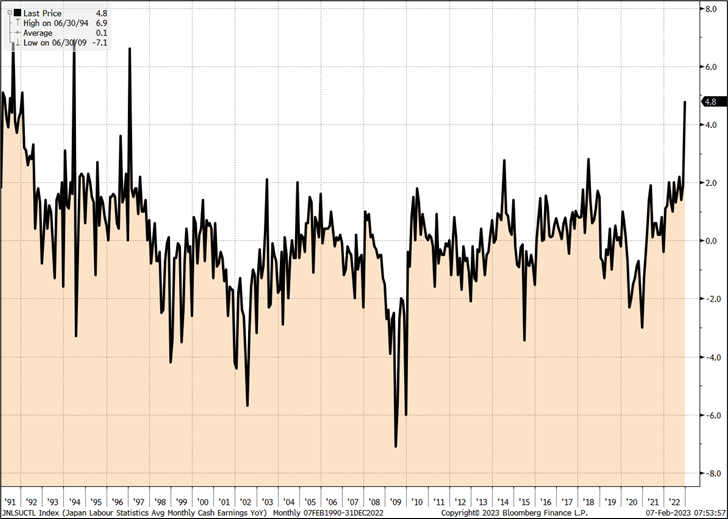
Japanese wage data released last night is not great for my long USDJPY view as bonuses and revisions have launched Japanese YoY wage data up through the top of a 20+ year range. See chart below.
I think Powell is much more important than Japanese wages in the short run, but in the bigger picture, stonking wage growth means increased normalization speed and magnitude, ceteris paribus. Another risk worth keeping in mind is that I’m a believer in following leaks in the Japanese media, but the Amamiya leak could always be wrong. Now that Amamiya is more priced in, if they end up nominating a hawk, USDJPY will dump. Then again, the sell side seems hesitant to believe the Amamiya news so perhaps it’s not really fully priced yet.
I’m sticking with long USDJPY and long USDCAD but there are risks! The EURGBP call spread is going to be touch and go into 10am expiry. I hope that we will be able to stay above the 0.8920 strike.
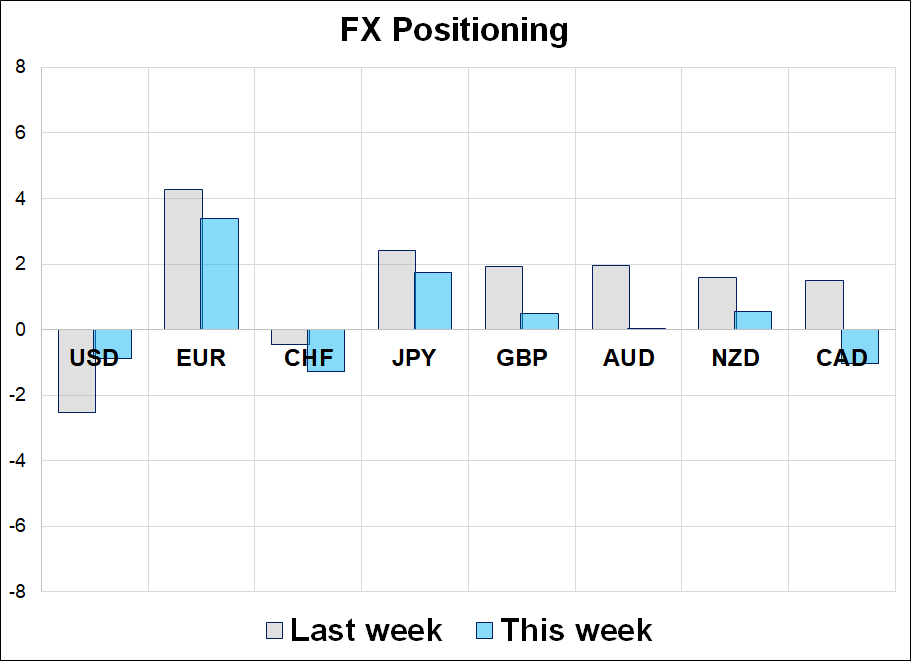
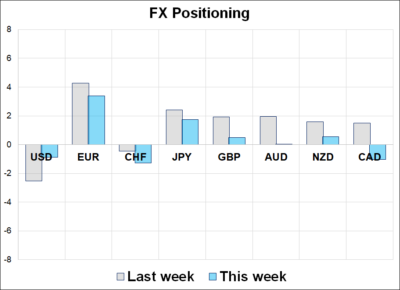
This week’s Positioning and Sentiment Report is below. Please note that the CFTC is having technical issues and therefore the latest CFTC data is from 24JAN. That data moves pretty slow anyway, but just know there is no update to the data this week.
Don’t be a chicken today.
The post-ECB yield meltdown and subsequent quantquake (plus strong ISM and NFP) have just about completely neutralized positioning. While EURUSD calls and USDJPY puts remain heavily owned in options land, spot positions have been wiped clean as everything popular has been rinsed in a typical late JAN/early FEB reversal of favored new year trades. There is a tendency for the most popular trades of the year to face a reckoning between the 3rd and 6th week of the year because P&L tolerance is low and excitement and engagement levels are high at the turn of the year. 2023 has been no exception.
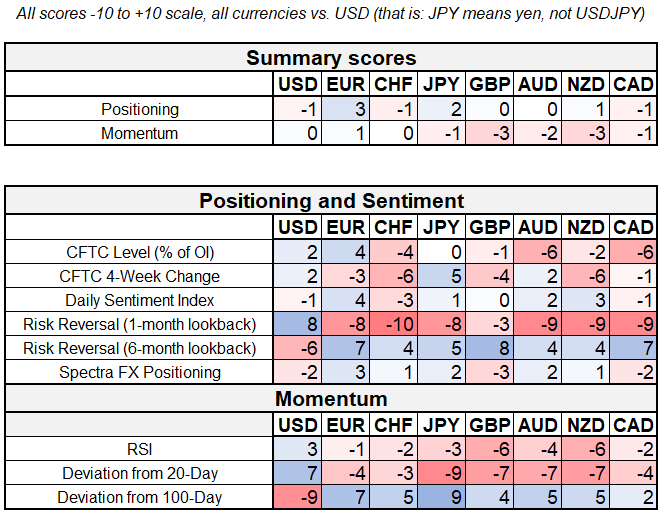
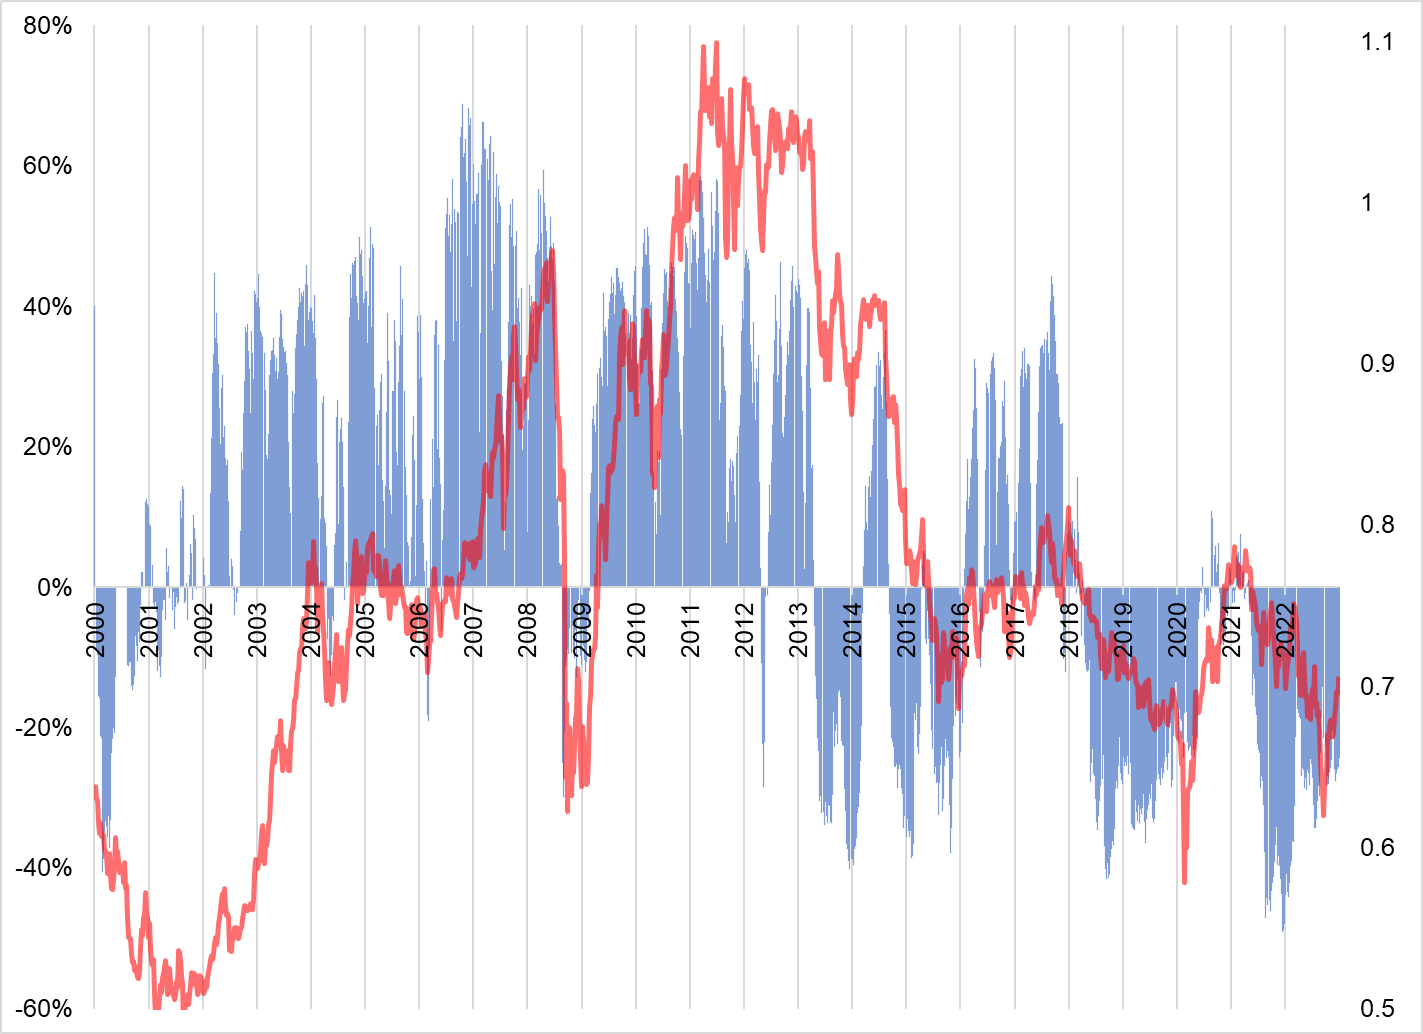
1. CFTC positioning remains sticky with short AUDUSD especially unperturbed by the recent rally from 0.6200 in October to 0.7160 last week. As you can see in the chart, positioning mostly follows price, but there are long lags as the primary determinant of CFTC positioning is long-term trend. While it might feel like AUDUSD has had a nice rally if you are sitting there staring at it all day, in the bigger picture the weekly trend lower that triggered the CFTC to flip short in 2018 is still in place. This is a good example of how CFTC data can be very, very slow moving. A break of 0.8000 would most likely be required to break the downtrend and trigger a flip in CFTC Oz positions.
2. The market’s brief flirtation with long GBP was batted back by a dovish Bank of England and the rebirth of the USD. Three sell-side strategists were the first to dip their toes in the bullish GBP waters up at 1.2380 or so, and that was a good contrarian signal. Here’s what we said about it in the Spectra Positioning Report at the time:
(from January 24) … GBP has outperformed as sentiment turns from bearish to neutral and even bullish in spots. Three FX strategists at large banks put out bullish GBP recommendations this week as price drives news. Suddenly people are wondering if there is more risk premium to come out post-Truss. That seems a little bit absurd at 1.2400. Not that the risk premium is knowable, just that that’s the argument for bullish GBP after a 19-big-figure bounce.
3. There was a massive quant unwind last week and that first took bunds up, then took precious metals down, then expanded to a wider blast radius, injuring most of the China reopening and soft landing trades. Anything that was working for CTAs in 2023 took flak in last week’s action. Gold, silver, and oil are all suffering not from global demand worries, but from excessive bullish herding.
4. Equities rallied with the VIX last week which is a classic sign of short-term overexuberance. Yes, the US data was a catalyst for the turn, but the market was alrready vulnerable because the apes were back in full force and dogs like CVNA were flying to the moon. Carvana traded from $3.70 in early January to $20.00 late last week as the most-shorted stocks were part of the short-term positioning apocalypse story.
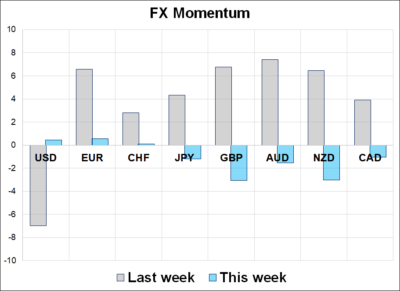
5. FX momentum indicators are all near flat now as impulsive negative momentum in the dollar and positive momentum in gold, stocks, and bonds has reset to zero.
That’s this week’s report. Thank you for reading.

Joe Biden, age 26


A sort of almost unbelievably large move in Brazil. Plus: Short CADJPY.

NZD has a bunch of bullish kickers: Election, seasonality, and inflation