September 20, 2023
Fed
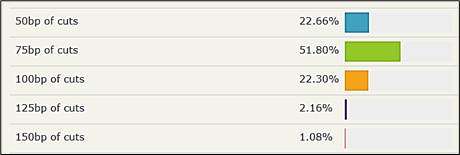
All about the FOMC dots today. Thank you for completing the survey. There were four questions and ~290 respondents. Here are the results.
The 2023 median dot shows one more hike this year. Do you expect that to be:

Current median 2024 dot 2024 shows 100bps of cuts. Do you expect that to be:
The current dot for the long term neutral rate is 2.5%. Do you expect that to be:

Which of the following do you think will have the biggest market reaction?

Putting that together, if you go with the crowd vibe, the baseline is that 2024 dot matters most and many expect it to show fewer cuts. That is to say, an unchanged 2024 dot is dovish and meaningful, while a 75bp 2024 dot is hawkish but kind of expected. Given all the angst about R*, and the many, many good arguments for why it’s procyclical and rising.
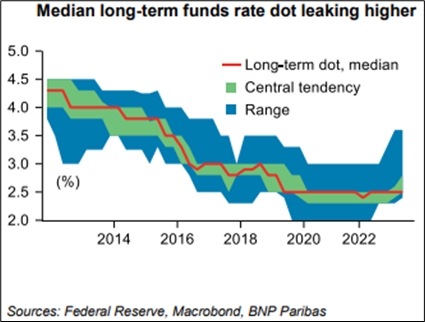
Plus the fact that the median has been pegged even as the average rises, I would think the odds of a higher terminal dot are higher than 50/50. Here is the evolution of the terminal dot. Here is a nice chart from BNP that shows how the range and central tendency have already risen:
Here is a quick history, for context.
The dots vs. Fed Funds and the 2-year yield
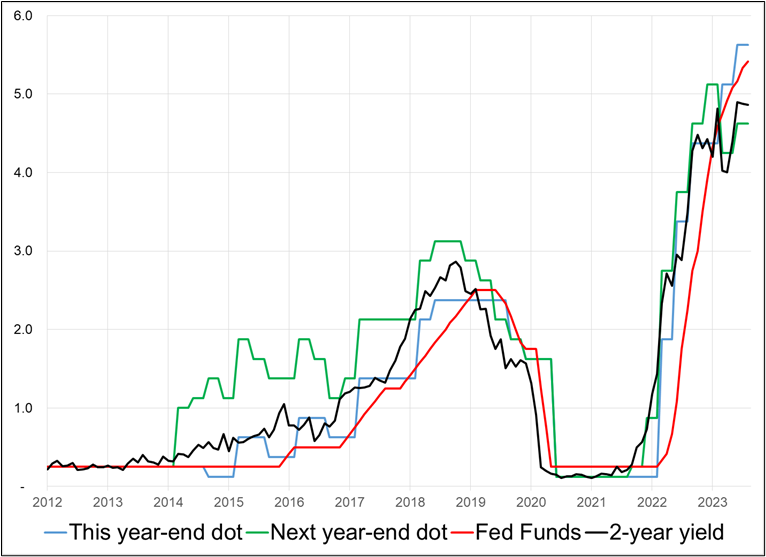
Based on this survey, I feel this is one of the first Fed meetings in a long time where there is a meaningful dovish outcome possible. They leave 2023 the same, leave 2024 the same and the terminal dot the same and that would suggest they are going all-in on the soft landing thesis and still plan cuts out of restrictive territory and back to neutral in 2024 as discussed by Williams and others.
A higher terminal rate should not be a huge market mover, given it’s a finger in the air exercise with low credibility, so the market reaction should come down to the combination of the 2023 and 2024 dots. Here is the matrix of outcomes we see. Thanks Gitt for running the survey.

UK CPI
Tomorrow, we get UK CPI and the setup is the exact opposite to the one in Canada. Forward-looking data is showing lower prices on the horizon while the central bank’s reaction function is turning less hawkish.
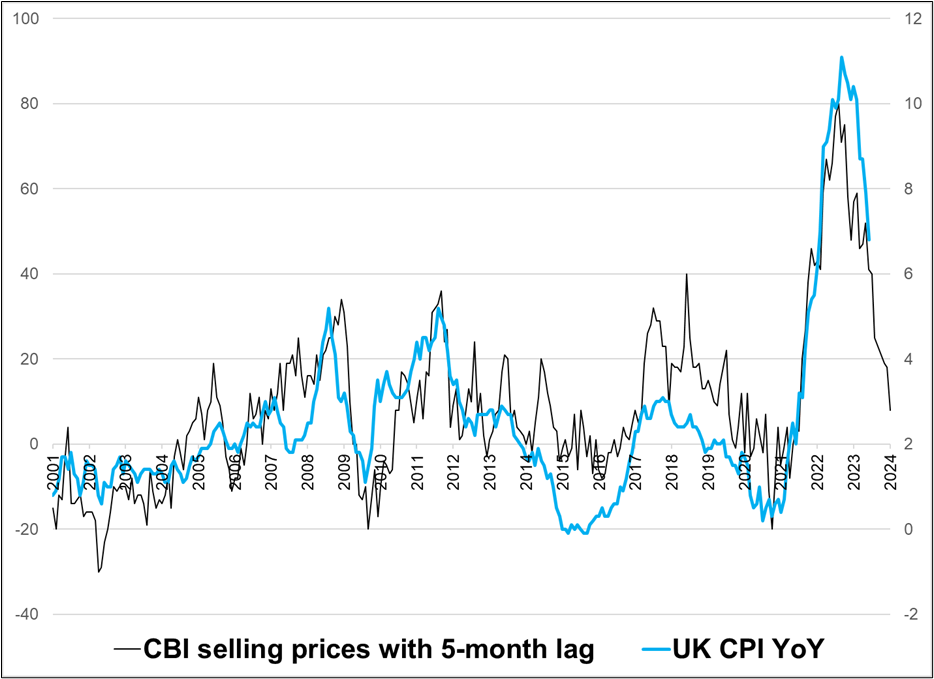
The CBI selling prices figure, which is a survey from the Confederation of British Industry asking companies where they see selling prices, continues to mean revert after exploding higher post-COVID. The series is one of the few soft data points that has been an excellent forward-looking indicator. The lag between the survey and official CPI is about five months. Here is the chart:
Final Thoughts
Someone posted this chart on Twitter but I don’t have a source. Big if true.
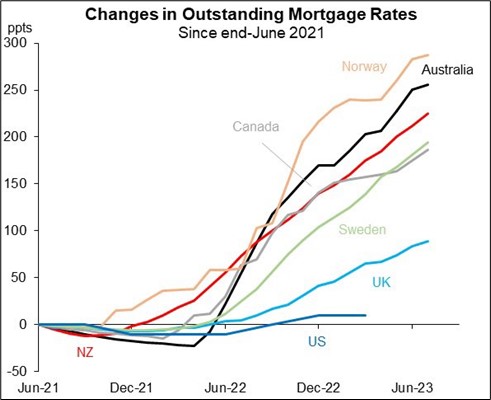
Tomorrow: SNB, Riksbank, Norges, BoE, and BOJ. Speed round:
- SNB I decided not to do the short CHF trade as I think SNB could play it safe with rising rents and mortgage rates likely to be inflationary in Q4.
- Riks: What will they do / say about the currency. Or maybe we have to wait for this: https://www.riksbank.se/en-gb/press-and-published/calendar/calendar-2023/2023-09-22/
- Norges: Think they lean dovish as pressure building on the economy there.
- BoE: I would think no hike (it’s priced 50/50) but market is short GBP so FX reaction could disappoint. Receive rates and long GBP?
- BOJ: Nonzero chance of some forward guidance or mention of the JPY. Not a bad lotto ticket to be short USDJPY into it. Stop at 148.76.
Have an evenly-split day.
good luck ⇅ be nimble


