Electoral Fixation
167 days from now, the United States will hold a presidential election. On some timeline in the multiverse, this event will feature a well-respected, naturally tanned intellectual known for his consistently ethical approach who avoids any appearance of criminality battling respectfully against a young, effective leader widely admired for his oratory capabilities, sane fiscal policy, pro-crypto stance, and an exemplary son who uses desktop computers only, never laptops.
In the timeline that you and I live in, it looks like this.
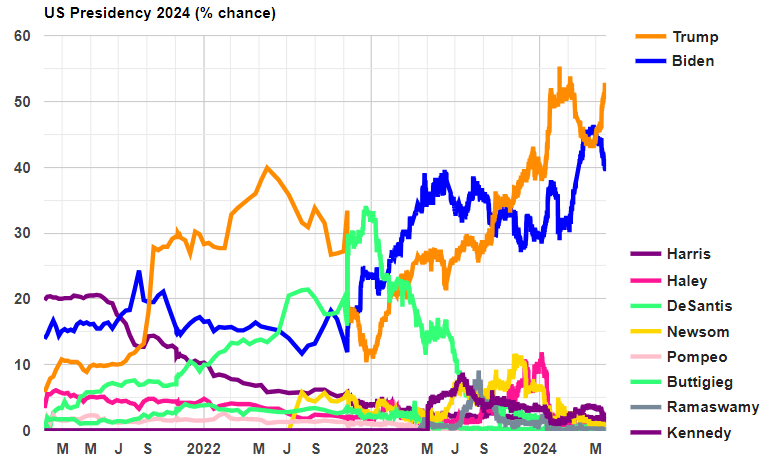
I just put this chart in here because I had not realized that Trump had built such a huge lead over Biden this month. So maybe you didn’t realize it either. The chart above comes from electionbettingodds.com, a site that aggregates the live gambling odds from sites like PredictIt and BetFair. The current win probabilities are 52% for DJT and 40% for JRB. While it’s still a bit too early to gameplan how to trade FX options for the election, timing events like this involves multiple sources of error and too early can be just as bad as too late.
- Too early. You buy options and get the idea right, but you pay so much time decay and your strikes end up being too far away due to random movements ahead of the event.
- Too late. If you want to buy options a week before the election, you are going to have a problem. Ahead of many events like this, vol starts to ramp up in the last few weeks as panic buyers emerge just as risk managers walk around and limit all new short vol positions.
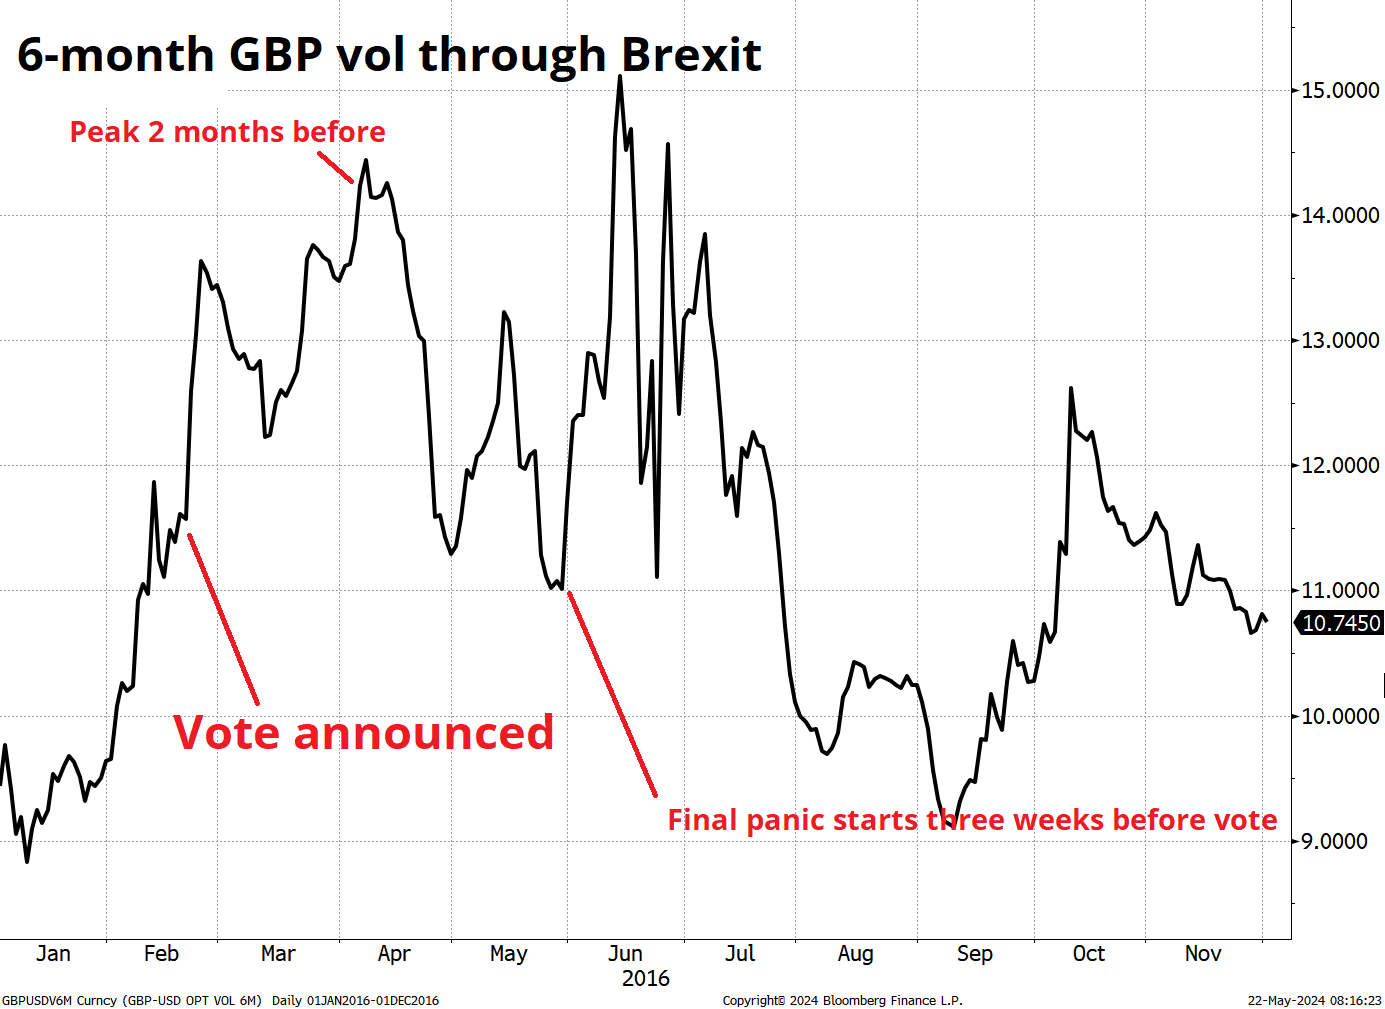
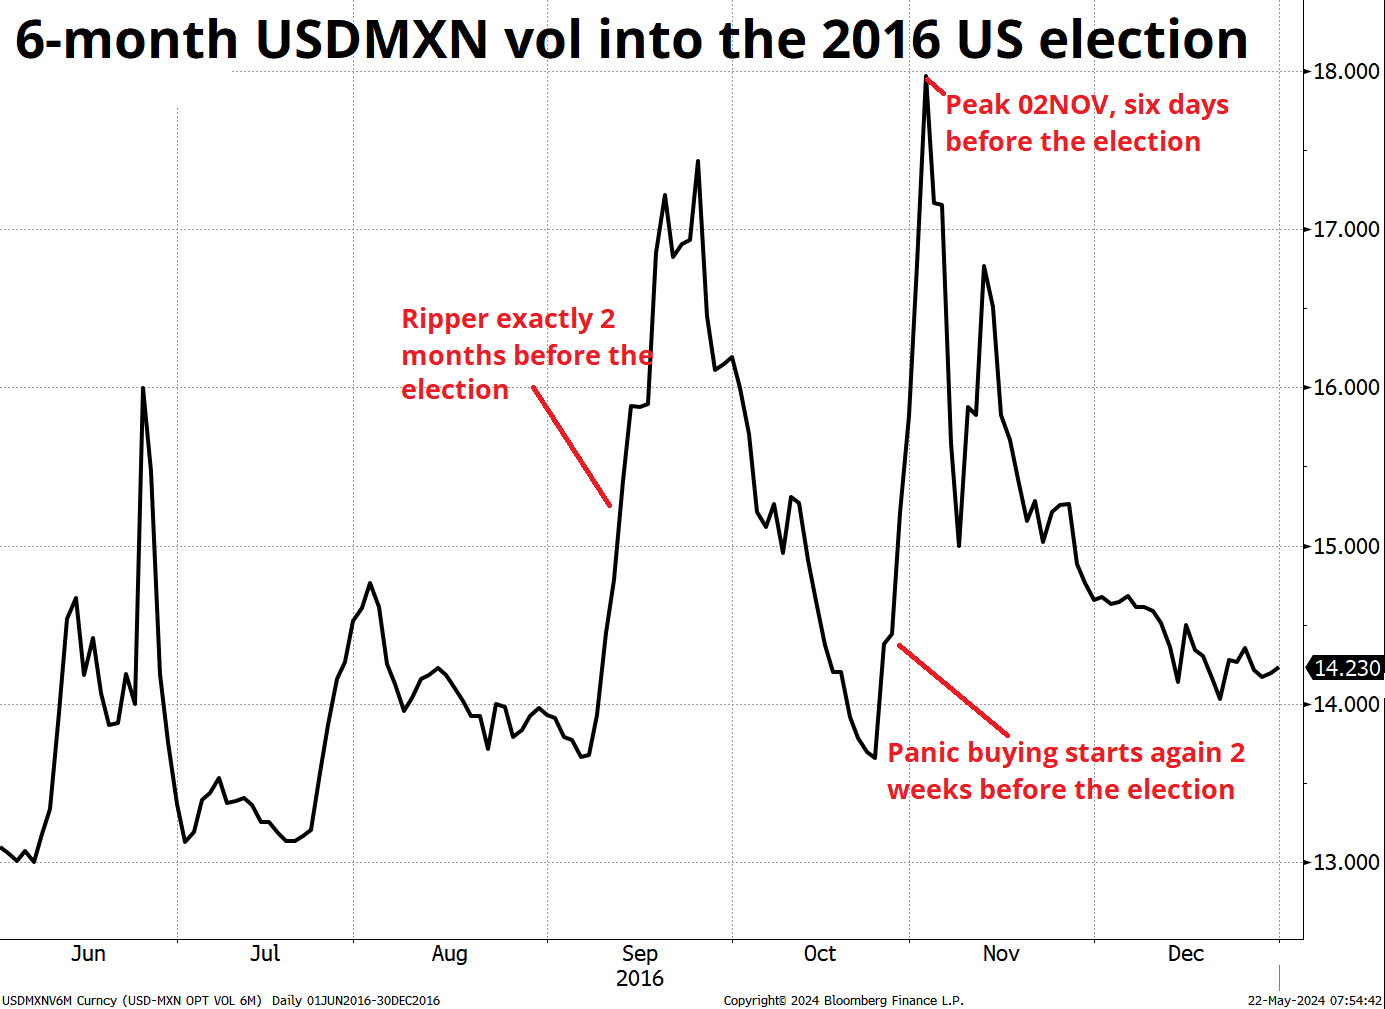
The runup into Brexit and the 2016 election both feature the same two-stage model of panic. There is an initial UH OH two or three months before the event and then another panic right before the event. I think the first wave comes from specs and hedgers buying options, then there is some mean reversion, then the second spike is last second unconditional buyers of vol who encounter risk-averse option desks unwilling to take unlimited, hard-to-measure event risk as risk managers hover behind them. I’m using 6-month because the series is not distorted by the event not being in the contract for a while, then being part of the contract.
Another good example is the runup into the Scottish Referendum in 2014.
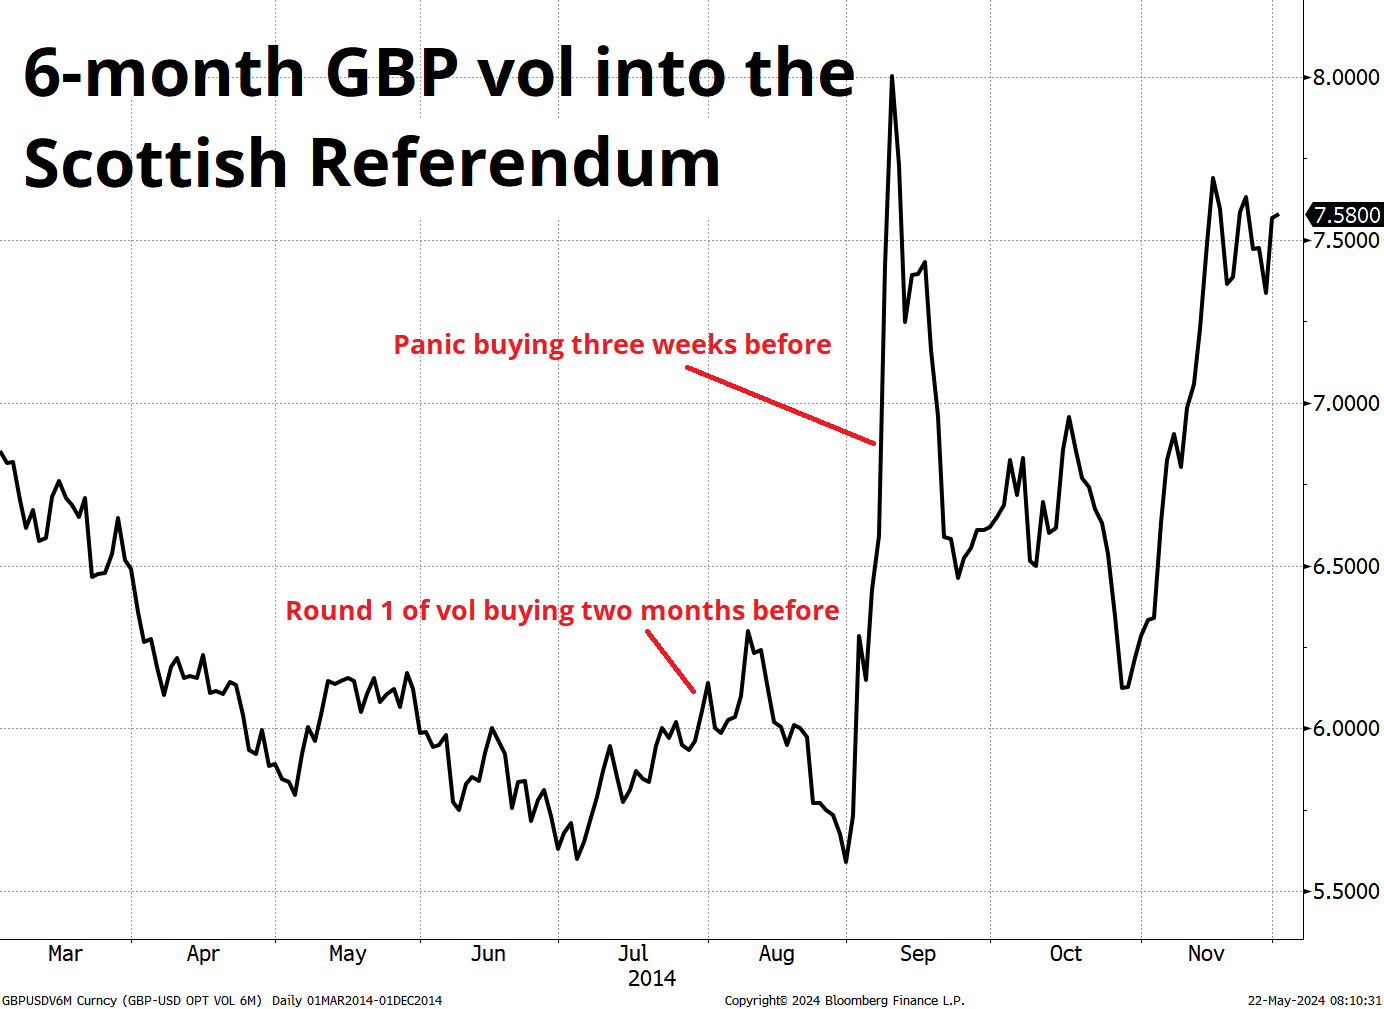
Again, you see (a more muted version of) a pattern where there are two rounds of vol buying. Obviously, the behavior of volatility is related to the moves in the polls. The gigantic panic in 2014 was triggered by an abrupt narrowing of the polls, for example. Still, there is an underlying logic to the evolution and timing of:
- Blasé / it’s too far away to care.
- Let’s buy some vol for this thing.
- Mean reversion.
- PANIC BUYING.
Based on these examples, one might expect USDCNH vol to go up starting in August, mean revert to make a low in early October, then rip higher into the election. Given USDCNH doesn’t move very much, it’s not a bad idea to consider doing calendar spreads like sell 15AUG24 and buy 15DEC24, etc. While a Trump victory is hard to handicap in G10 because tariffs are bullish USD and Fed neutering is bearish USD… A Trump victory should be unambiguously negative for CNH.
FX
Canada CPI came in on the screws, pretty much, so my USDCAD option expires worthless and the EURCAD is a tiny loss. Mutant USD strength today is causing frustration and consternation for AUD longs in particular and that pair is getting right back to where it started pre-CPI. Going into the CPI release, AUDUSD was 0.6633. After the release, it went 0.6680 paid and then right back down to a low of 0.6629. As such, I consider 0.6630/50 to be a critical pivot in AUD.
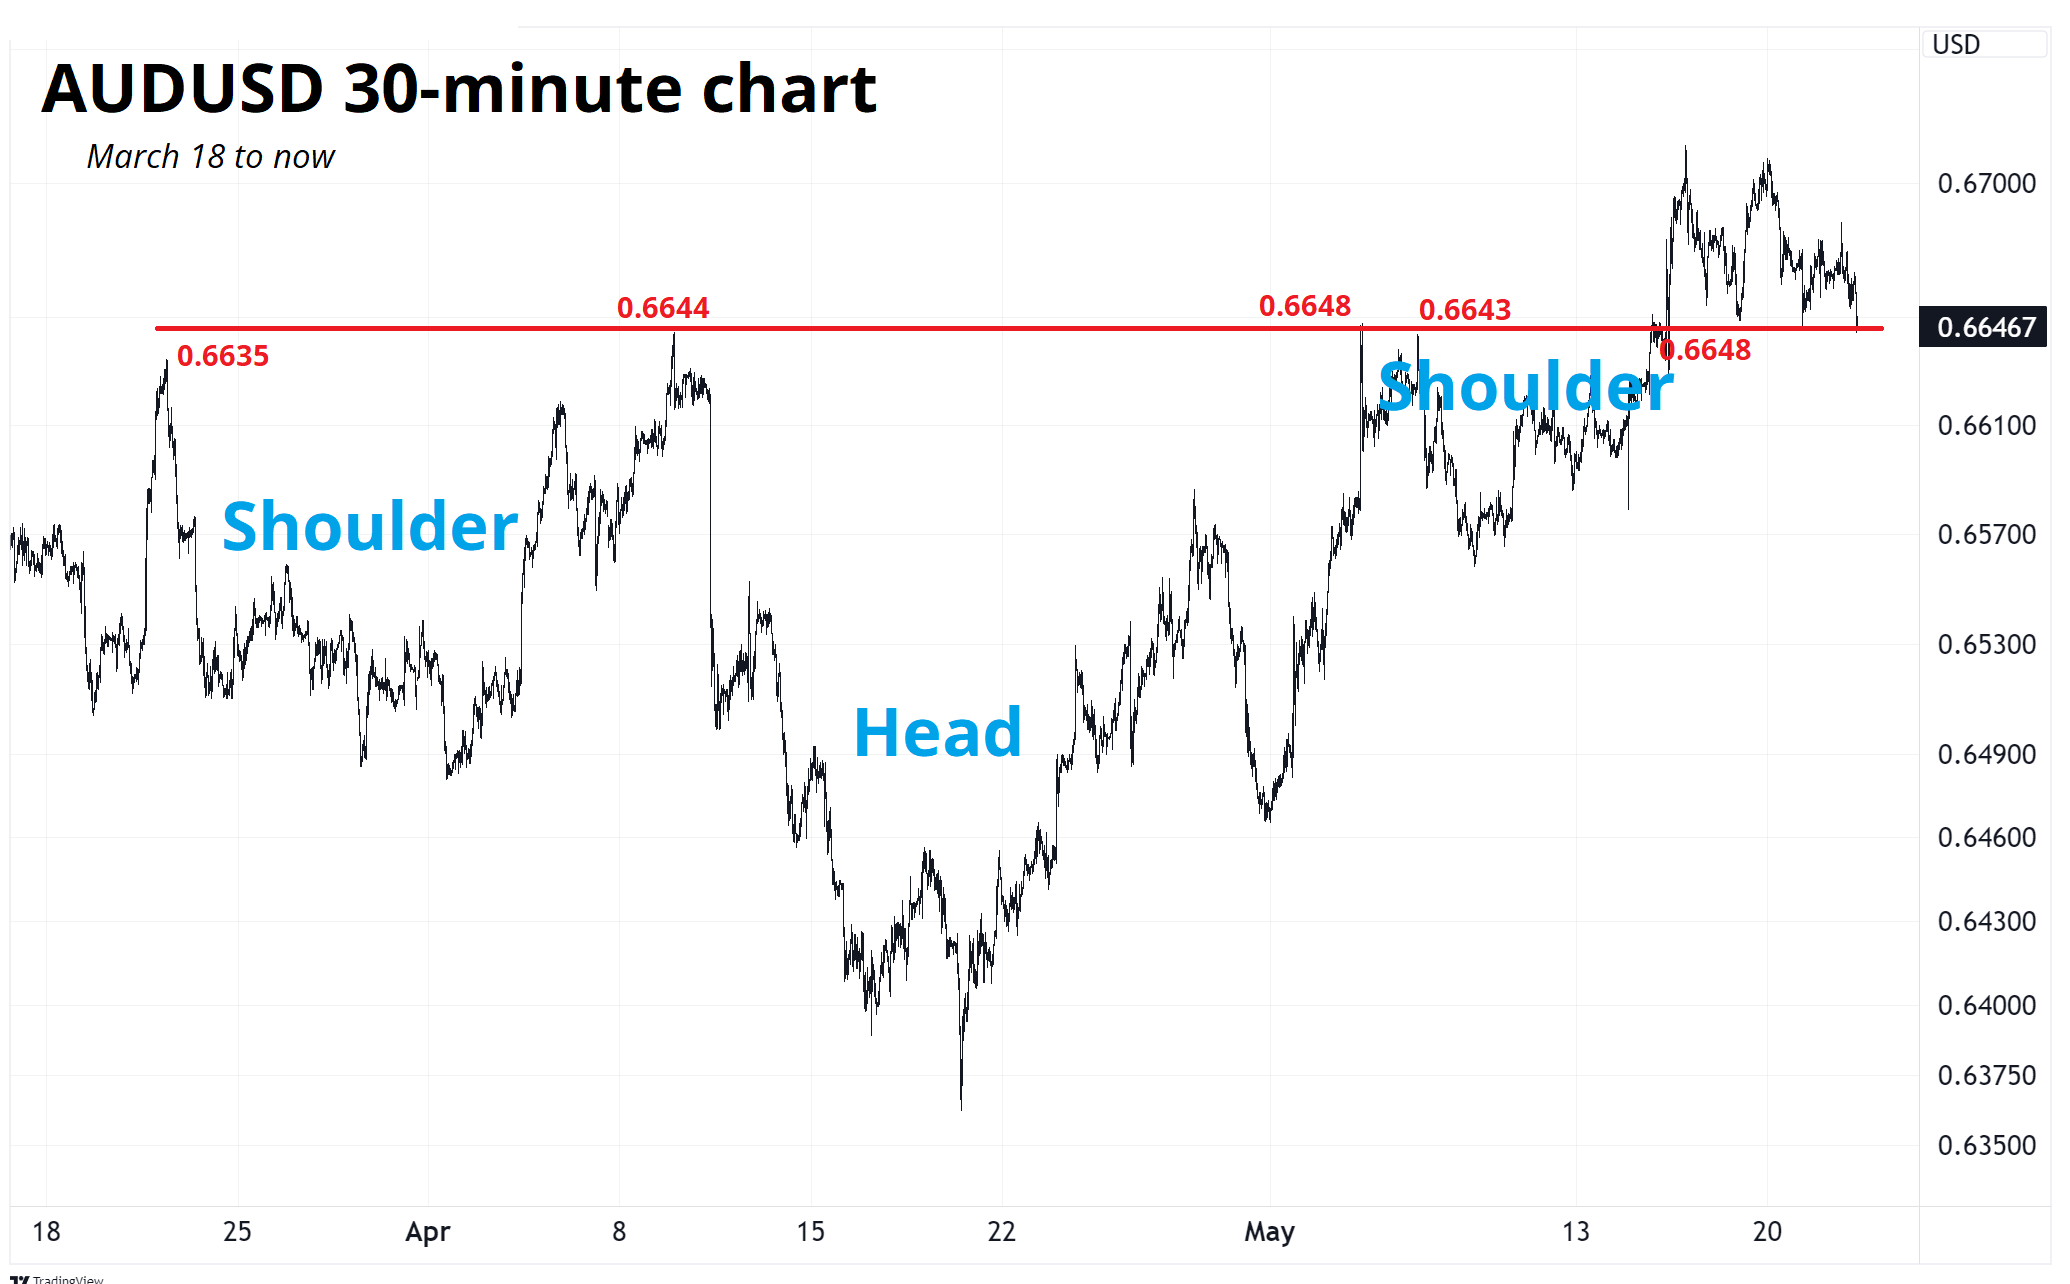
You can see that 0.6630/50 has been epic as it was the quadruple top and the neckline of a huge inverted Head and Shoulders pattern. Now, all hope for AUD bulls rests on that thin red line.
Final Thoughts
You can add “Target Underwhelms” to the list of concerning data points on the consumer. Watch housing today. While housing data has been irrelevant for eons, I think we should be much more focused on the demand side of the economy now as jobs growth slows, excess savings have been spent, credit card delinquencies are rising, and consumer weakness appears in earnings reports and Retail Sales figures.
In six months, we are going to look back at 4.87% 2-year yields and wish we locked in.
Have a liquid day.