
The low volatility and strong risky asset returns continue. The Everything Rally (Part 2) continues to mirror 2021.

Spectra School is Coming!
Over the past year or so, we have been building Spectra School. We will be ready to launch in the next 6-8 weeks (approx.) You can sign up for the Spectra School waitlist here—anyone who is on this list will receive sweet deals when we launch (it’s free to sign up and there is no obligation). Our flagship first course is called “Think Like a Market Professional”. It features a ton of content (practical frameworks for trading and analyzing financial markets) plus full-length videos featuring some of my favorite people in finance. Fun.
We will cover topics like cycles, narratives, the importance of financial history, edge, bias, trading economic events, options, and much, much more.
Here’s what you need to know about markets and macro this week
Global Macro
The low volatility and strong risky asset returns continue. The Everything Rally (Part 2) continues to mirror 2021 with the performance of most major assets ranking somewhere between buoyant and explosive while a new crop of altcoins and meme stocks emerges to entertain the gamblers and degens.
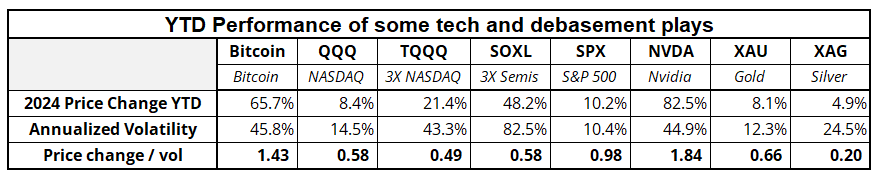
Here is the performance of some debasement hedges and tech assets this year. There is some decent divergence with BTC and NVDA pumping out much higher vol-adjusted returns than anything else. Gold is going up and silver is an ongoing disappointment. Once upon a time, back in ye 2010s… If risky assets rallied and debasement was in play, silver was a star. Now, it’s like gold mining stocks. Always a catchup trade that never catches up.
The debasement trade and Everything Rally 2 primarily reflect the market’s evolving confidence that the Fed Pivot came prematurely, and like G-dubs, Powell and Co. have unfurled the Mission Accomplished banner too early.
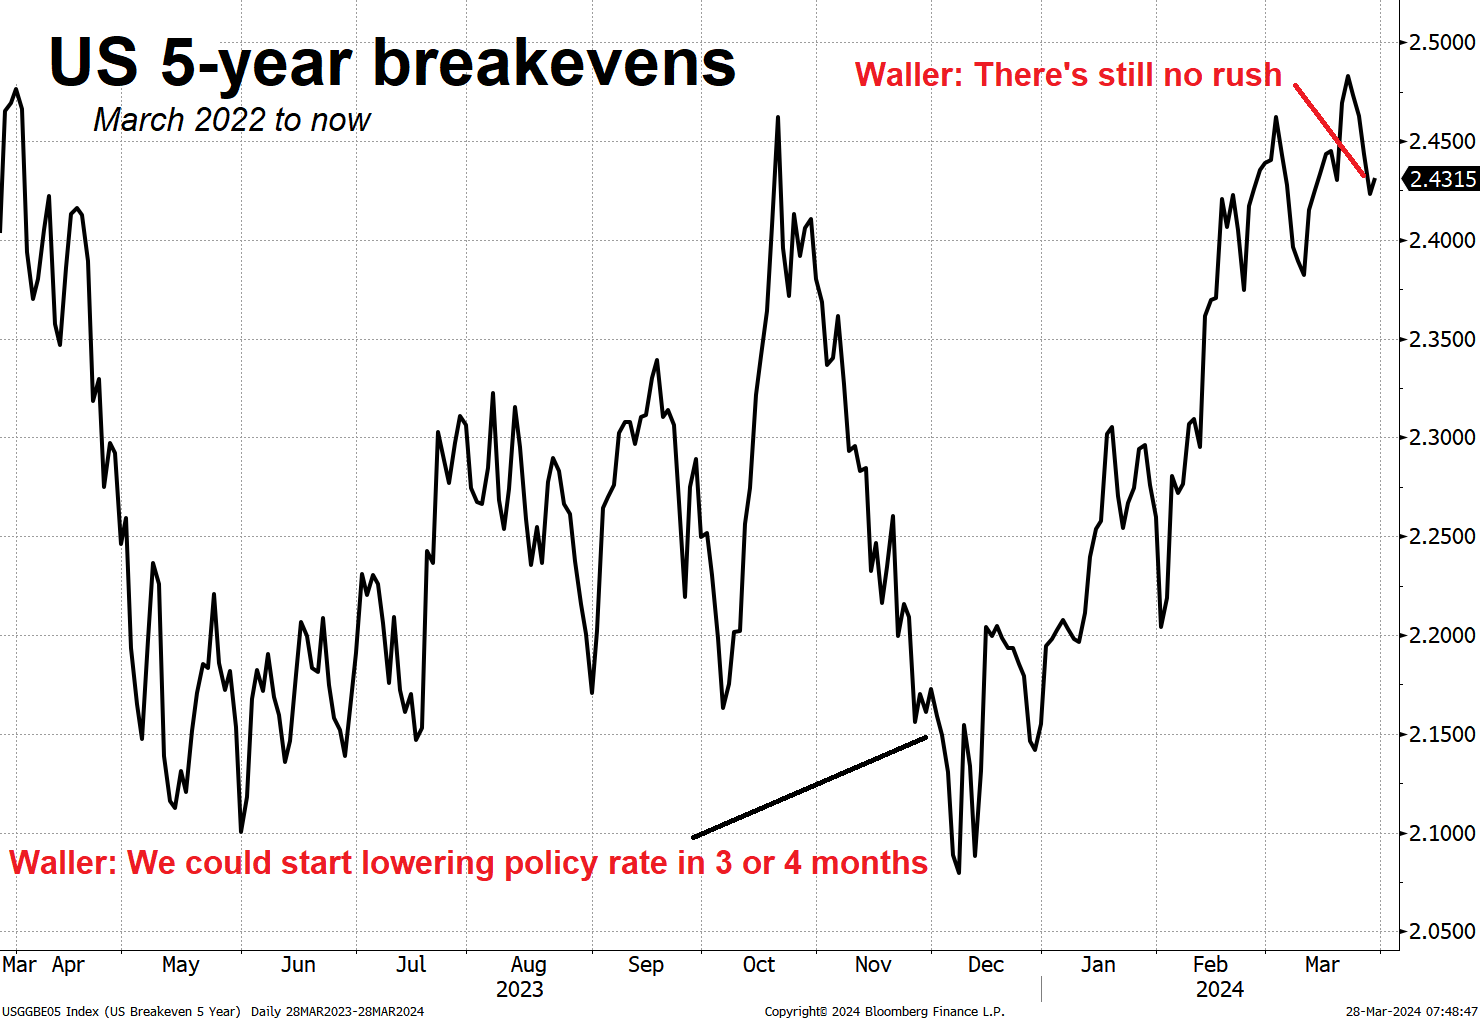
We saw some pushback from with Waller Wednesday night as he again validated the idea that there could be cuts on the horizon but that the horizon is constantly receding as you move towards it, like one of those weird shimmering heat mirages on a hot highway. Remember that in November 2023, Waller launched the Fed Pivot via commentary suggesting that rates could be cut 3 or 4 months later. Now it’s 3 or 4 months later and we’re still talking about rate cuts in 3 or 4 months. Perhaps in July, we’ll still be waiting for that first cut. It depends on the data.
![]()
And here’s a chart of 5-year breakevens. The breakeven inflation rate represents a measure of expected inflation derived from 5-Year Treasuries and 5-Year Inflation-Indexed Treasuries. The value implies what market participants expect inflation to be in the next 5 years, on average.
The question at this point is whether Fed policy pushback from Waller matters right now or has the Fed lost enough credibility with its flip flops and if/thens that pure momentum will continue to drive assets higher. As long as the pivot of the pivot doesn’t trigger a rise in bond market volatility, it’s probably not that big a deal.
Anyway, as usual the data is what matters, not the communications, but the market trades off the communications, so it’s this strange circular dance where the Fed makes tremendous progress on inflation (whether that was luck or skill) and then Waller lights a fire under animal spirits in November 2023 and triggers an inflationary and speculative rebound which eventually makes inflation and inflation breakevens go back up and then he has to douse it. Obviously, Waller was not the only factor in the inflationary rebound, but the “We did it!” Fed Pivot surely had a big impact.
Bigger picture, the data drives the bus, not the Fed.
Stocks
I was off for the past two Fridays and thus there was no Friday Speedrun, so I looked back at the most recent one (March 8) to see what was going on at that point. Back then, NVDA looked like it was cracking, and the NASDAQ was looking super bearish. Here’s NVDA now:
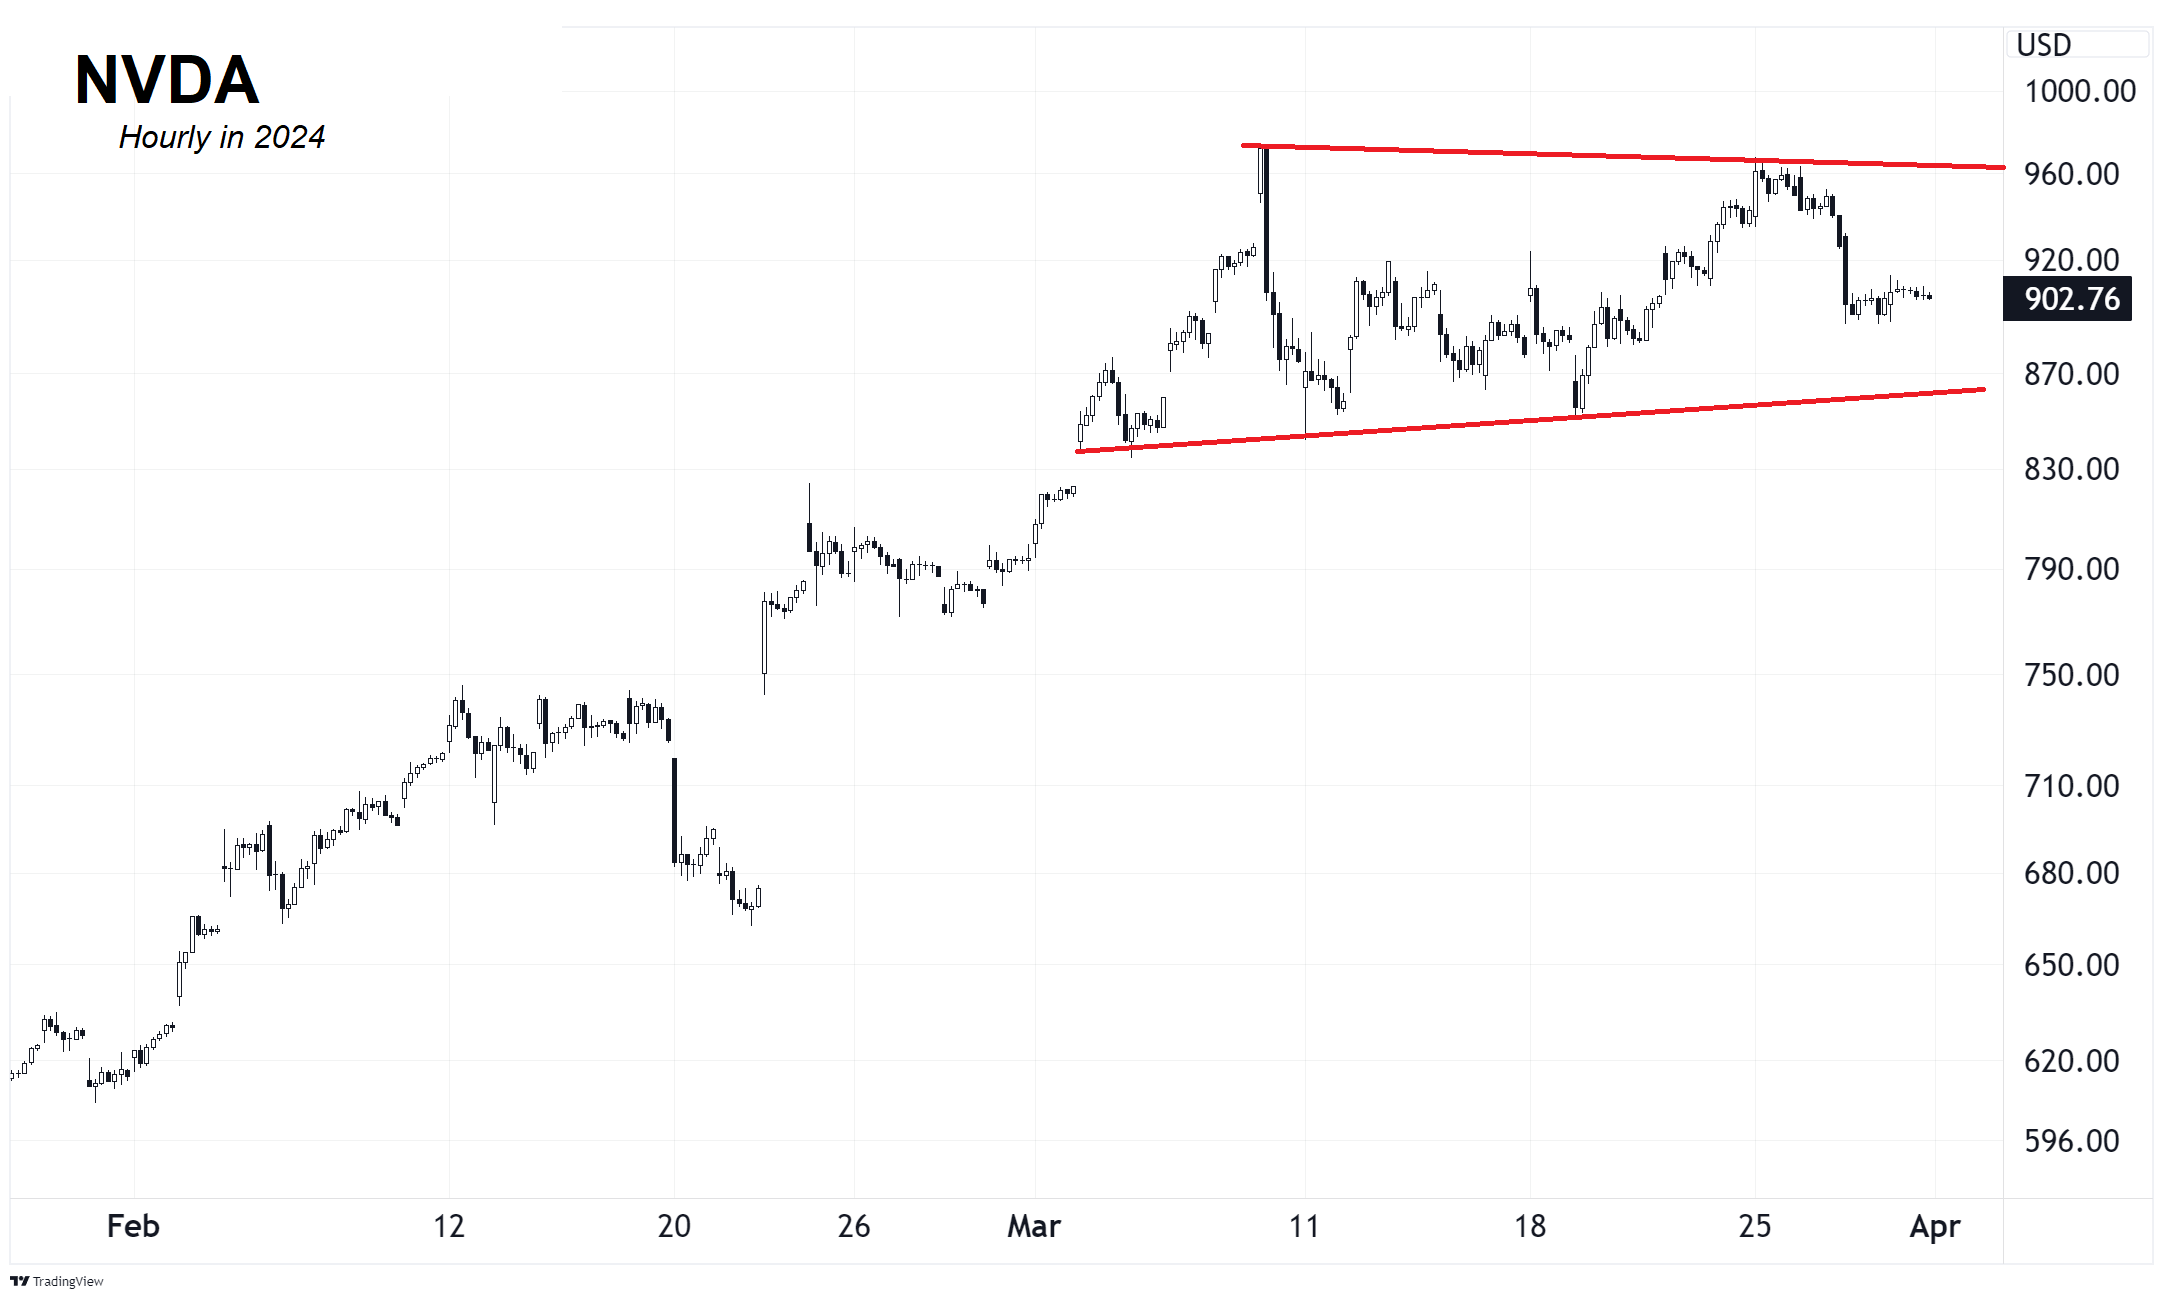
It is mildly interesting that even as the S&P 500 has recovered and made new all-time highs, the NASDAQ, NVDA, MSTR, and bitcoin are all below their mid-March highs. Nothing dramatic going on here, but there is a mild loss of momentum. Weirdly, despite Waller’s comments this week, yields are also below their mid-March highs. So, the relationship between Fed policy and risky assets is not as clean as it once was.
The two main reasons Fed policy isn’t impacting risky assets as much these days are:
- The volatility of policy expectations and the volatility of interest rates have collapsed. In 2022, we were worried about 50bp hikes at consecutive meetings. Now we’re wondering about 25bp cuts somewhere out four months into the future.
- Fed policy hasn’t had the expected impact on the real economy as interest payments seem to provide some stimulus and corporations and individuals are well-hedged and not intensely impacted by rising rates (yet?). So, if Fed policy doesn’t influence the economy like we thought it did, who cares what the Fed is doing?
You can see the decline in volatility and the decoupling of yields and risky assets here:
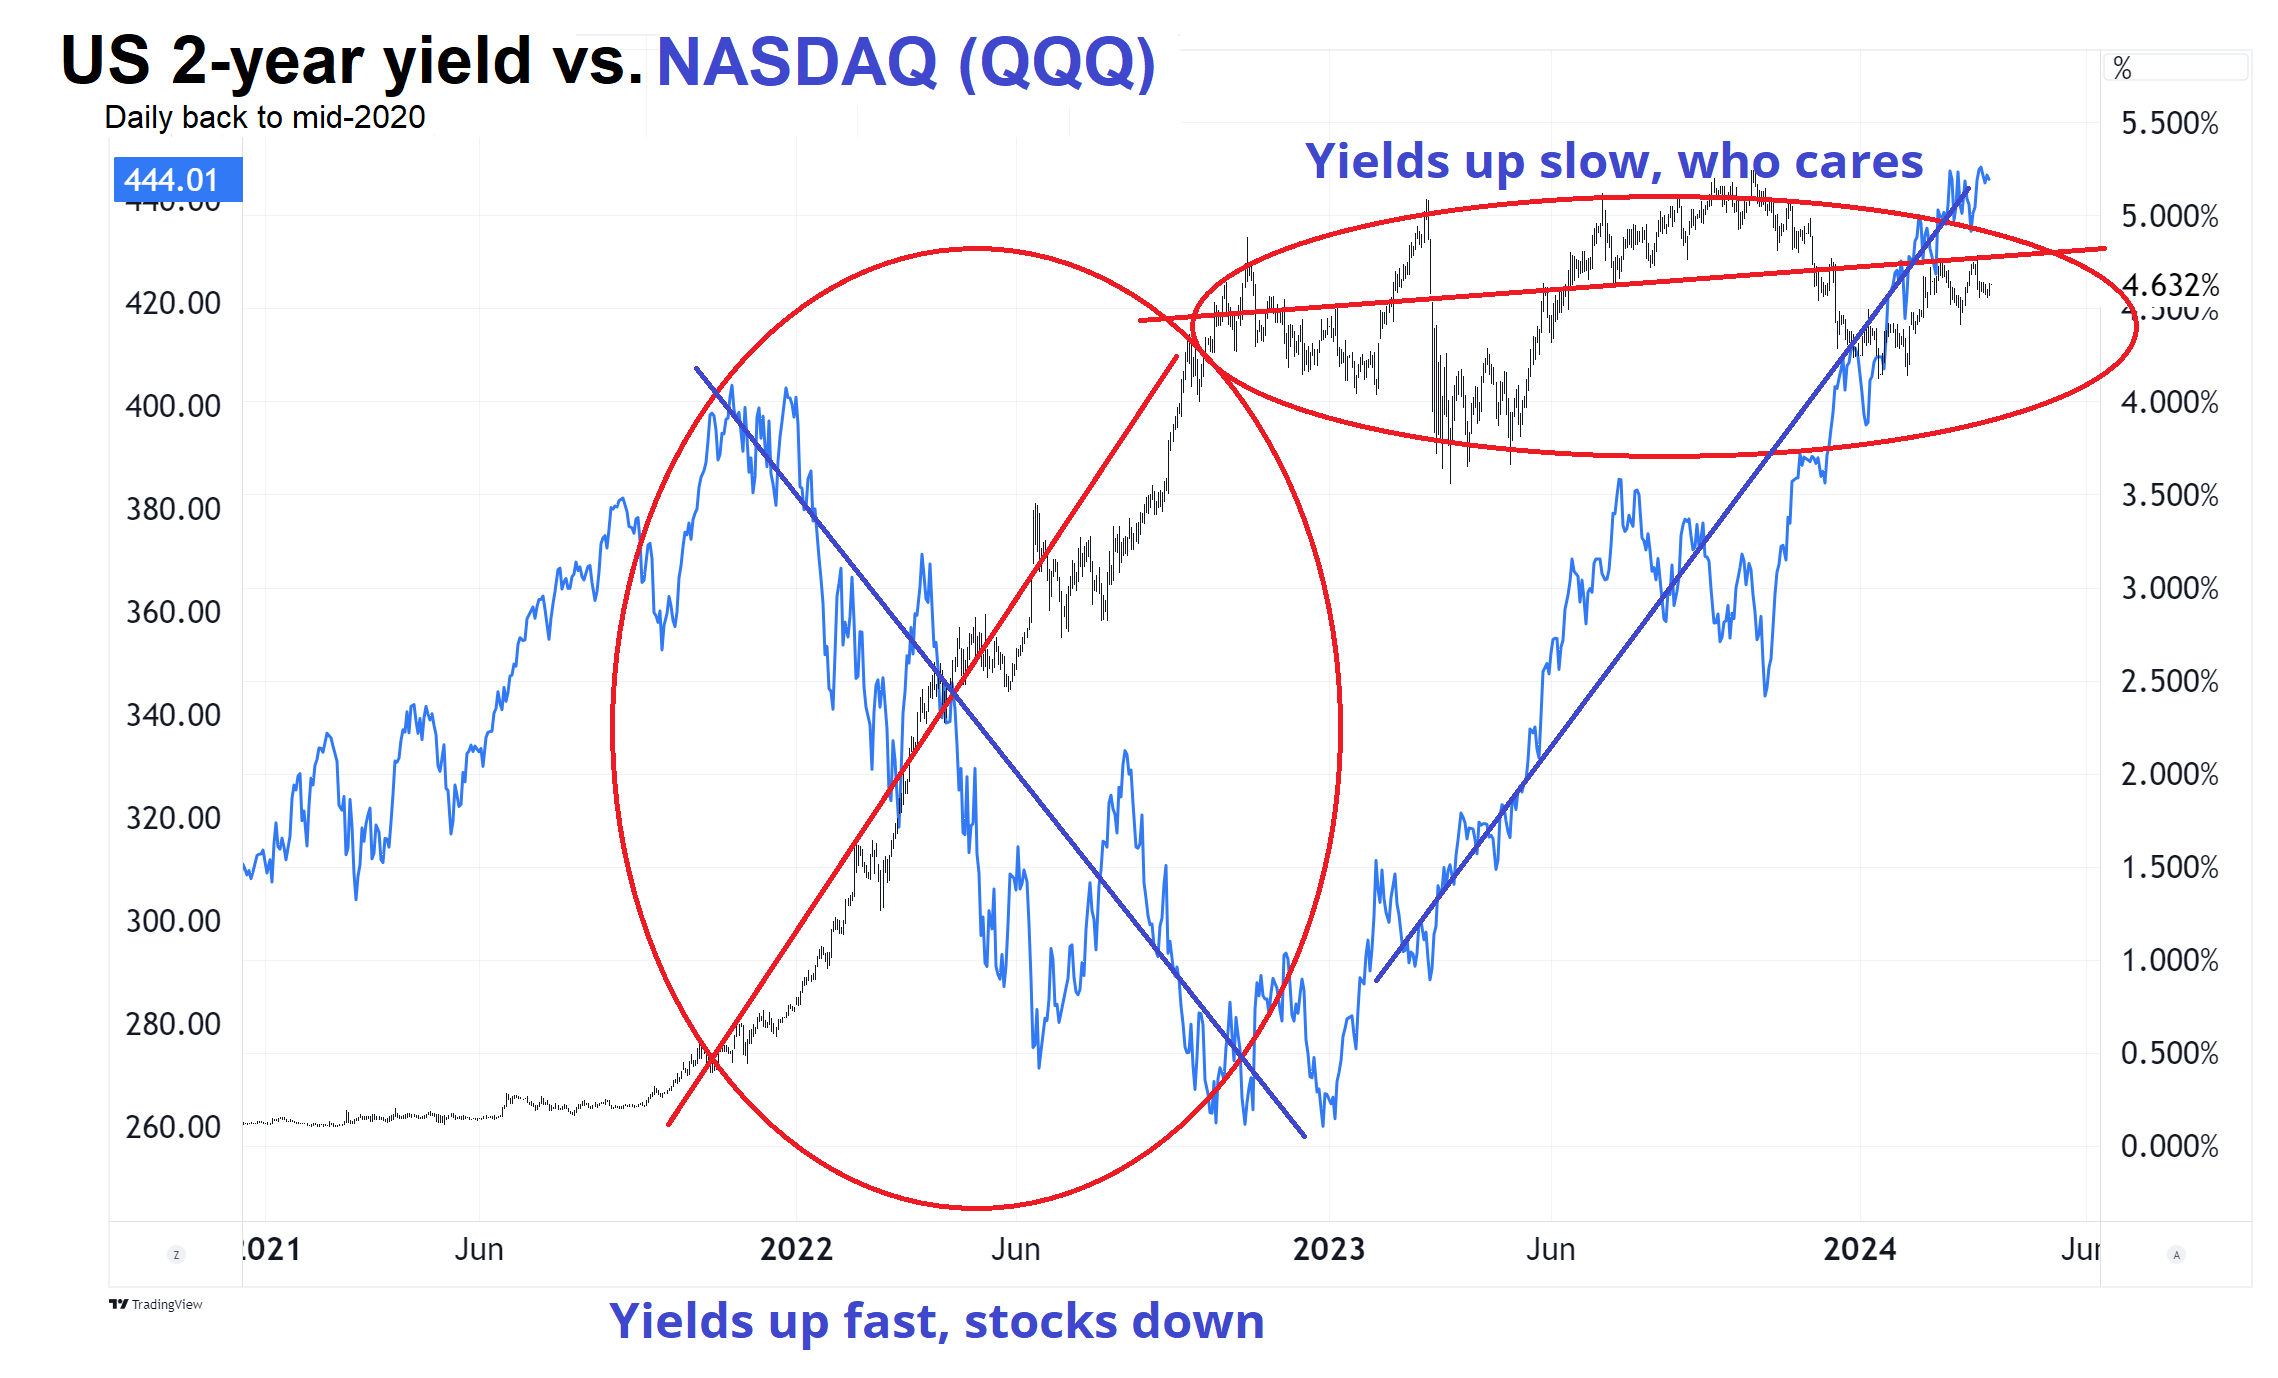
This raises an important point, which I discuss often. The speed of moves is just as important as the direction. When bonds are flying all over the place, risk management becomes more difficult, positions need to be reduced, degrossing occurs, and so on. When the cone of uncertainty around Fed policy narrows, correlations drop or even reverse. Higher volatility almost always leads to higher correlation. Now, we are seeing the reverse of that. The obvious implication is that if bond market volatility were to pick up again, that’s important, but there is no sign that is happening.
I would be remiss if I didn’t mention DJT, the new ticker for Donald Trump’s social media company. It’s an interesting meme stock as it captures some of the “stick it to the man” vibes of GME and while both rallied this week, GME then crapped out on bad earnings. There are many reasons you would want to be short DJT in the long run:
- Valuation
- Ridiculously bad financials and metrics. To quote Morningstar:
Trump Media’s financial results had been released, as part of DWAC’s filing process, and they were breathtakingly bad. Not only had Truth Social received only $2.3 million in revenue during the first six months of 2023, but business had been flat during the following quarter.
To greatly understate the matter, those results failed to meet the company’s projections. In October 2021, Trump Media had provided its initial financial forecast. After posting negligible revenue in 2022, the presentation stated, Trump Media would post $144 million in sales in 2023, followed by $835 million this year. Not so much! (By now, most of Trump Media’s revenues were projected to come not from its social-media site, but instead from an entertainment streaming service called TMTG+. However, the latter has never been created.)
None of which, of course, has mattered to investors.
- Donald Trump is the only asset of the company and he is unlikely to be alive past 2034. Certainly he would not be actively posting on social media until then. So instead of the normal multi-decade discounting of cashflows, we can probably assume this company is worthless 10 years out. That crimps the valuation even more.
On the other hand, you might not want to be short because:
- The borrow costs somewhere around 150%/200% per year.
- Valuation is irrelevant in meme stocks. What matters is when people get bored and take profit. That might not happen until the November election.
- Maybe DJT is not a meme stock, but a cryptocurrency?
https://www.morningstar.com/stocks/trump-media-is-not-meme-stock
Anyhoo, it’s fun to watch. Bill Gross wants to sell calls, which makes sense but is hard to size! First rule of trading is: Don’t blow up. If you must sell calls, sell call spreads. Please. For the love of God.
And speaking of loving God, Trump is selling $59.99 bibles:
https://godblesstheusabible.com/
Ermmmm…
Here is this week’s 14-word stock market summary:
Reduced momentum and slightly more hawkish Fed create mild headwinds. DJT like a shitcoin.
Interest Rates
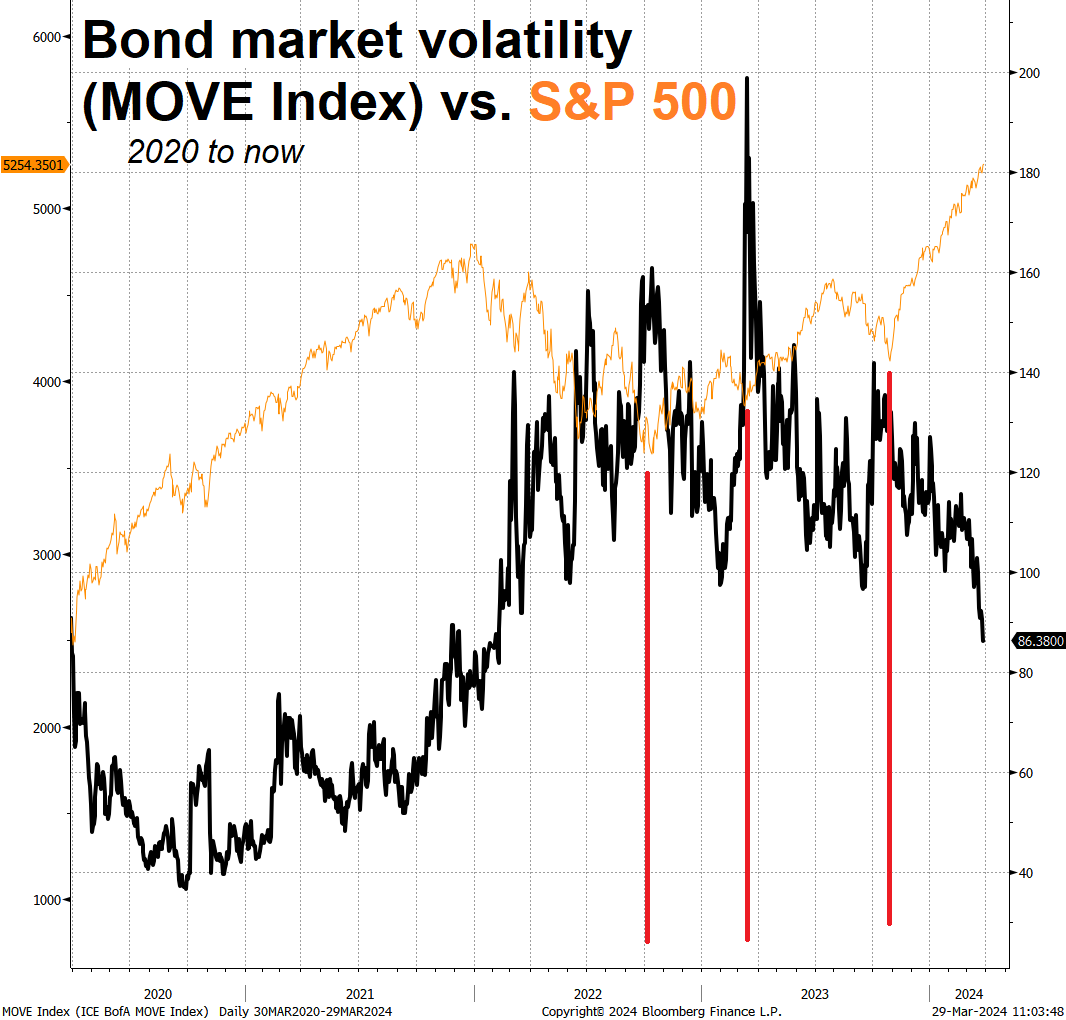
As mentioned earlier, the story in rates is not the Fed, or the data, or the directional movement in yields. It’s the drop in volatility. High bond market volatility is scary (**Liz Truss has exited the chat**). Risky assets prefer stable bond markets. And that’s exactly what we’ve got. Stable yields, and joyous markets.
This next chart shows bond market volatility in black, with the S&P 500 Index in thin orange. I put in red lines to show you how SPX bottoms coincided with peaks in bond market volatility. It’s pretty much that simple. The regime of scary Fed hikes and skyrocketing yields is over for now and everything that happens in bonds these days is happening in familiar ranges with lower volatility. Unscary.
Fiat Currencies
Alf Peccatiello and I talk FX a bit of FX in this week’s Macro Trading Floor podcast (USDJPY and USDCNH). Just click here to listen. It is always a maximum of 40 minutes long.
Overall, the message in the podcast is that with volatility low, carry trades will continue to do well (MXN continues to shine, for example). And yet of course we always need to be on high alert for regime change.
Fiat FX is in mostly-familiar ranges with one exception: USDCNH is breaking out (a bit). The long USDCNH trade makes sense fundamentally, but you need some kind of technical break or catalyst to get onboard because the currency is heavily managed by the Chinese government and can be nearly pegged for ages and ages. That said, the trade is positive carry (because US yields are way above Chinese yields), so you get paid to sit there as it goes nowhere.
Here’s the chart:
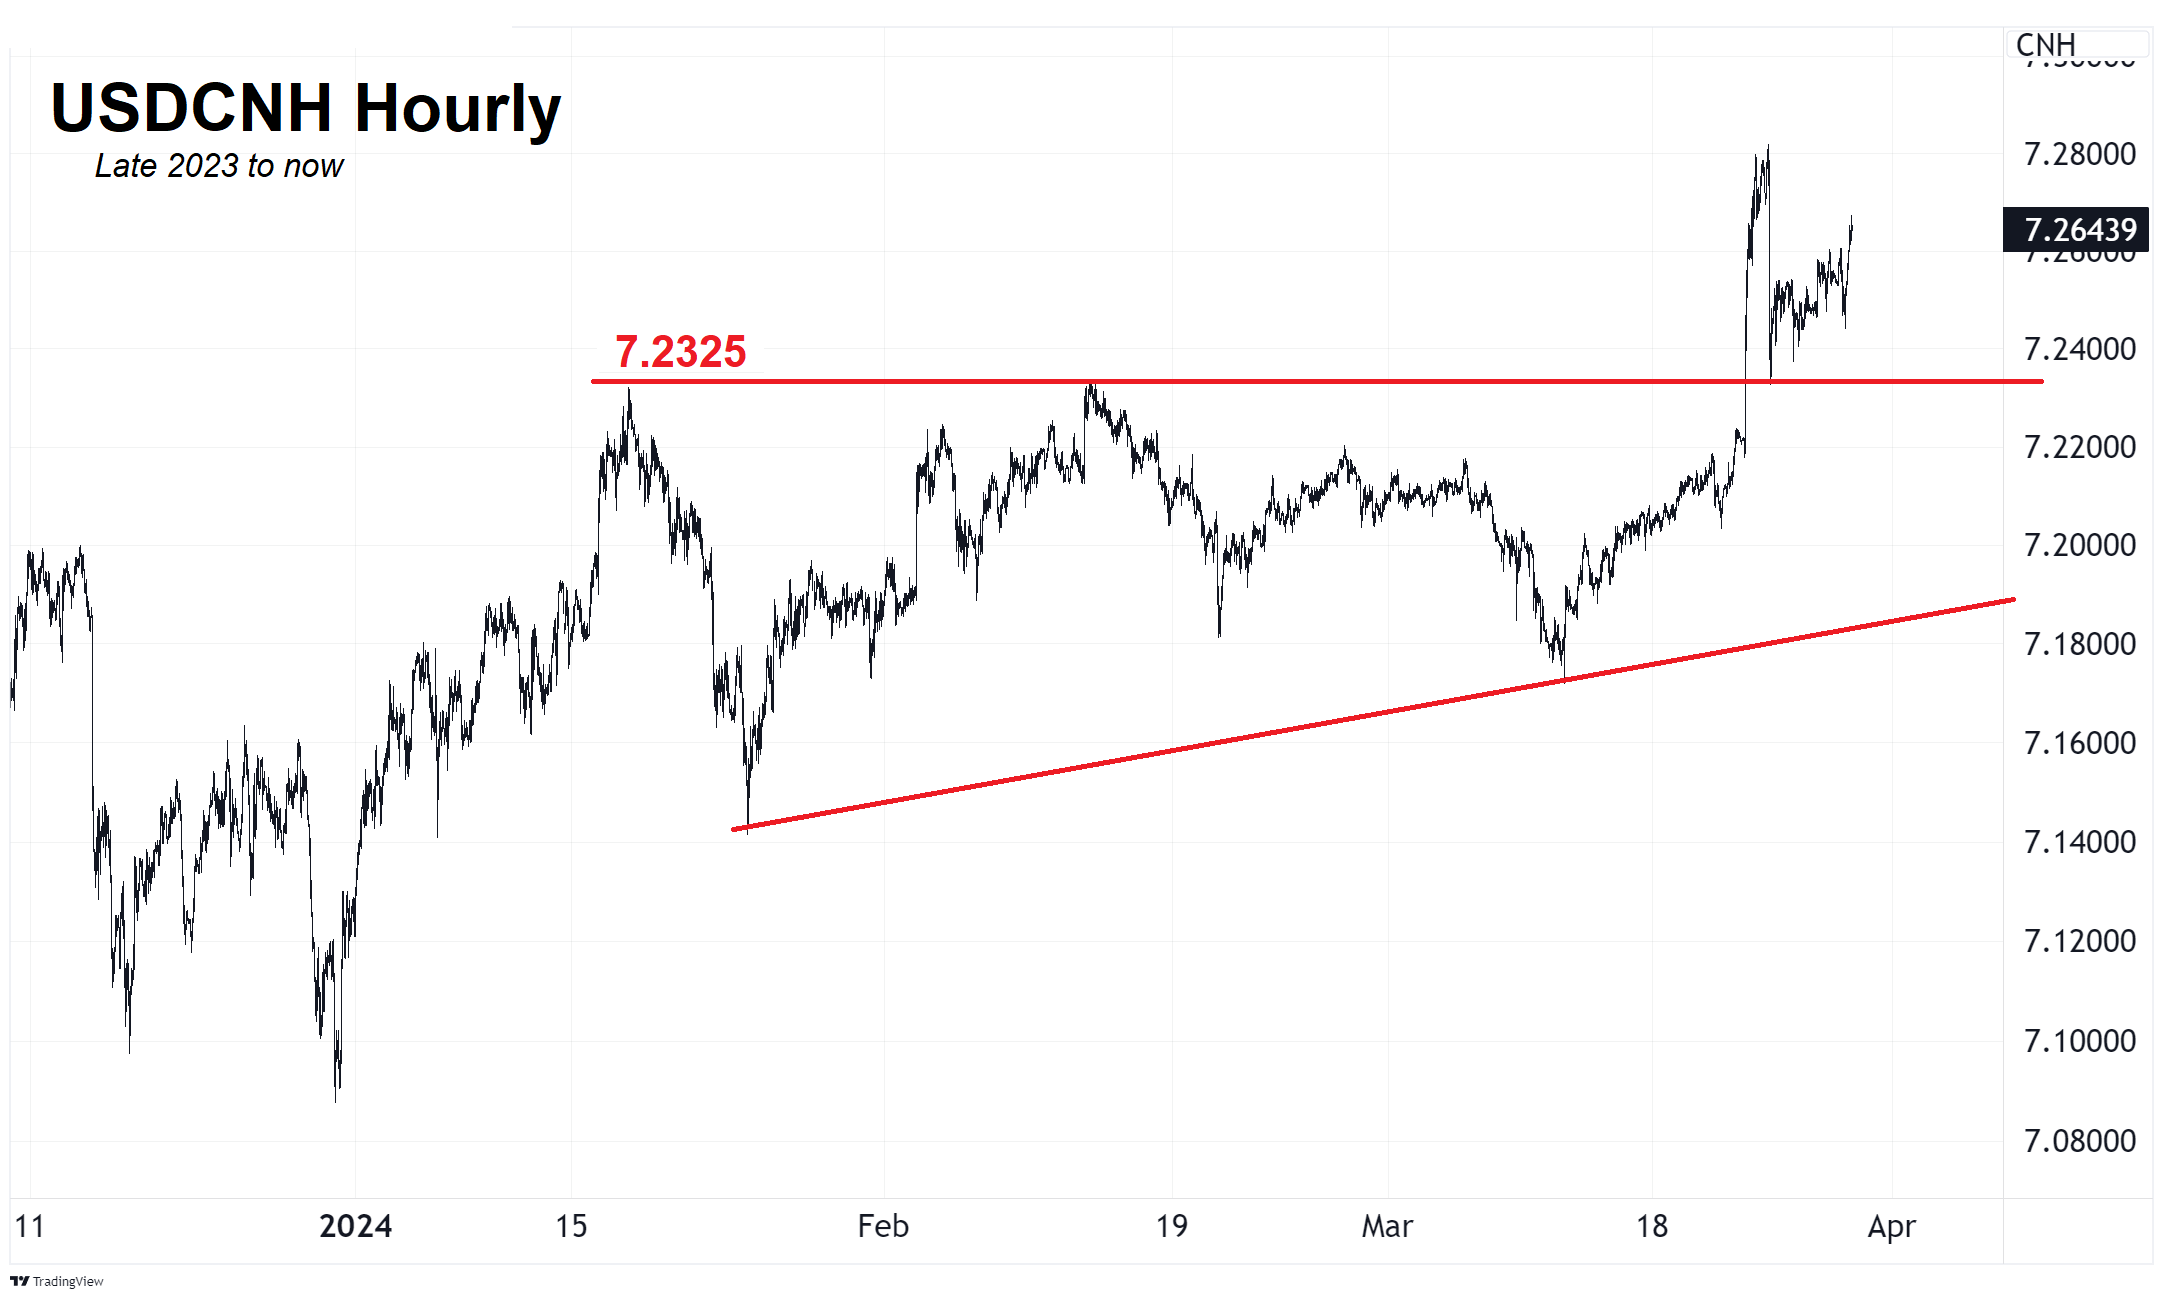
I am a big fan of horizontal lines and also a big fan of the idea that old resistance tends to become support. That’s what looks to be happening here as the old range top (7.2325) is now the new support. Interestingly, the EURCHF chart shows the exact same pattern:
- Rally on news
- Break big resistance
- Pull back to the resistance
- Hold
- Go higher
You can read about why I think horizontal lines are legit right here:
https://www.spectramarkets.com/amfx/technical-analysis-market-structure/
Was that OK? Do people still say legit?

Crypto
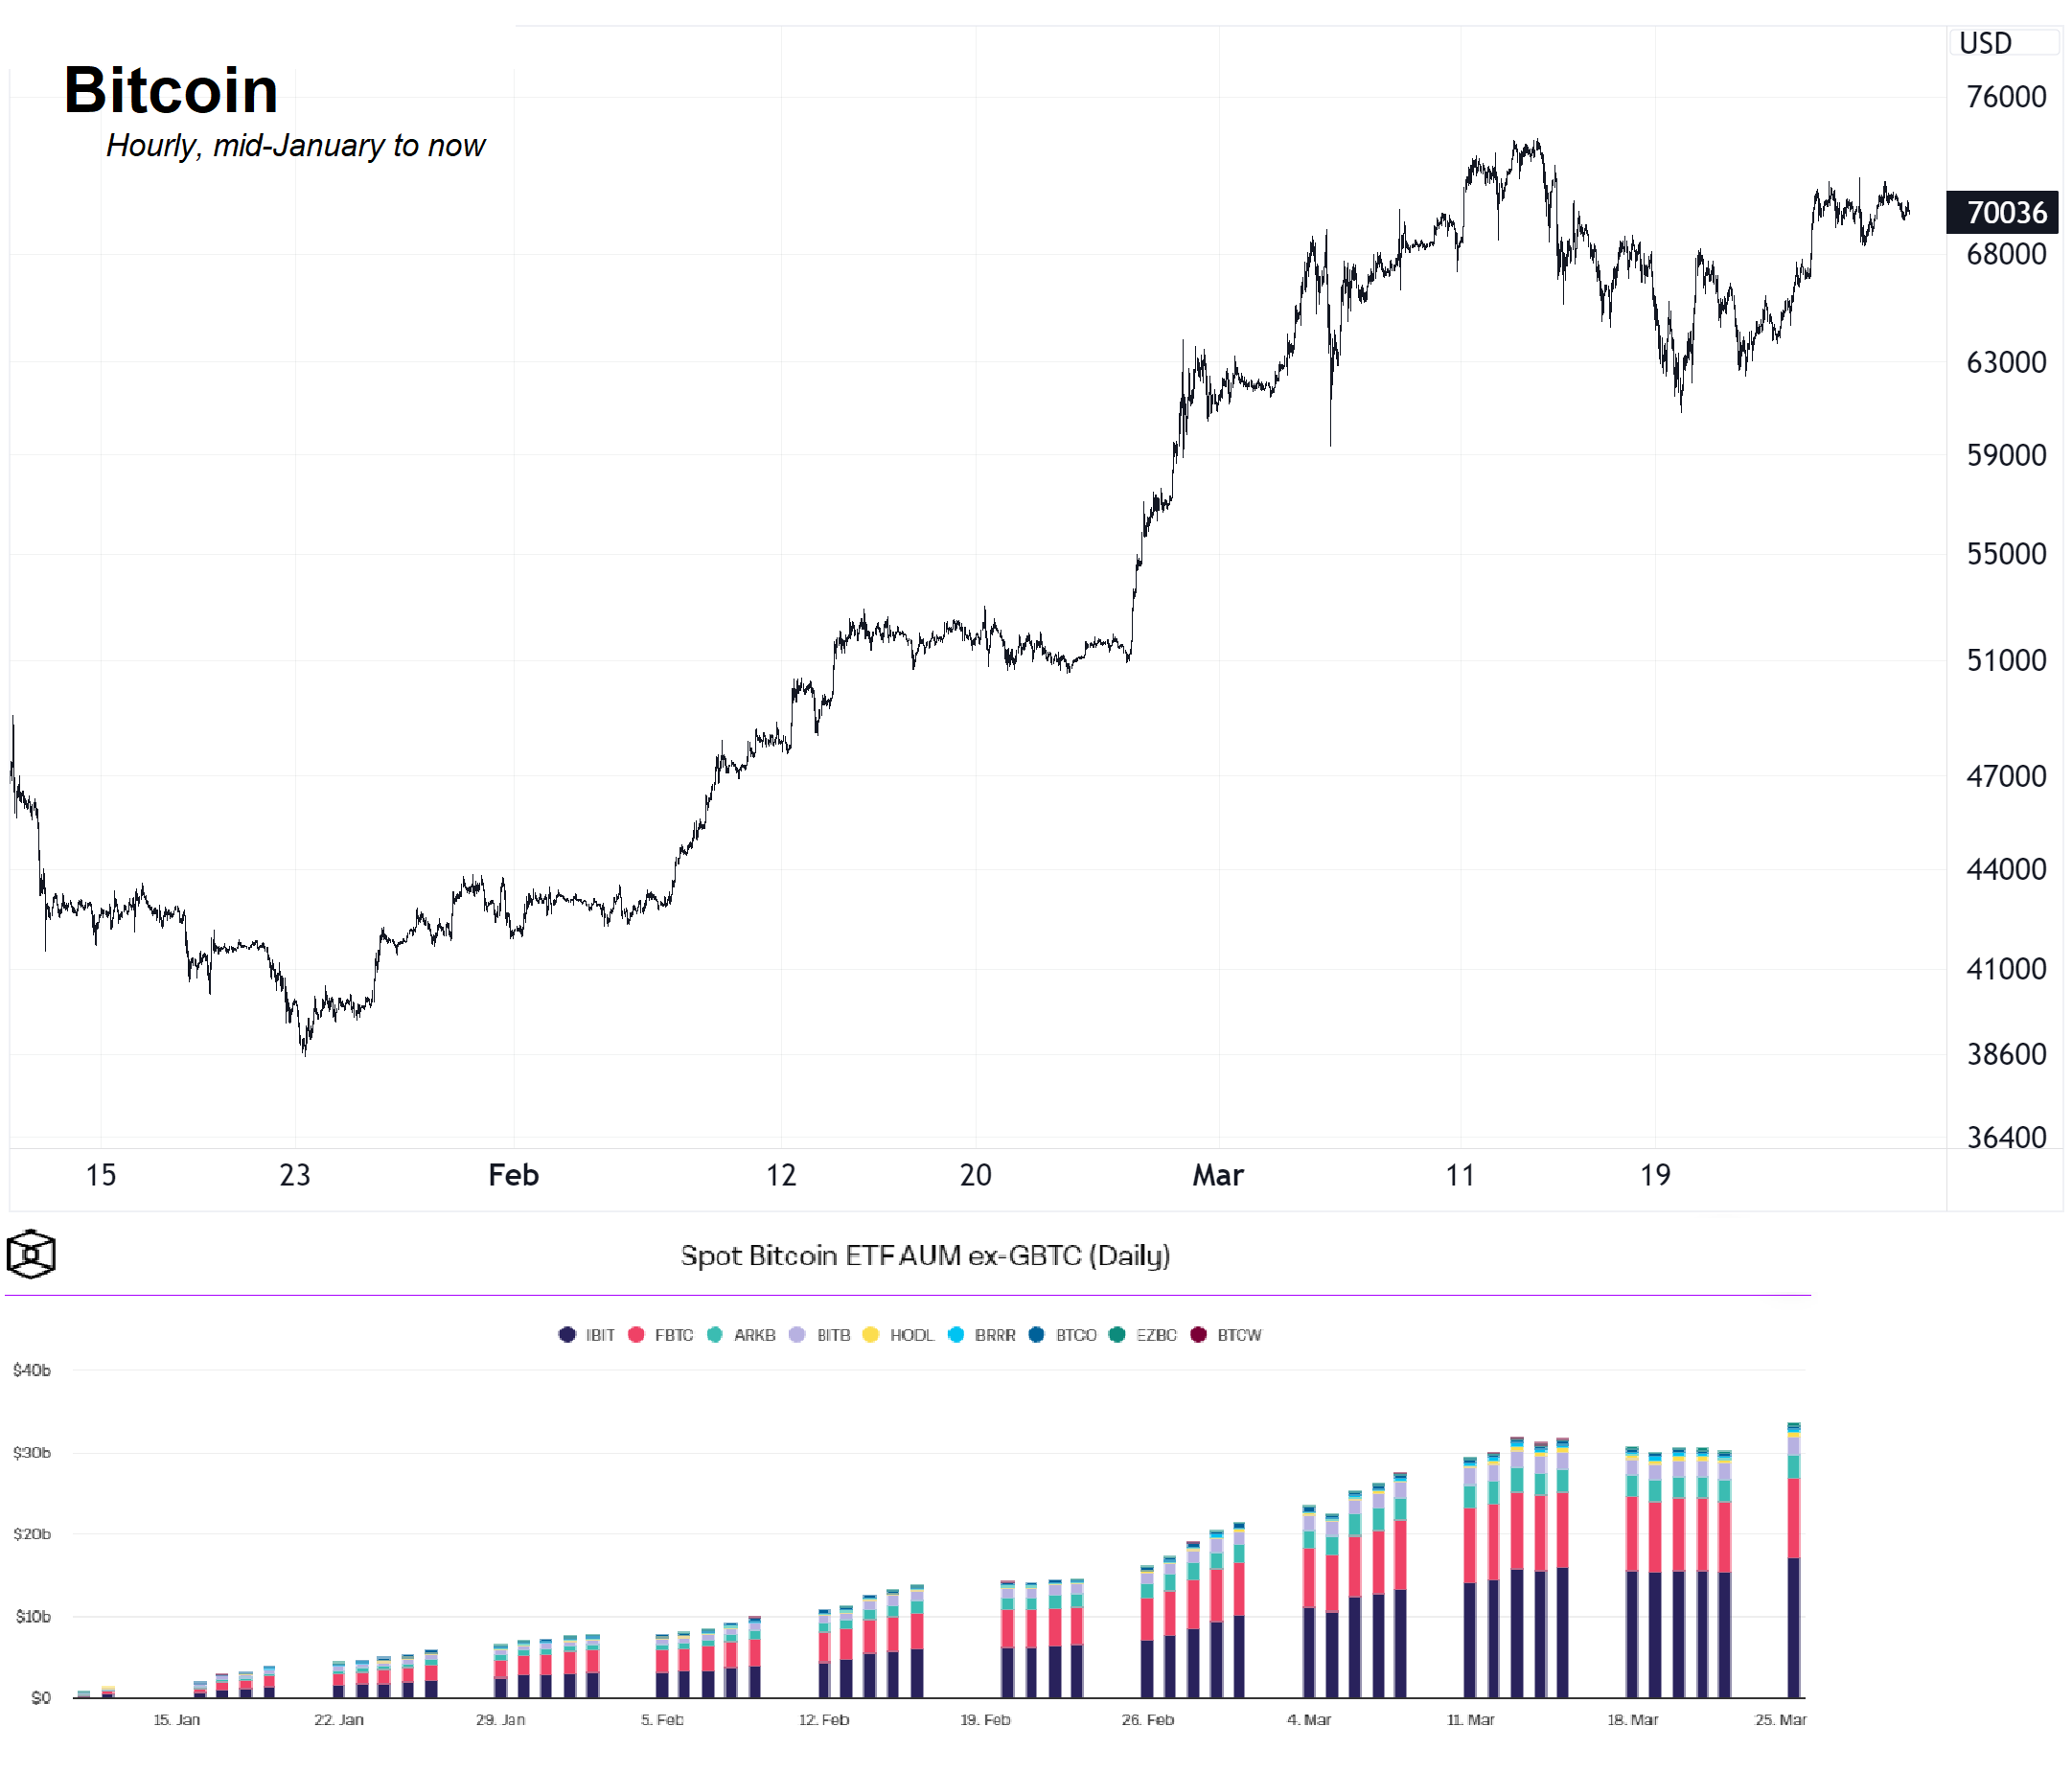
Bitcoin is consolidating as ETF flows cool down. Now, the market is waiting for a new catalyst. You can see that the peak in BTC ETF flows coincided with the peak in the price of BTC, just as every other risky asset peaked around the same time. This will probably be a pattern going forward as the same people that are buying the BTC ETFs are buying QQQ and TQQQ and SOXL and those same people will be bailing on those trades at the same time, too. Or adding as they all break out.
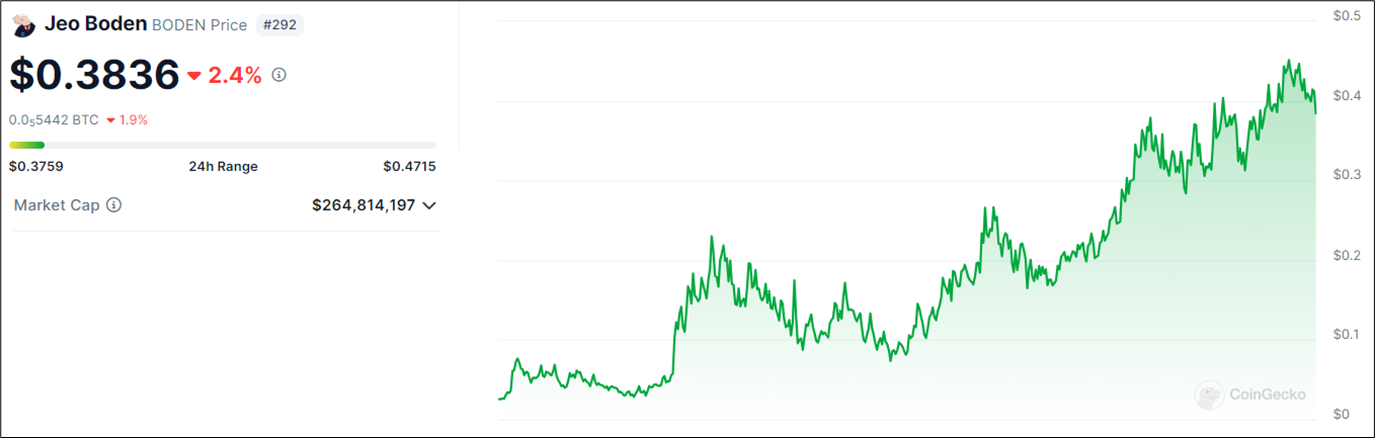
Jeo Boden hasn’t corrected! A blue chip shitcoin! (Not investment advice).
Commodities
Gold continues its upward ascent as central banks hoover and global liquidity remains plentiful. While there are nice narratives in each of the three most popular debasement trades (gold, BTC, QQQ), the reality is that we are experiencing a debasement / Fed Pivot trade, not idiosyncratic moves explained by specific asset class narratives. There are cool narratives, for sure! They help everyone feel smart and give people tribes to belong to. But if you don’t get the liquidity and debasement story right, it’s going to be hard to make money in any of these products. Because they have much in common.
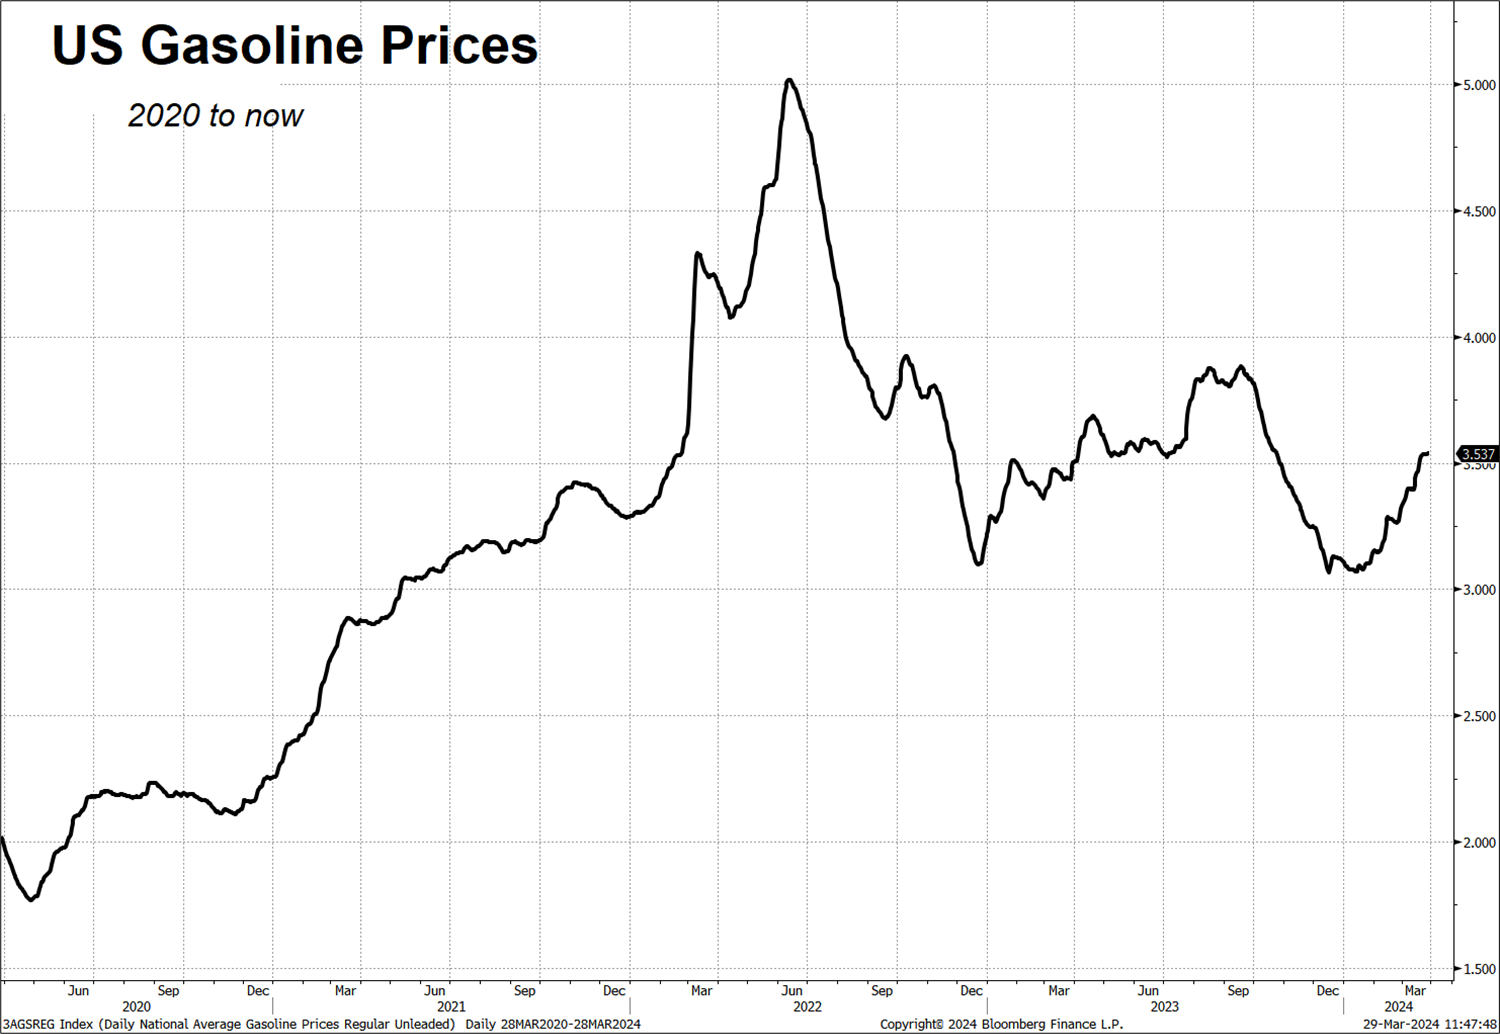
Oil and gas prices could soon become a bit of a concern for central banks as should housing. Gasoline prices are now at 2-year highs and the price of gas and groceries are the most visceral forms of inflation during times of unstable prices. While prices at the pump are moving higher, and look set to average around $4 by summer, there is nothing super terrifying going on. There is, however, modest upward pressure on many prices right now, and so this is worth keeping on your radar.
Don’t forget that gas prices at $4 today are not comparable to gas prices at $4 in 2008. Back then, the average worker in the US made $20 per hour. Now they make $34.48. To look at the real price of gas prices, you can adjust for wages and see how many hours a worker needs to work to buy a gallon of gas. I did it for you!
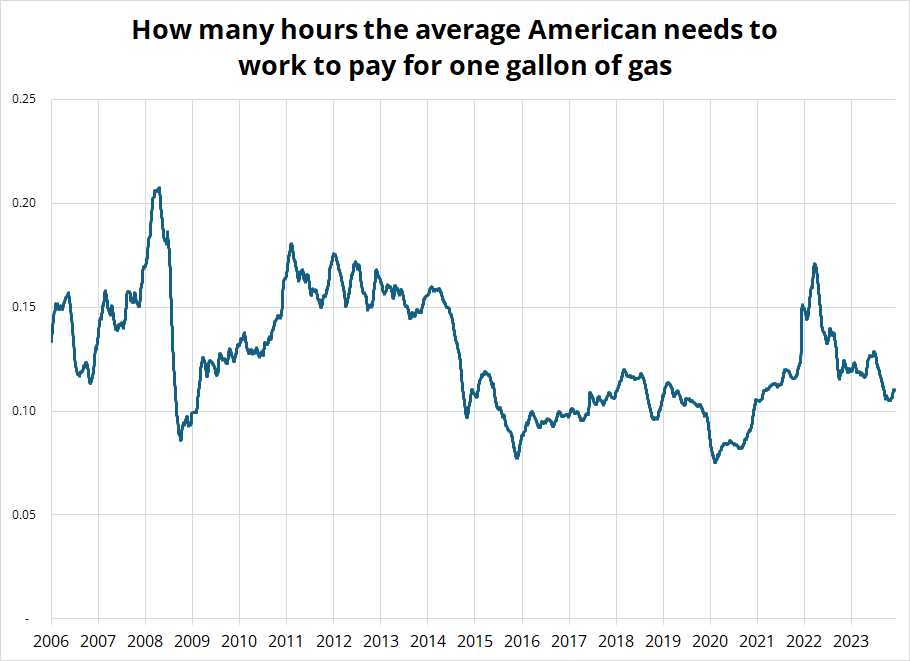
So, while gas prices are rising and that will push headline inflation modestly higher, it’s hard to say it’s a big deal yet.
OK! That was 6 minutes. Please share the Speedrun with any aspiring finance professionals that you know! Thanks!
Get rich or have fun trying.
Links of the week
Join the waitlist for Spectra School. Let’s go! Improve your thinking and learn the right frameworks for trading and investing. The stuff you don’t learn in college. https://www.spectramarkets.com/school/
I want to do this, but it’s hard!
https://www.instagram.com/p/C4_8aYWp35U/?igsh=MXE2ZGVxbXFtdjQ1cA%3D%3D
Smart / interesting

Music
- Much-maligned Miley does Zombie.
- Only for progressive househeads. This song conjures, for me, the feeling of being alone in a massive crowd. Allein means “alone” so that’s probably why. Beautifully constructed track.
