Next week’s FOMC is now a coin toss. Fun. And: Does a weekend sentiment survey predict the future? Definitely (maybe).
Push and Pull
It was a week of crosscurrents and contradiction

Next week’s FOMC is now a coin toss. Fun. And: Does a weekend sentiment survey predict the future? Definitely (maybe).


Most common sources of electricity in the UK
Flat
First up, here’s the link to this week’s podcast with Alfonso Peccatiello, for your weekend listening pleasure. Also always look at the show notes for links, graphs, and useful add ons.
Next week’s FOMC just got interesting as Nick Timiraos is presumed by many to be the rates whisperer and he came out with an article yesterday detailing why the first cut is a coin toss, not a 25bp sure thing. The FT then followed with an article that looked like a GPT-4 remix of the WSJ article.
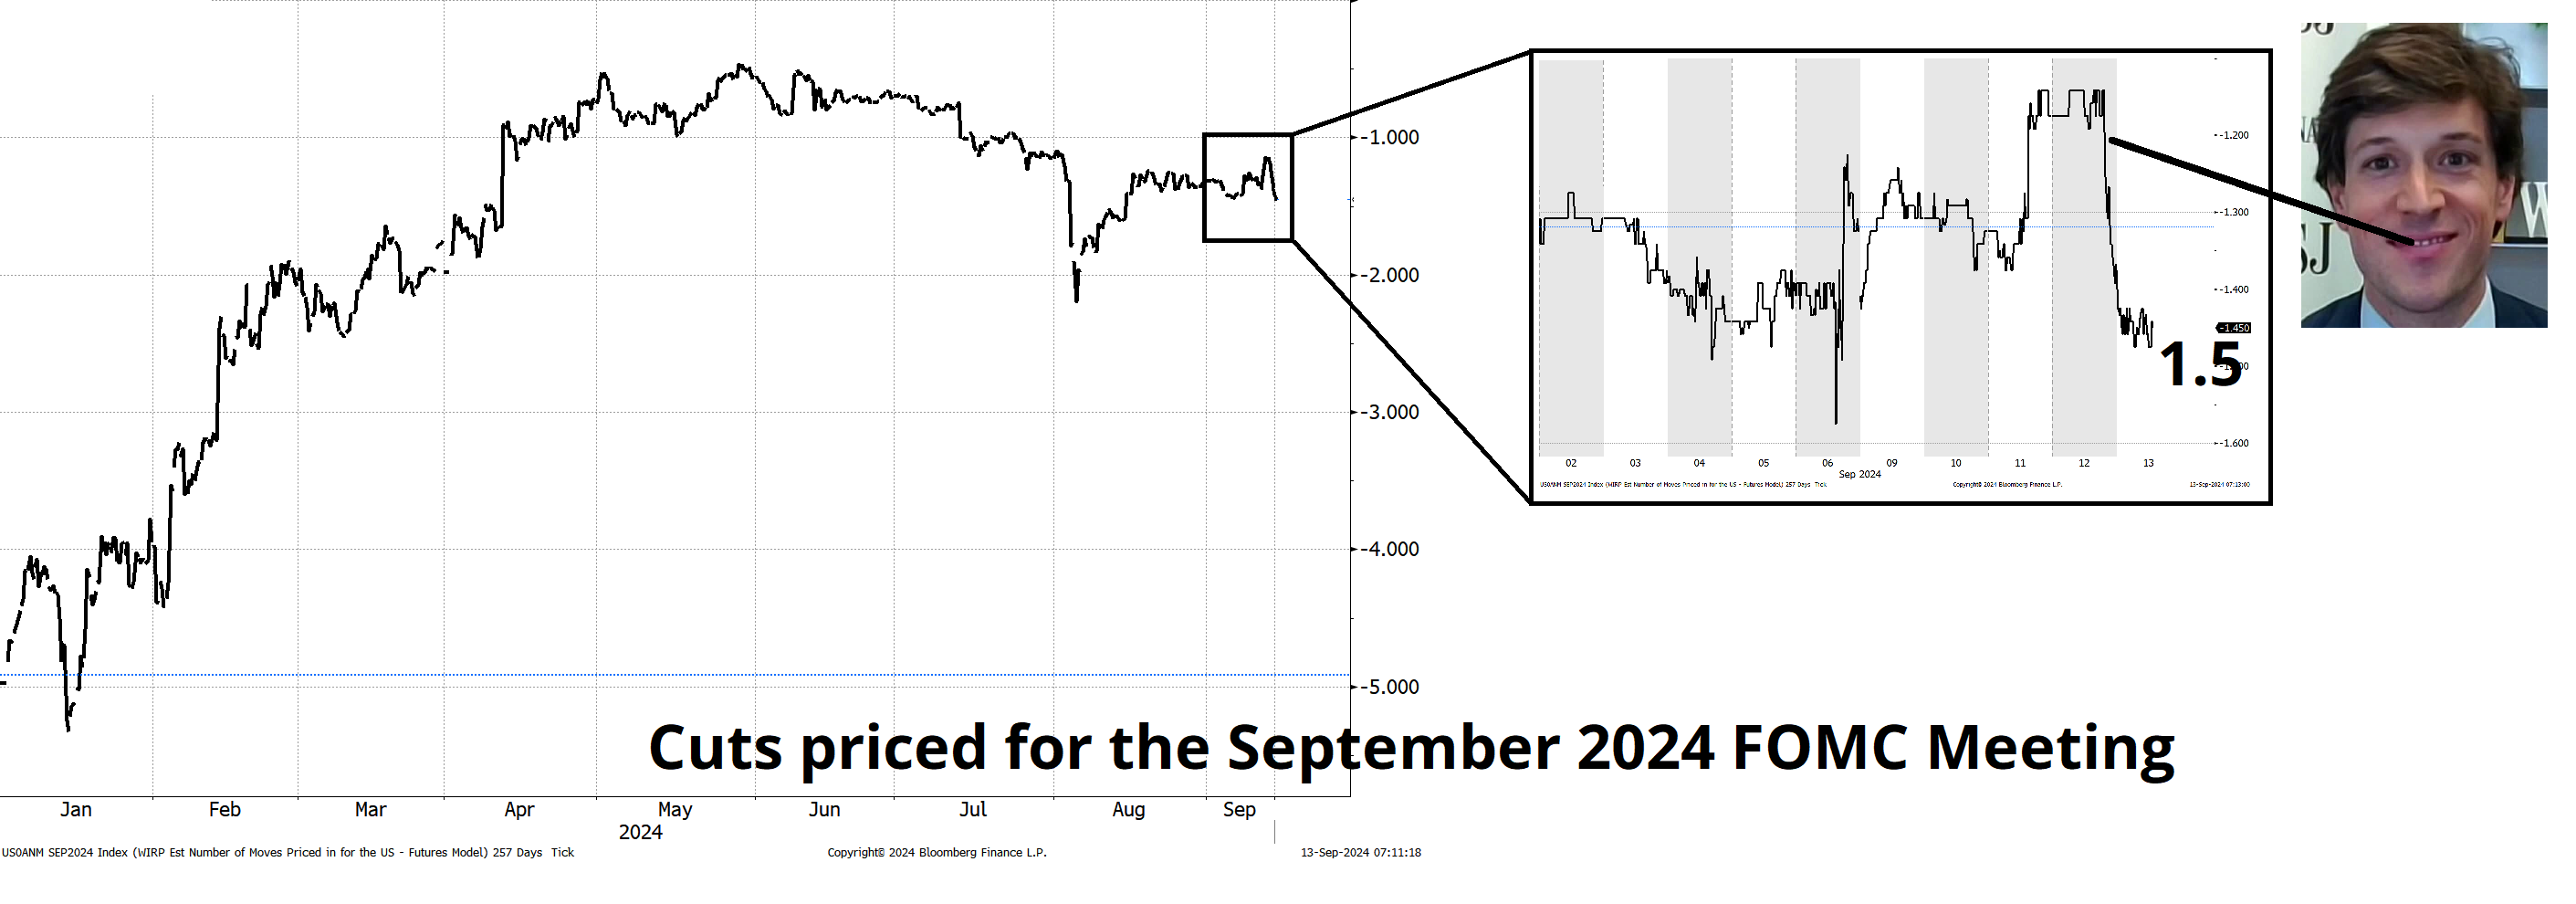
The most interesting aspect of this, of course, is that it means next week’s meeting is in play. It’s a coin toss. Another interesting aspect is that it will offer us another clue as to whether or not the Fed is leaking analysis and information to the public in contravention of its own blackout policy.
During each blackout period, FOMC staff officers as well as staff who have knowledge of information that is related to the previous or upcoming FOMC meeting will refrain from expressing their views or providing analysis to members of the public about current or prospective monetary policy issues.
If the Fed ends up cutting 50bps, this will likely be perceived as another in a long series of unsavory rule-violating Fed stunts following hot on the heels of all the trading scandals and the most recent determination that yet another Fed Governor joined his peers in violating internal rules designed to safeguard the reputation and credibility of the Fed.
Then again, if they go 25bps, the last 24 hours will just be a strange dream.
May you live in interesting times.
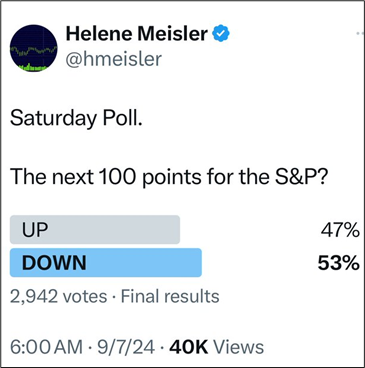
Helene Meisler, a well-known, much-followed voice on FinTwit (and graph paper afficionado) puts out a nice and simple S&P poll every Saturday on Twitter (example below). This week was the first time it was bearish after 6 weeks of bullish readings. I was curious if this might mean anything, or if the survey had any predictive power in general, so I asked Helene to share her data and she’s nice, so she did. :]
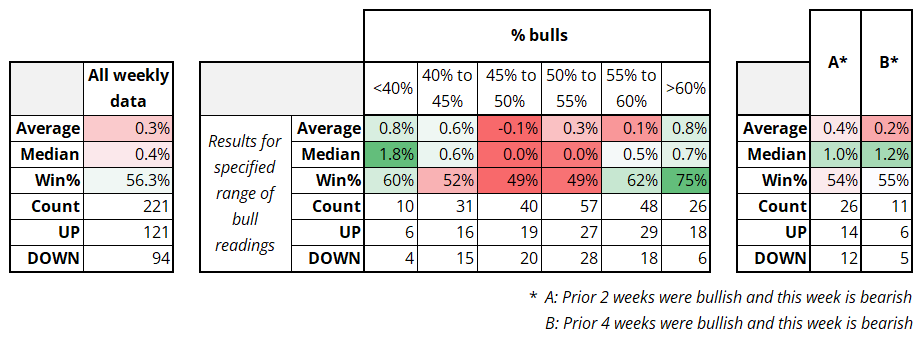
Overall, the results are mildly interesting, but a bit hard to explain. First of all, a few general observations on the data:
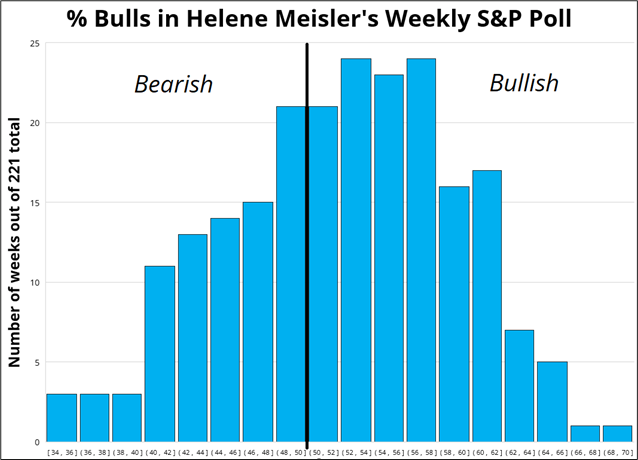
Overall, the survey respondents are more rational than I would expect. There is no negativity bias and extrapolation bias isn’t as bad as I expected.
Ok great, but does it predict the future???
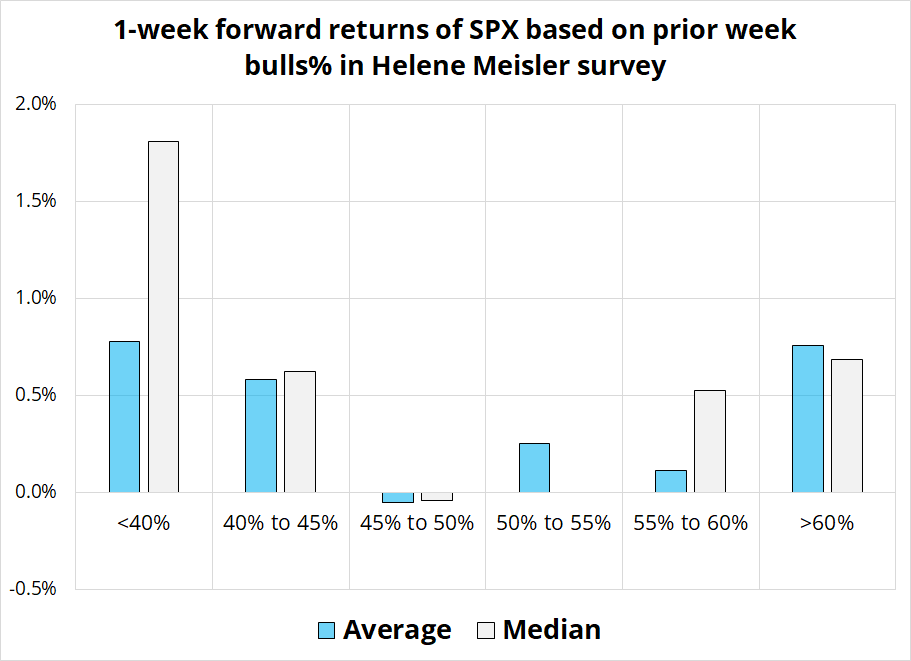
Hard to say! There is a pattern in the data, but I honestly find it hard to explain. When the survey results are super bullish or super bearish, the S&P 500 tends to rally significantly in the week that follows. When the survey results are 50/50, the S&P 500 trades flat or weak.
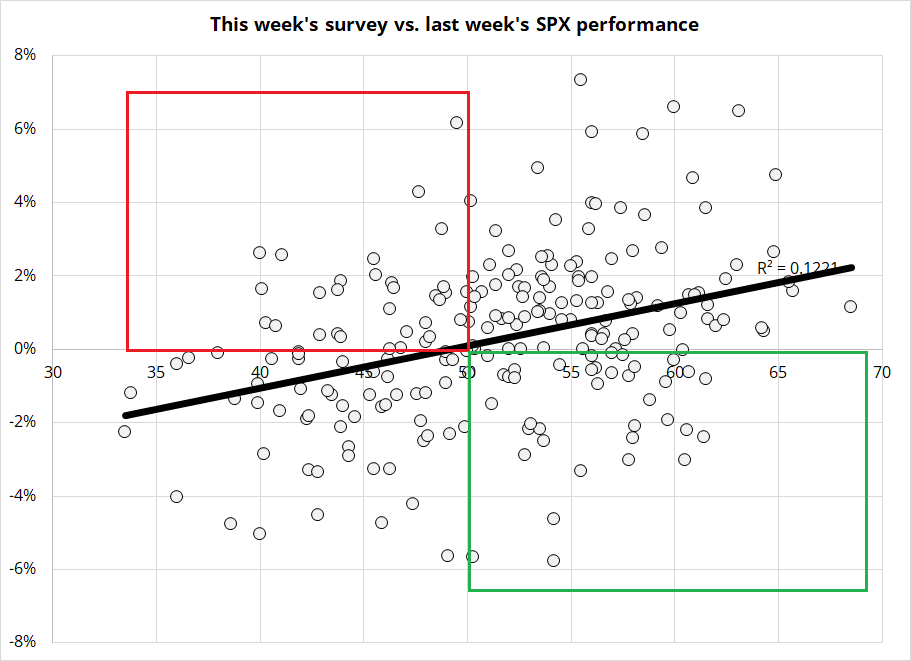
Also, when the data flips from bullish to bearish, the S&P 500 tends to outperform in the week that follows. In all these cases, the results have a decent sample size, so I would be inclined to think this effect is not random, but I’m not sure.
This grid shows the output.
And here’s a separate chart showing the main data: next week’s S&P 500 change vs. this week’s survey.
Explanatory theories welcome. Thanks Helene!
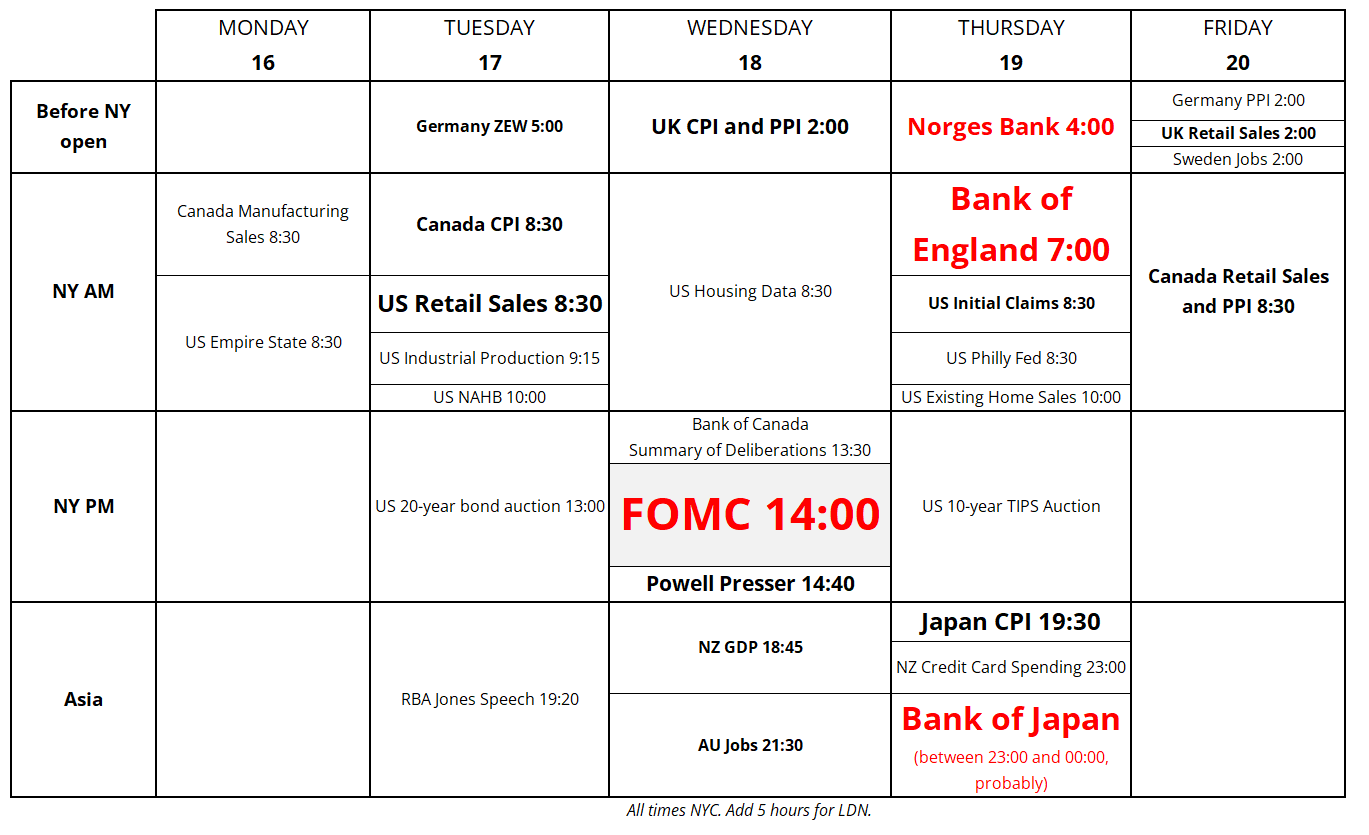
Next week’s highlights include meetings from four of the ten big central banks, including the Big One. We also get ZEW, US Retail Sales, and meaningful data from the UK, AU, NZ, and CA. Here it is, for your week ahead planning purposes.
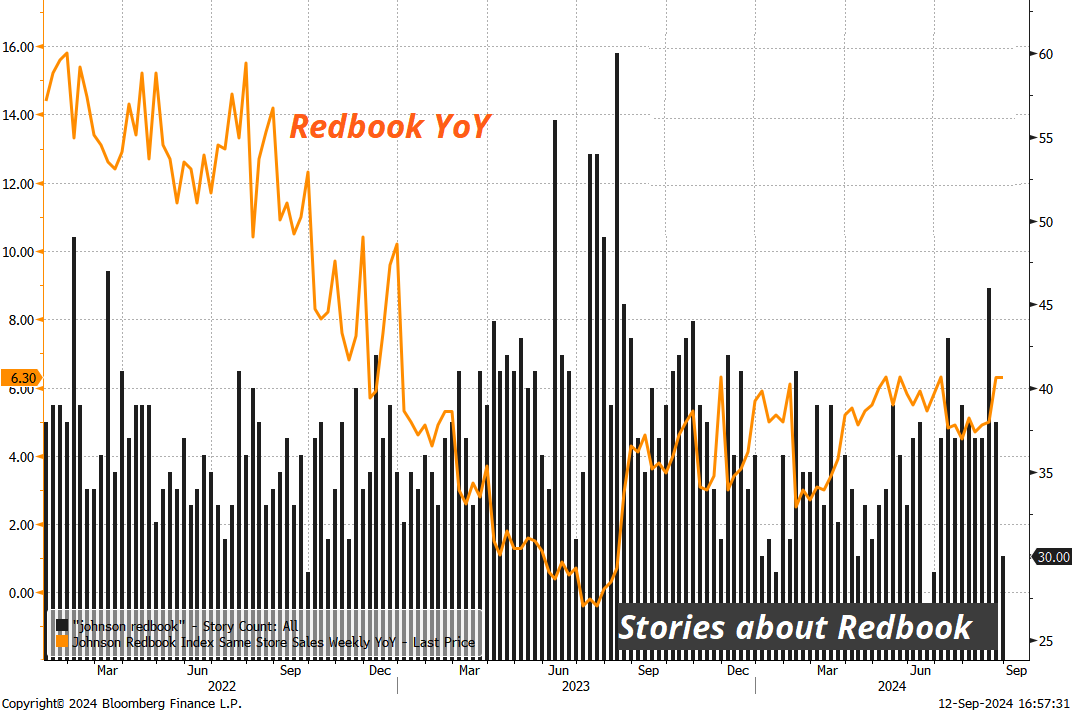
Have you noticed how you stopped hearing about Johnson Redbook? It’s a useless indicator, but it was heavily touted last year purely because it was weak — and that is how confirmation bias works. Now that it’s showing YoY gains, magically nobody cares about it. The chart I made below shows the number of stories on Bloomberg about Johnson Redbook (black bars) and the data itself (orange line). Negativity bias is real.
Don’t forget to watch the 2-minute Spectra School video this weekend.
Have a plugged in day.
It was a week of crosscurrents and contradiction

The risk reversal is a bit of a yellow flag in euro, even though I don’t want to believe it
