
This week saw a continuation of the drop in US yields as the market is pretty badly offside and rate cut expectations are mounting all around the world, especially in Europe.

Here’s what you need to know about markets and macro this week
Global Macro
The year is 93% done. You just about made it! This week saw a continuation of the drop in US yields as the market is pretty badly offside and rate cut expectations are mounting all around the world, especially in Europe. Inflation is collapsing and has flipped negative in some countries as the supply chain snaggles are a distant memory, demand is soft, and fiscal policy has normalized in most places.
Markets entered the week in a euphoric state of mind as crypto and altcoins once again fund lambo purchases, equities retest the highs and financial conditions continue to loosen after the Treasury / Fed intervention in the bond market.
Economic data this week was mixed, but the trend toward lower yields is strong and the fake rate cuts priced in for ages have now become more like realistic possibilities. There are two types of rate cuts that can be priced into markets.
- Nobody in the world thinks rates are going to be cut, but say there’s a 20% of a stock market crash or rapid onset of recession and those outcomes will lead to five rate cuts… That distribution will cause the market to price in one cut (20% X 5) even though not one person in the world has rate cuts as their base case. That was the market in 2023.
- Many people think the Fed and ECB will cut in the next six months and the market starts to price in a rate cut cycle. That is the market now. These rate cuts are coming as the market has now embraced the base case that inflation will be at or below target in many countries soon and central banks can take their feet off the brakes and get out of restrictive territory and back to neutral.
Here’s CPI in Switzerland, where the monthly figure has been negative in 3 of the past 5 months.
Switzerland YoY CPI, 2011 to now
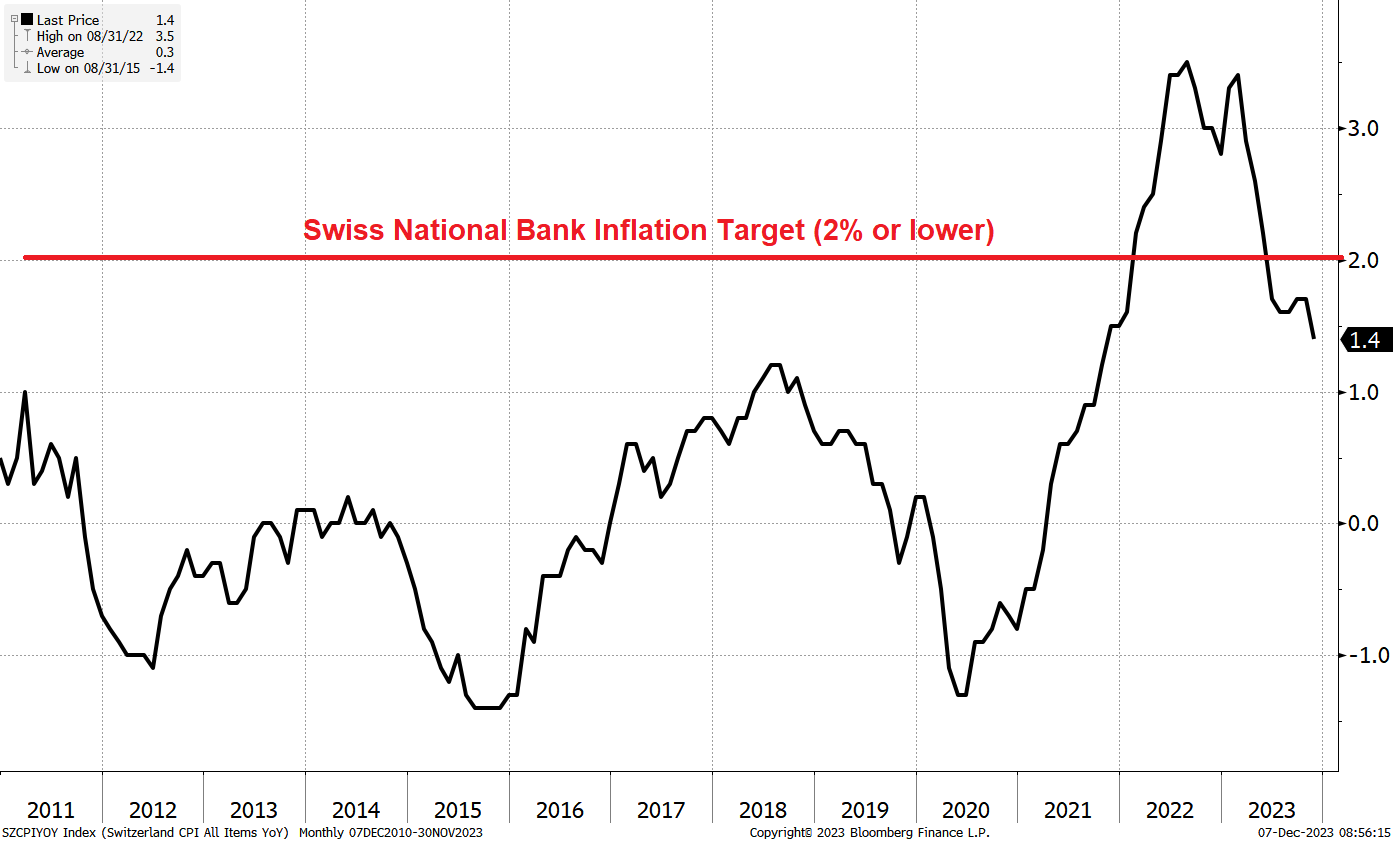
This figure includes a ton of positive monthly numbers that will drop out one by one and be replaced by lower or negative numbers so this thing is going to keep dropping. Same is true in most of Europe and the USA could be back below 2% soon too.
People are used to falling inflation being a bad thing because it’s representative of recession, cratering demand, and badness. But the current global fall in inflation is probably a good thing! We’re headed back to normal, low rates of inflation. The risk now is that we get too much of a good thing and return to the secular stagnation that characterized the 2011-2019 period.
All other things being equal, central banks are biased to keep rates lower than they should be because central bankers are politicians and the path of least regret is to let the economy run hot. They had to abandon this bias when the politics of inflation changed in 2022 and employment was rocking. Now that inflation is falling, central bankers will go back to their old ways.
You can also argue that central bankers are part of the global elite and the global elite does not want to see Donald Trump elected in 2024. That’s another reason you can expect the Fed to err on the dovish side next year. They don’t want to squeeze the economy ahead of the November 2024 presidential election.
Stocks
Here’s what stocks were doing until NFP. LOL.
SPX 5-minute chart back to 24NOV
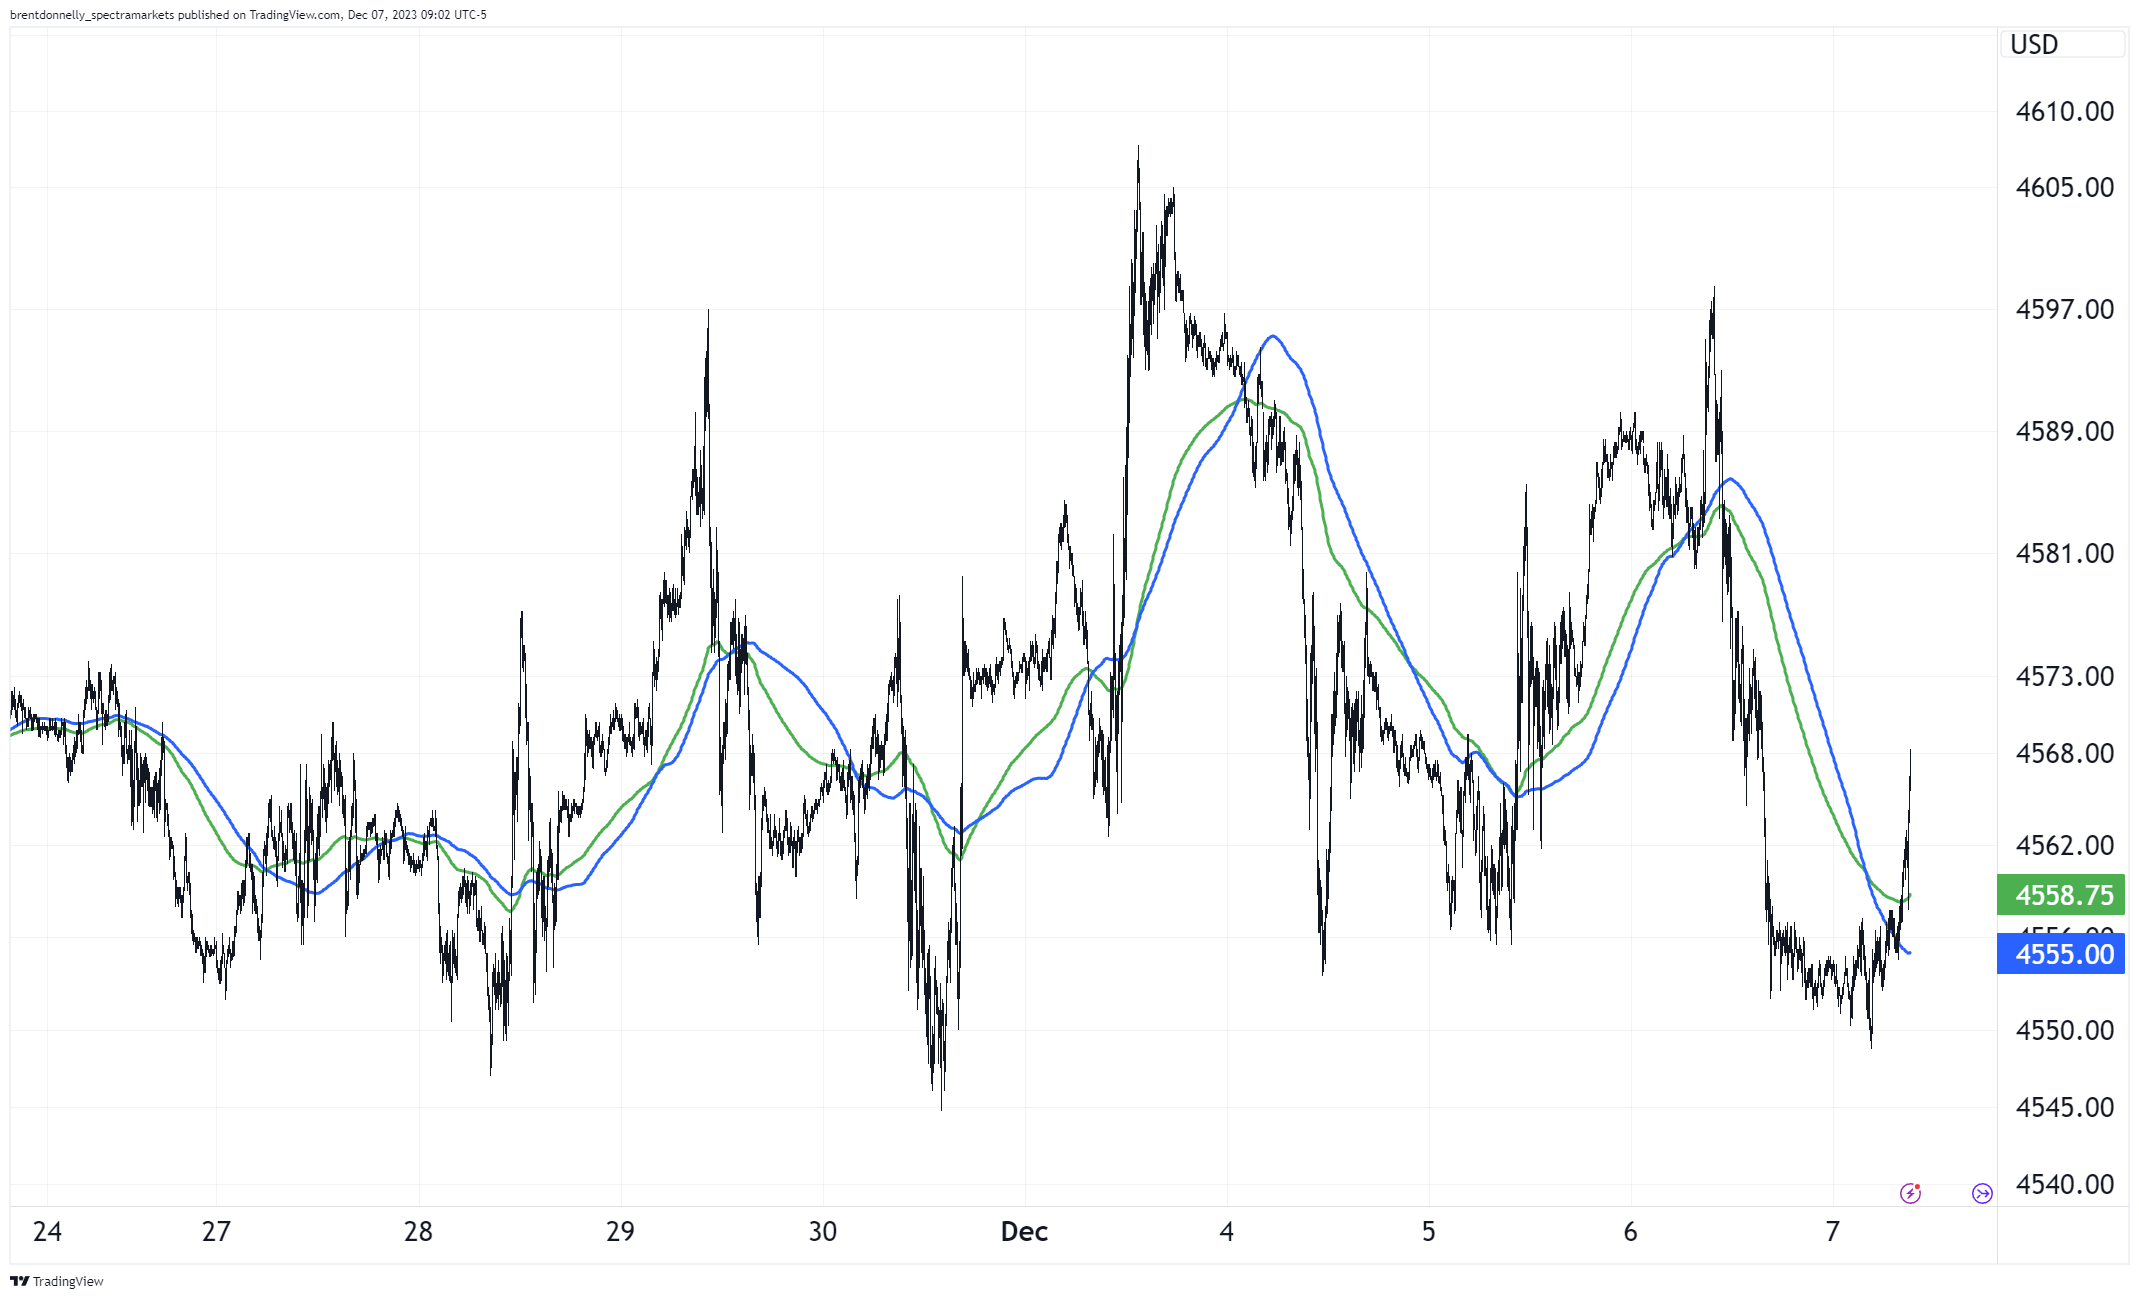
No wonder VIX is bobbing around 13. Realized vol is in the toilet. The stock market has priced in a lot of good news and it looks tired. If you’re one who likes to trade from the short side, this is a pretty good setup with much euphoria percolating in various spots (especially crypto) and CPI and Fed next week posing some risks to the dovish vibe. Some charts are still below resistance but most are breaking out.
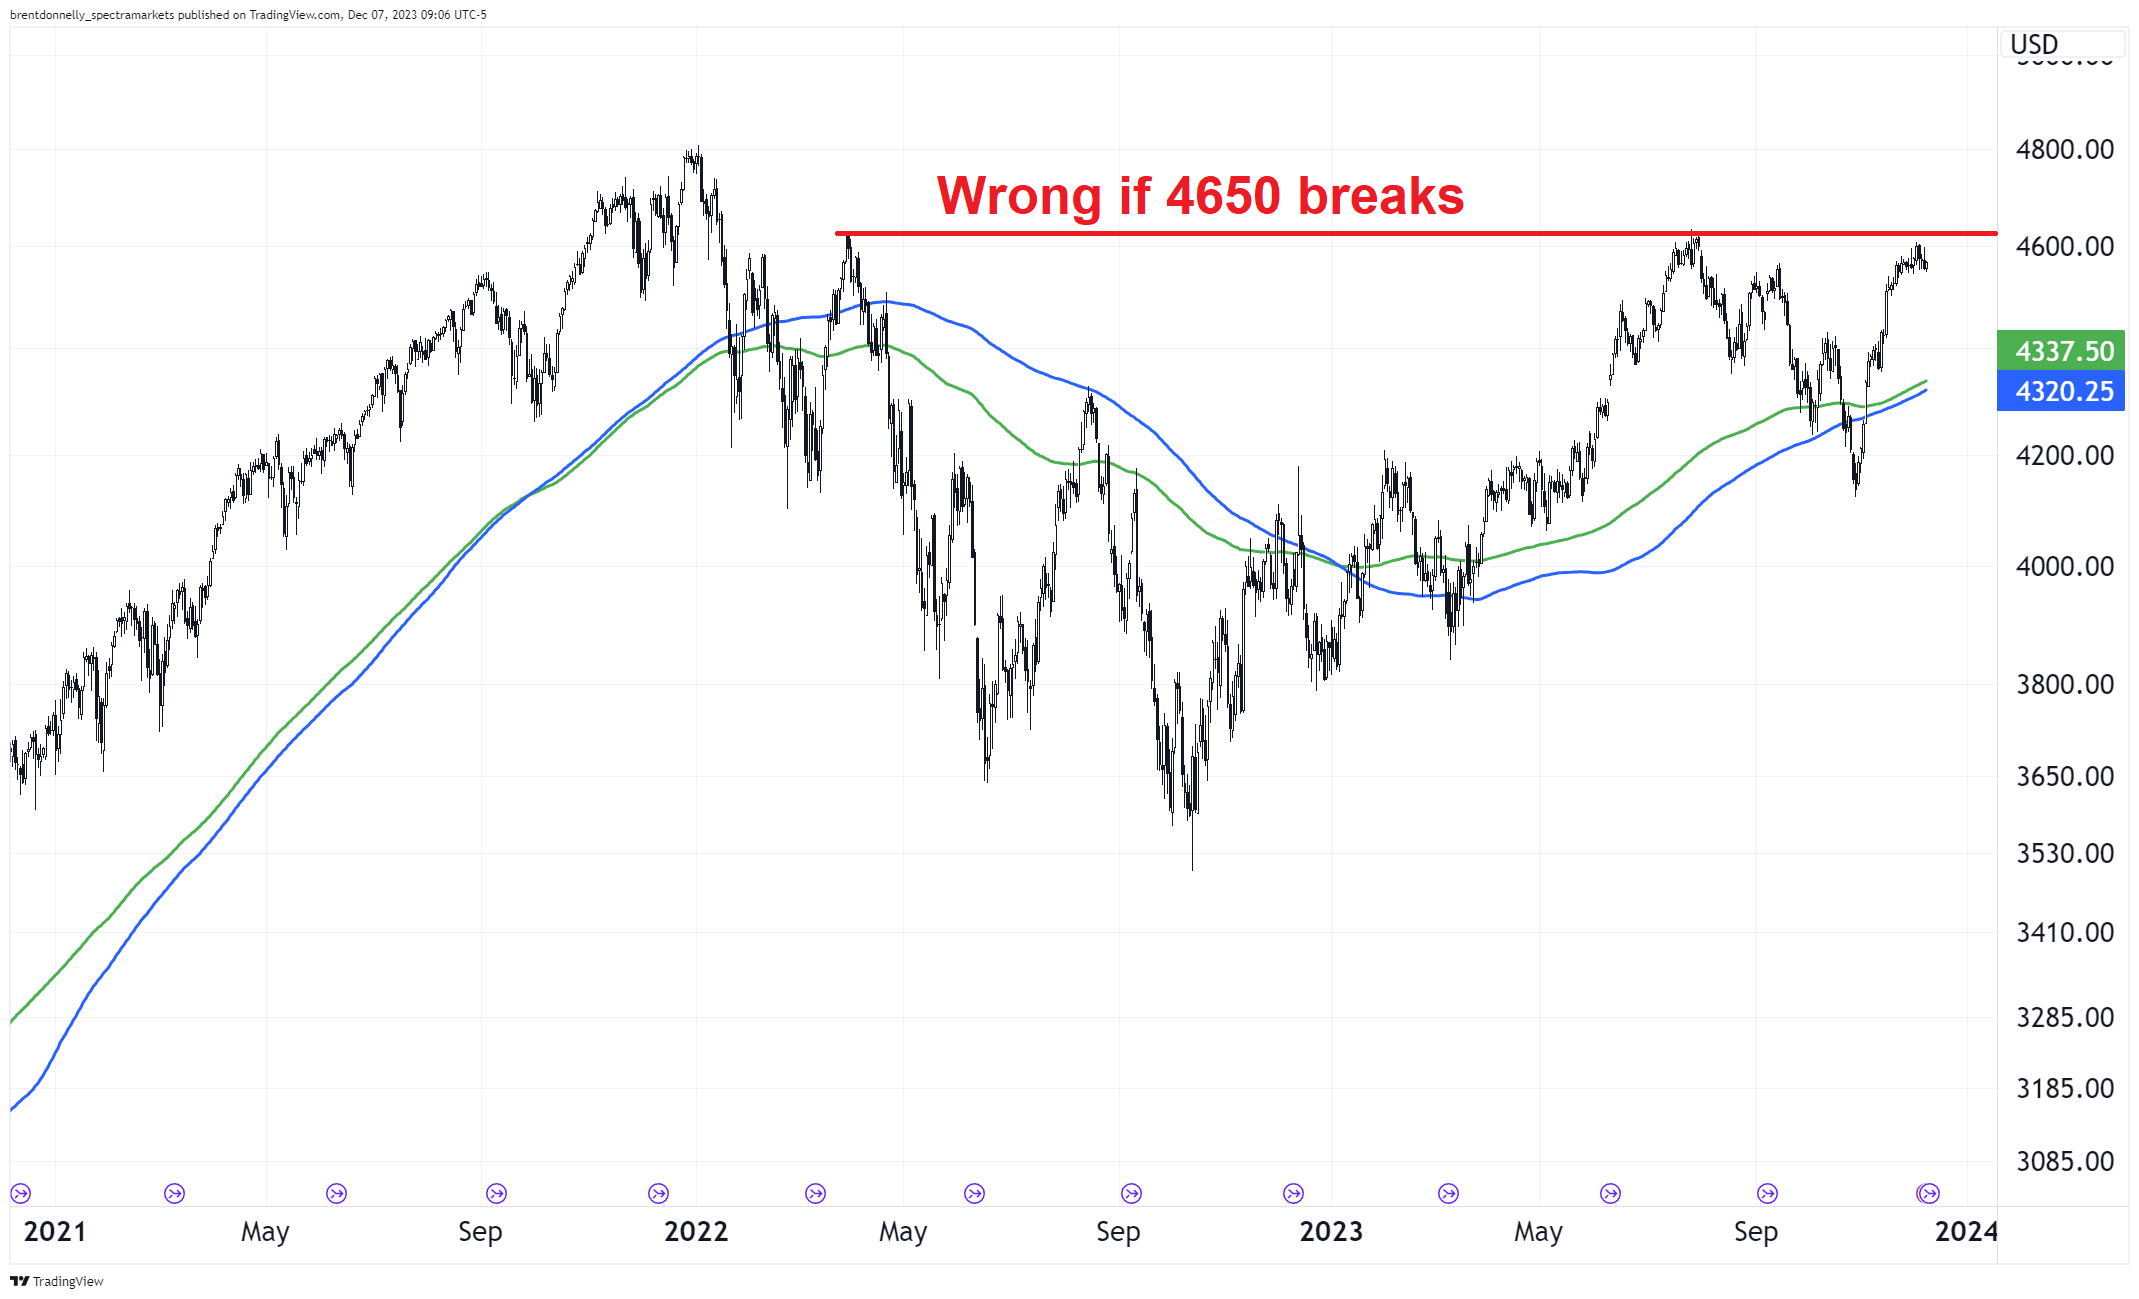
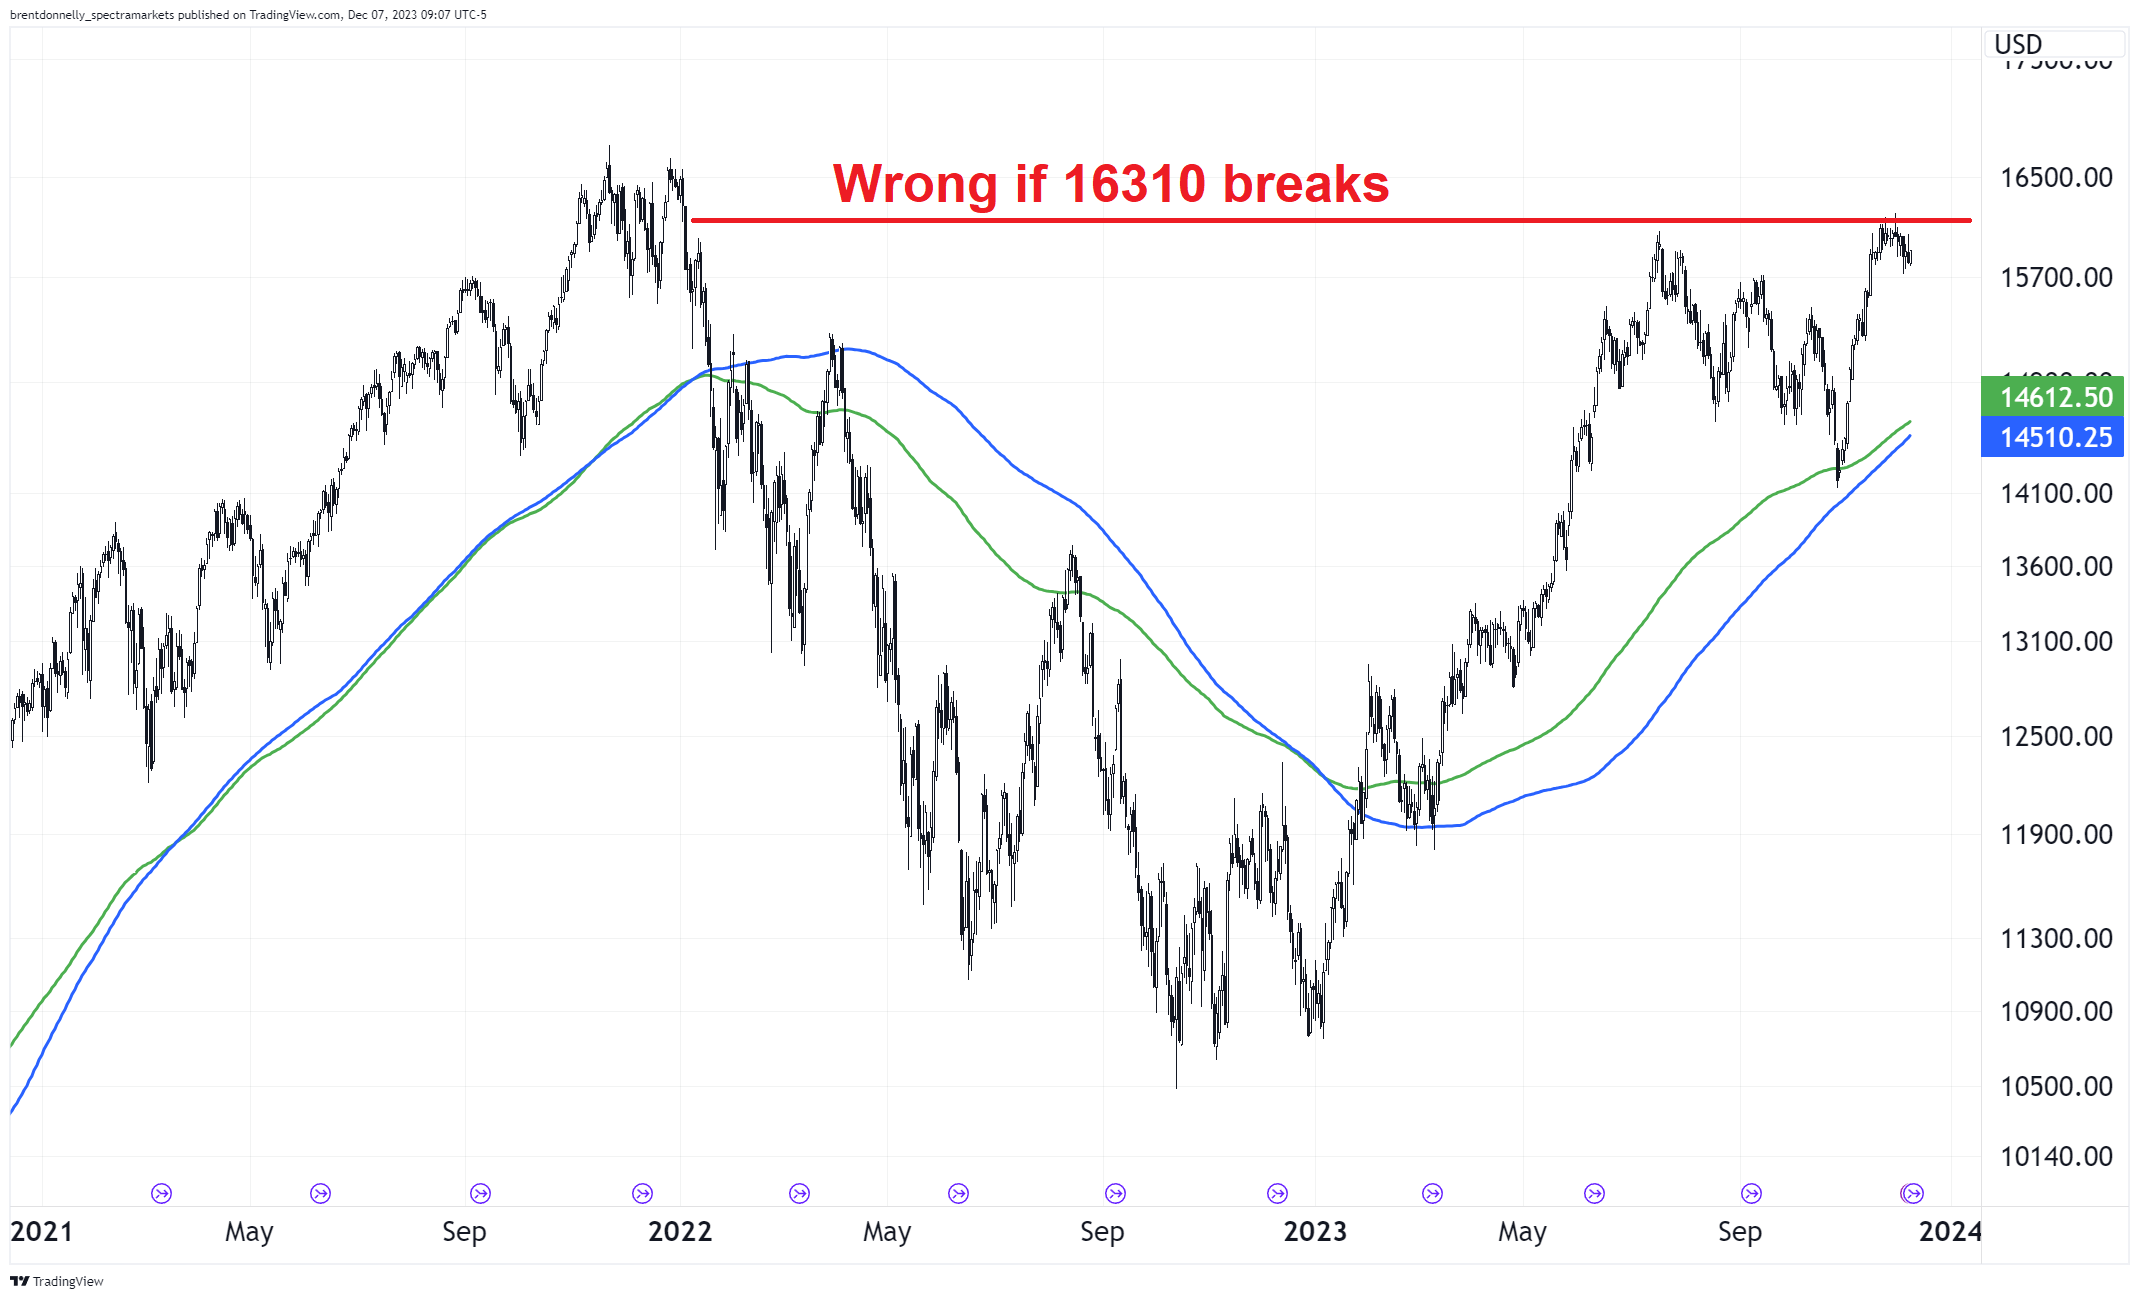
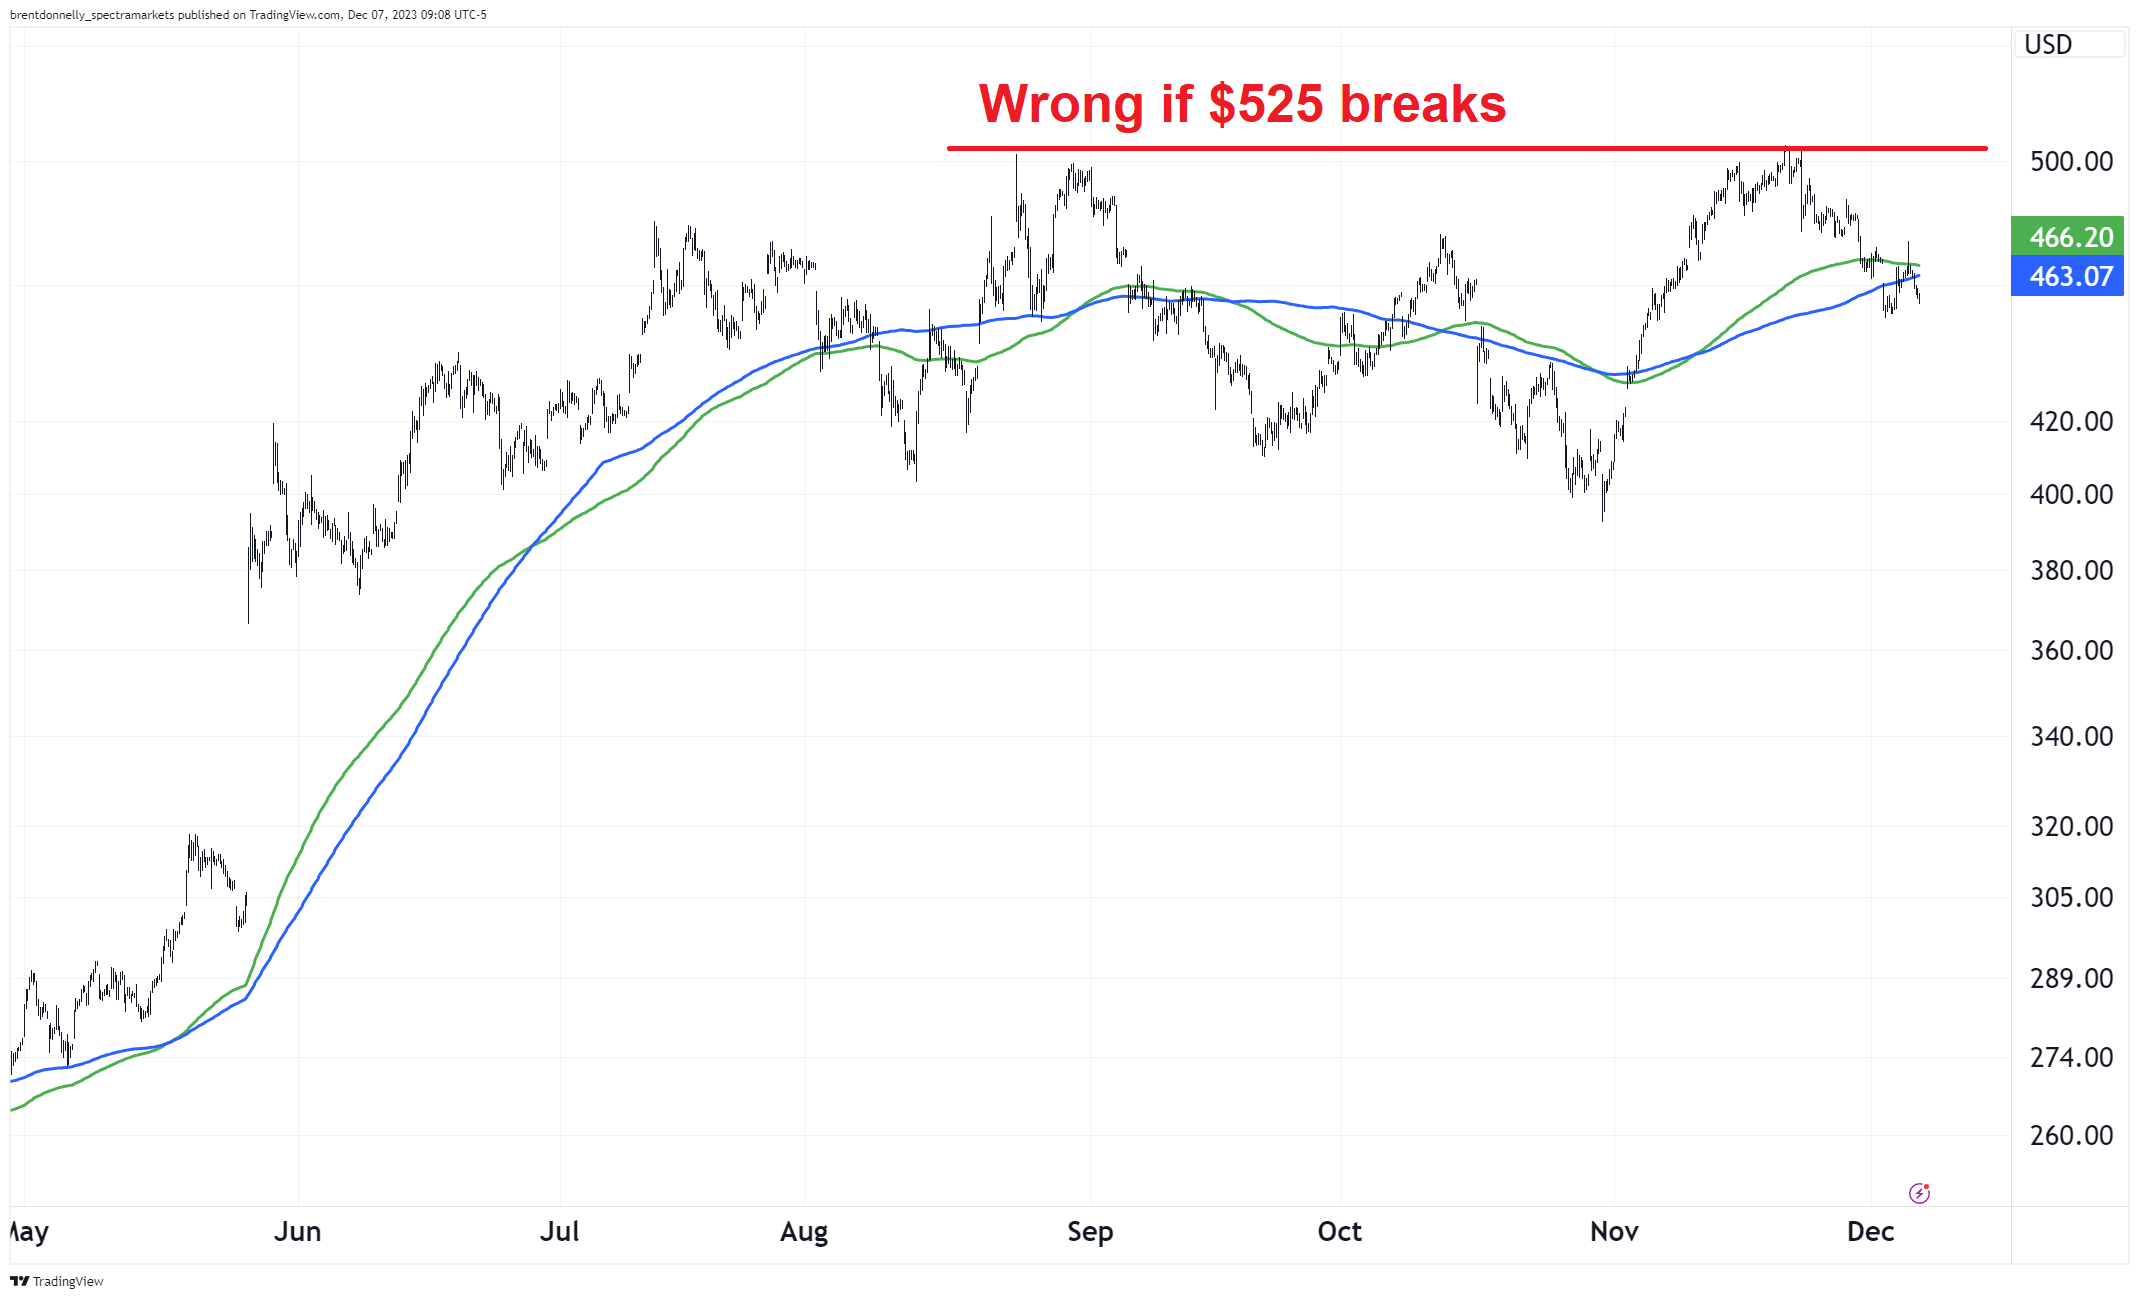
Here’s where everything stood yesterday before today’s moonshot. I had lines drawn for where the shorts are wrong. S&P is through, NASDAQ is right there and NVDA still below.
Eminis daily chart back to 2021
NASDAQ futures daily chart back to 2021
NVDA hourly chart back to May 2023
When you’re short, you’re fighting the carry/borrow, the skew, dividends (sometimes), and the long-term drift of profits, monetary debasement, and innovation. But it’s still very often fun and profitable. Just gotta be tactical. Shorting stocks is a hard way to make a living but things feel stretched to me so I don’t love long either.
Here is this week’s 14-word stock market summary: Stocks never tire. Euphoria is visible in many areas. Short-term caution is warranted.
Interest Rates
The path of least resistance for yields has been down as inflation falls faster than most people expected.
US 10-year yield, 5-minute chart this week
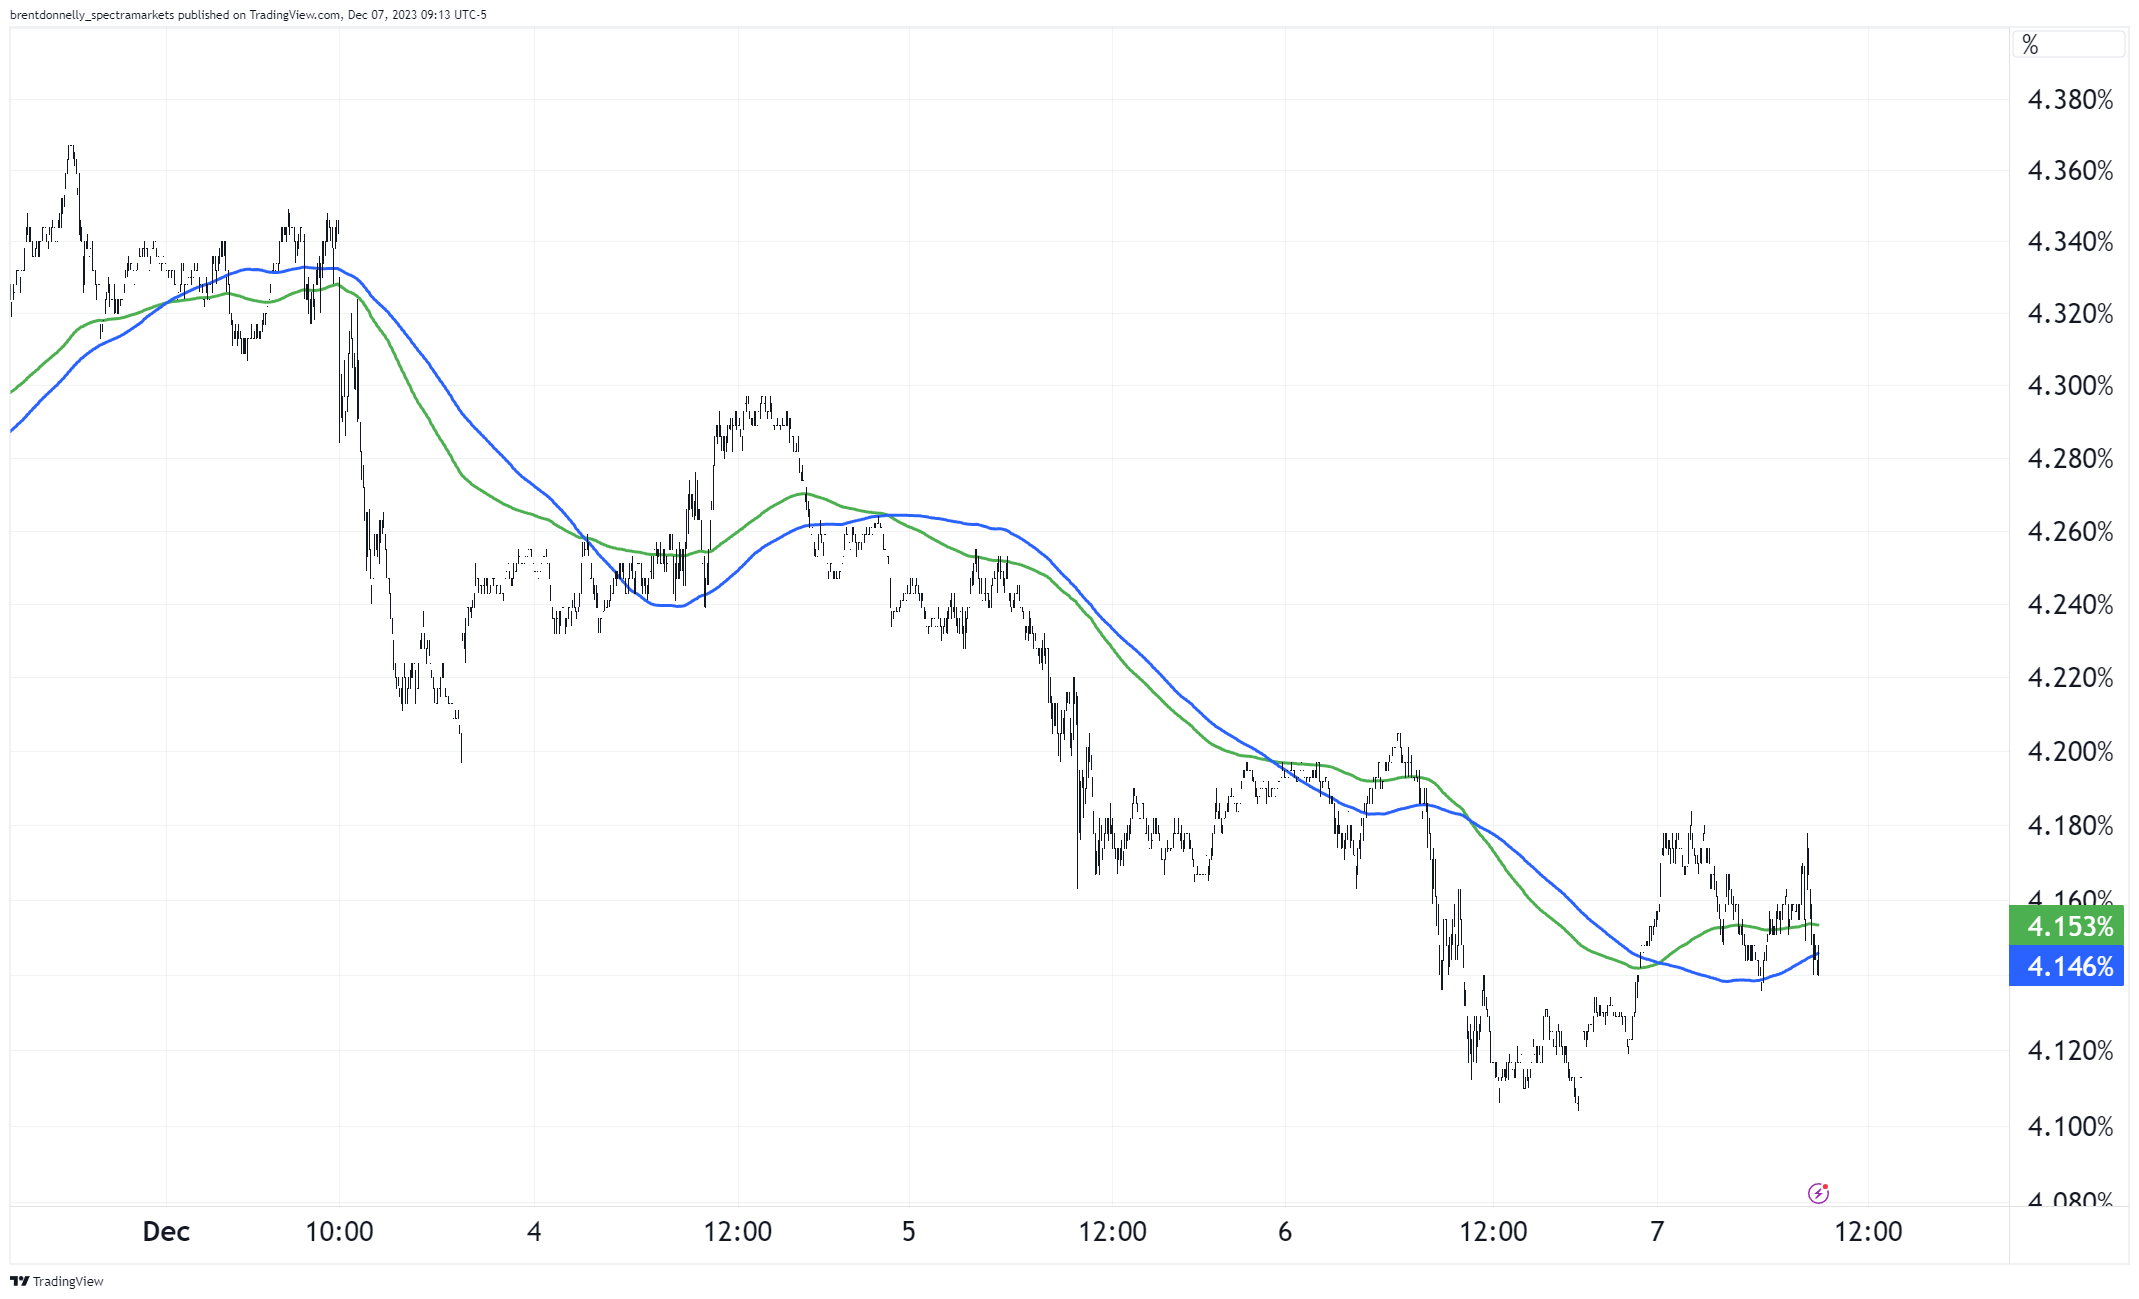
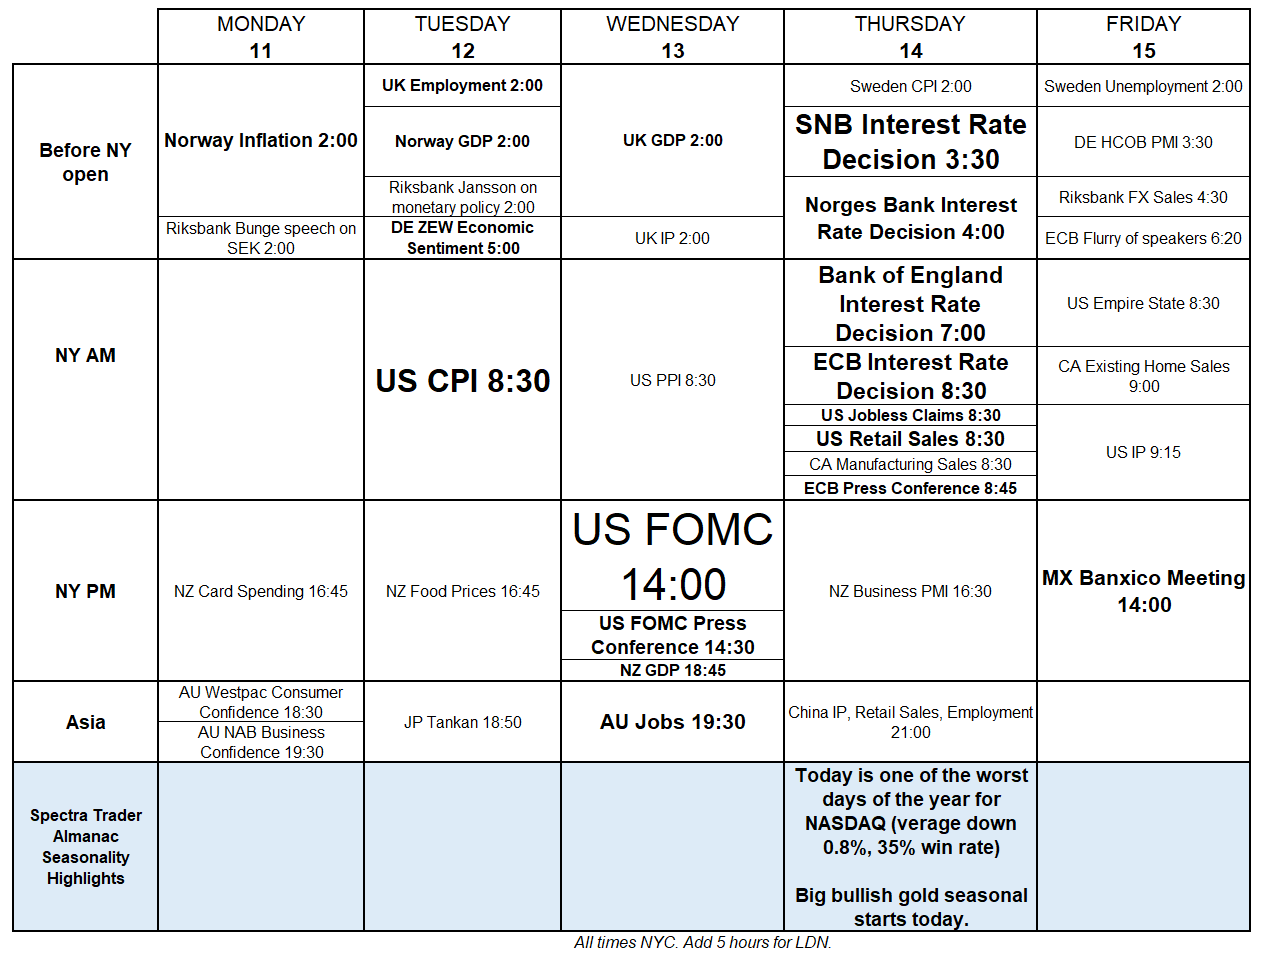
There is some risk of a reversal as this grinding trend has certainly killed off most of the bond shorts by now. Next week is bigtime as we get CPI and FOMC along with a cartload of other events. Here’s a calendar. If you subscribed to am/FX, you’d get this every Friday. Preparation is good.
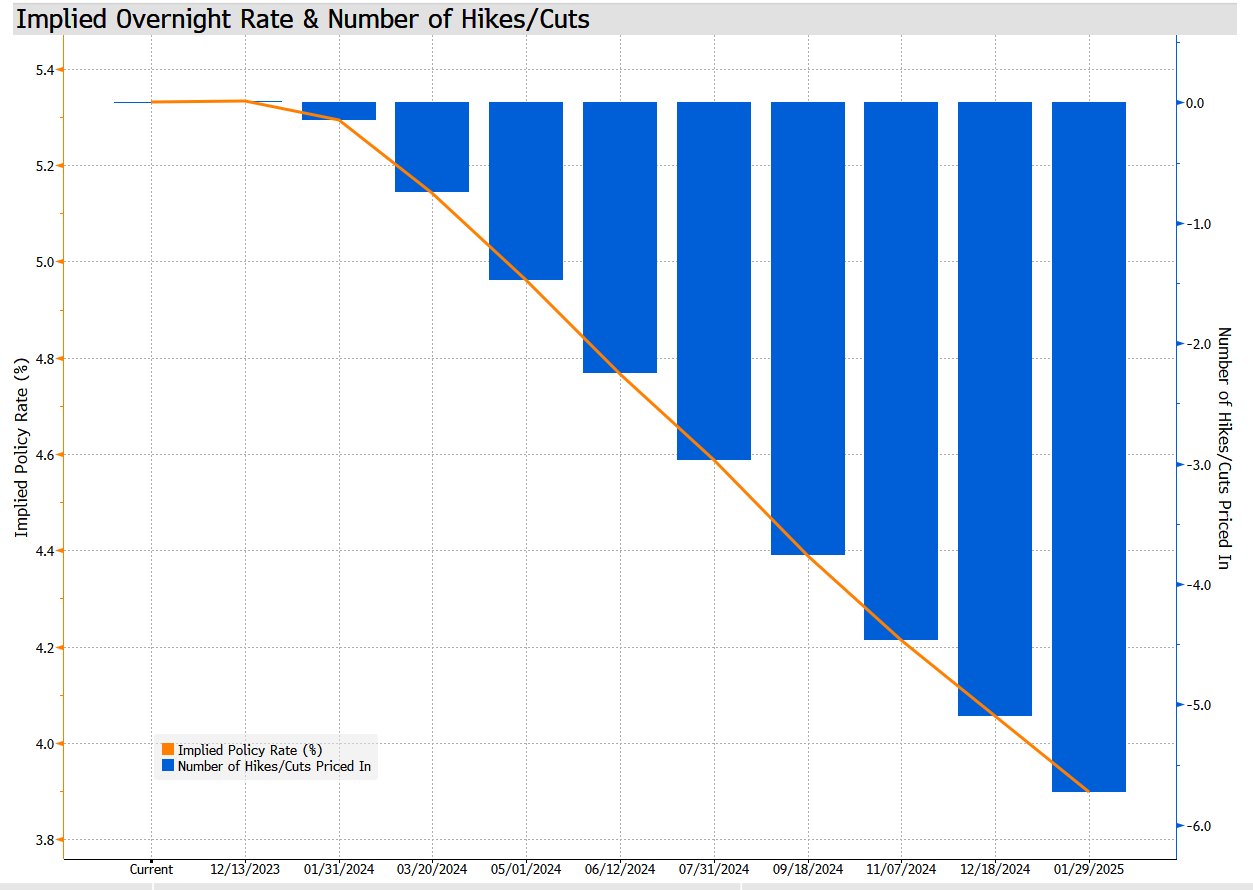
The market loves to play the “too much is priced in game” and played it the whole way up as the Fed hiked way more than expected this cycle. Once a central bank starts moving, they almost always cut or hike more than the market initially expected. Here’s what’s priced in right now. Almost six cuts by January 2025.
Fed pricing out to early 2025
Fiat Currencies
The market went from “I hate the USD and the EUR is the anti-USD so gimme some EURUSD” to “I hate EUR” in less than five days. Whoops.
EURUSD hourly back to late September 2023
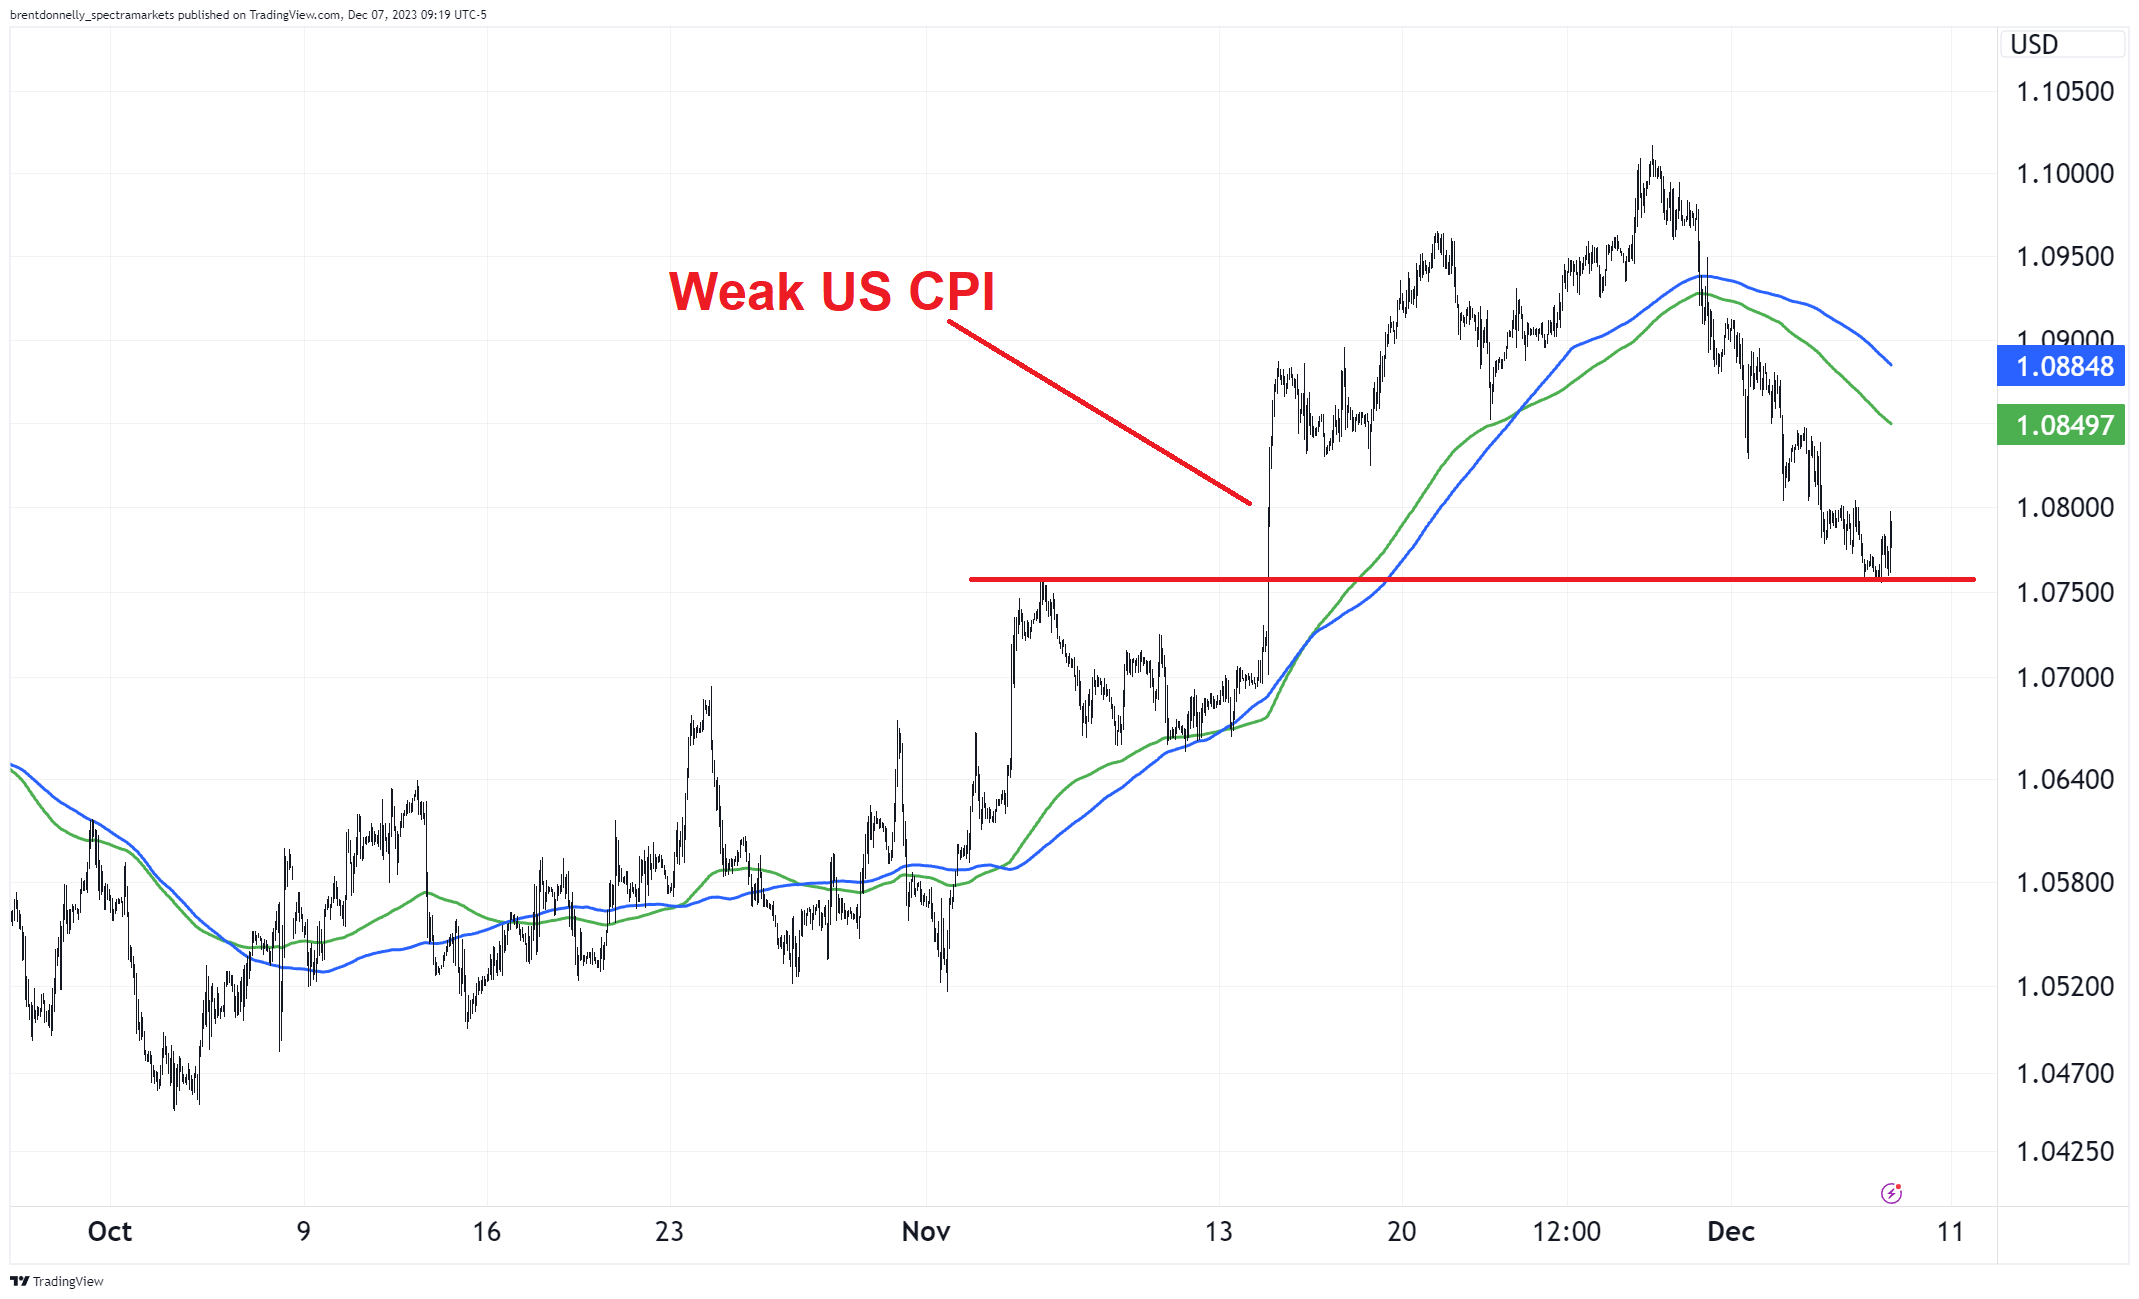
You can see we have done a perfect round trip post-CPI as the old resistance at 1.0750 pre-CPI has been solid support so far. It’s common for old resistance levels to become support once broken. Significant reference points remain in the mind of the market for a while.
Meanwhile, USDJPY is getting roasted on the back of lower global yields and a ratcheting of expectations for some kind of rate hike at the December Bank of Japan meeting. While USDJPY and cross/JPY are almost always all about global yields and the price of oil, BOJ policy factors in at times and this is one of those times. Chart stops Wednesday as it’s from that day’s am/FX.
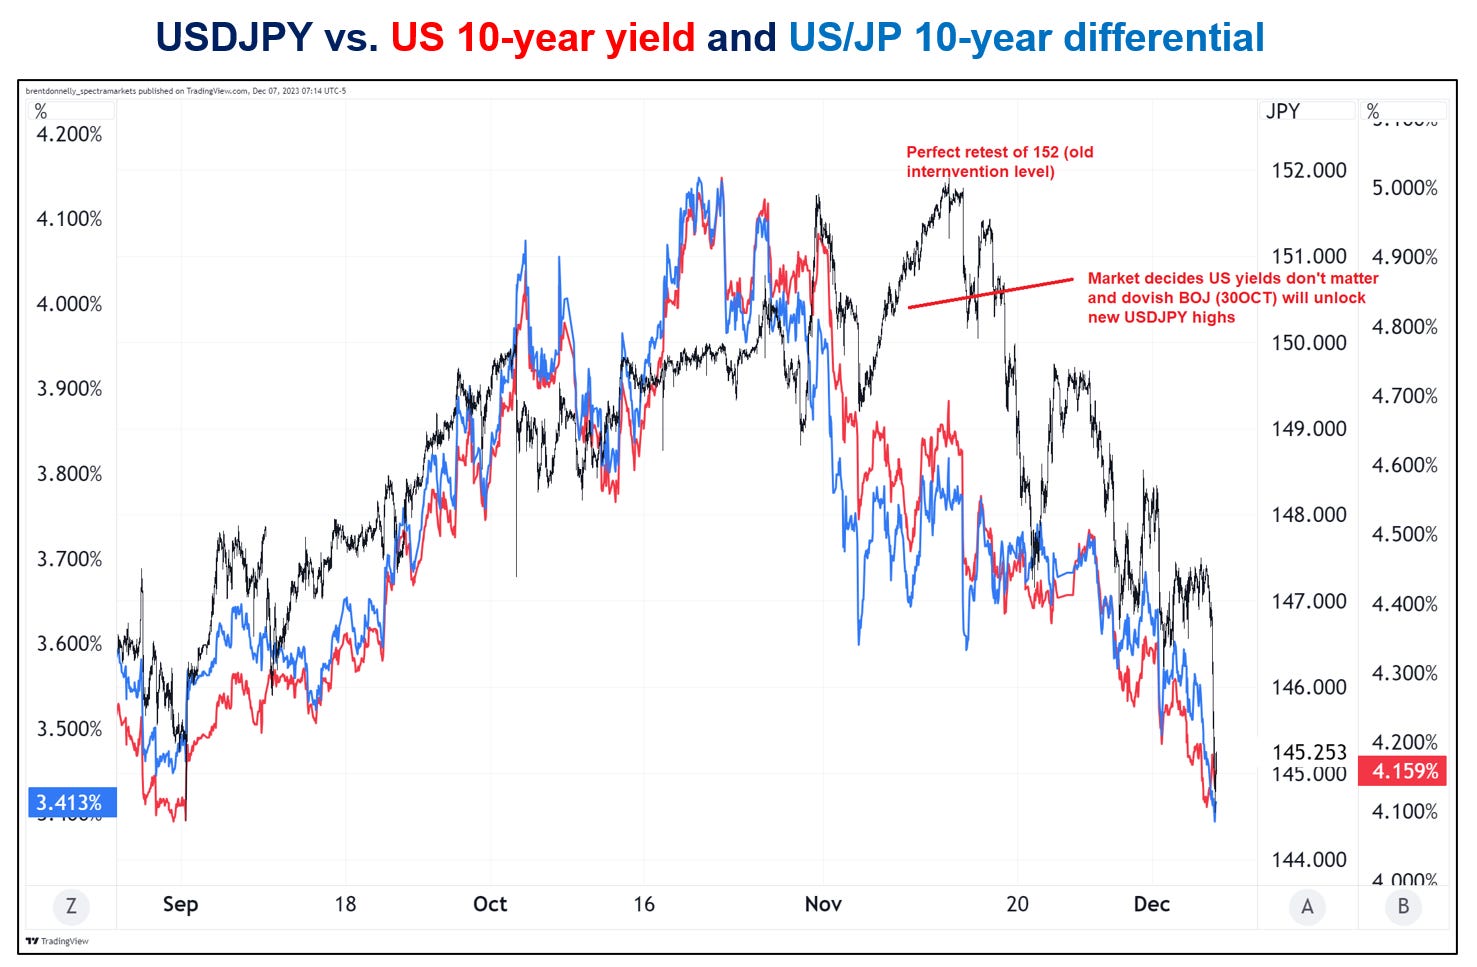
The leads and lags have been tough (as they often are) but you can see yields are still moving with USDJPY. After the 30OCT BOJ meeting, the market briefly decided that US yields don’t matter because VIX is low so vol to carry looks good. This is the old “I’ll ignore the change because the levels are still high” fallacy as markets almost always react to changes and do not maintain directional momentum just because of levels. A company with strong but weakening earnings is more likely to see its stock fall, not rise.
Note that whether you use US 10-year yields or the US/Japan differential, you get the same answer. That’s because US yields dominate the equation.
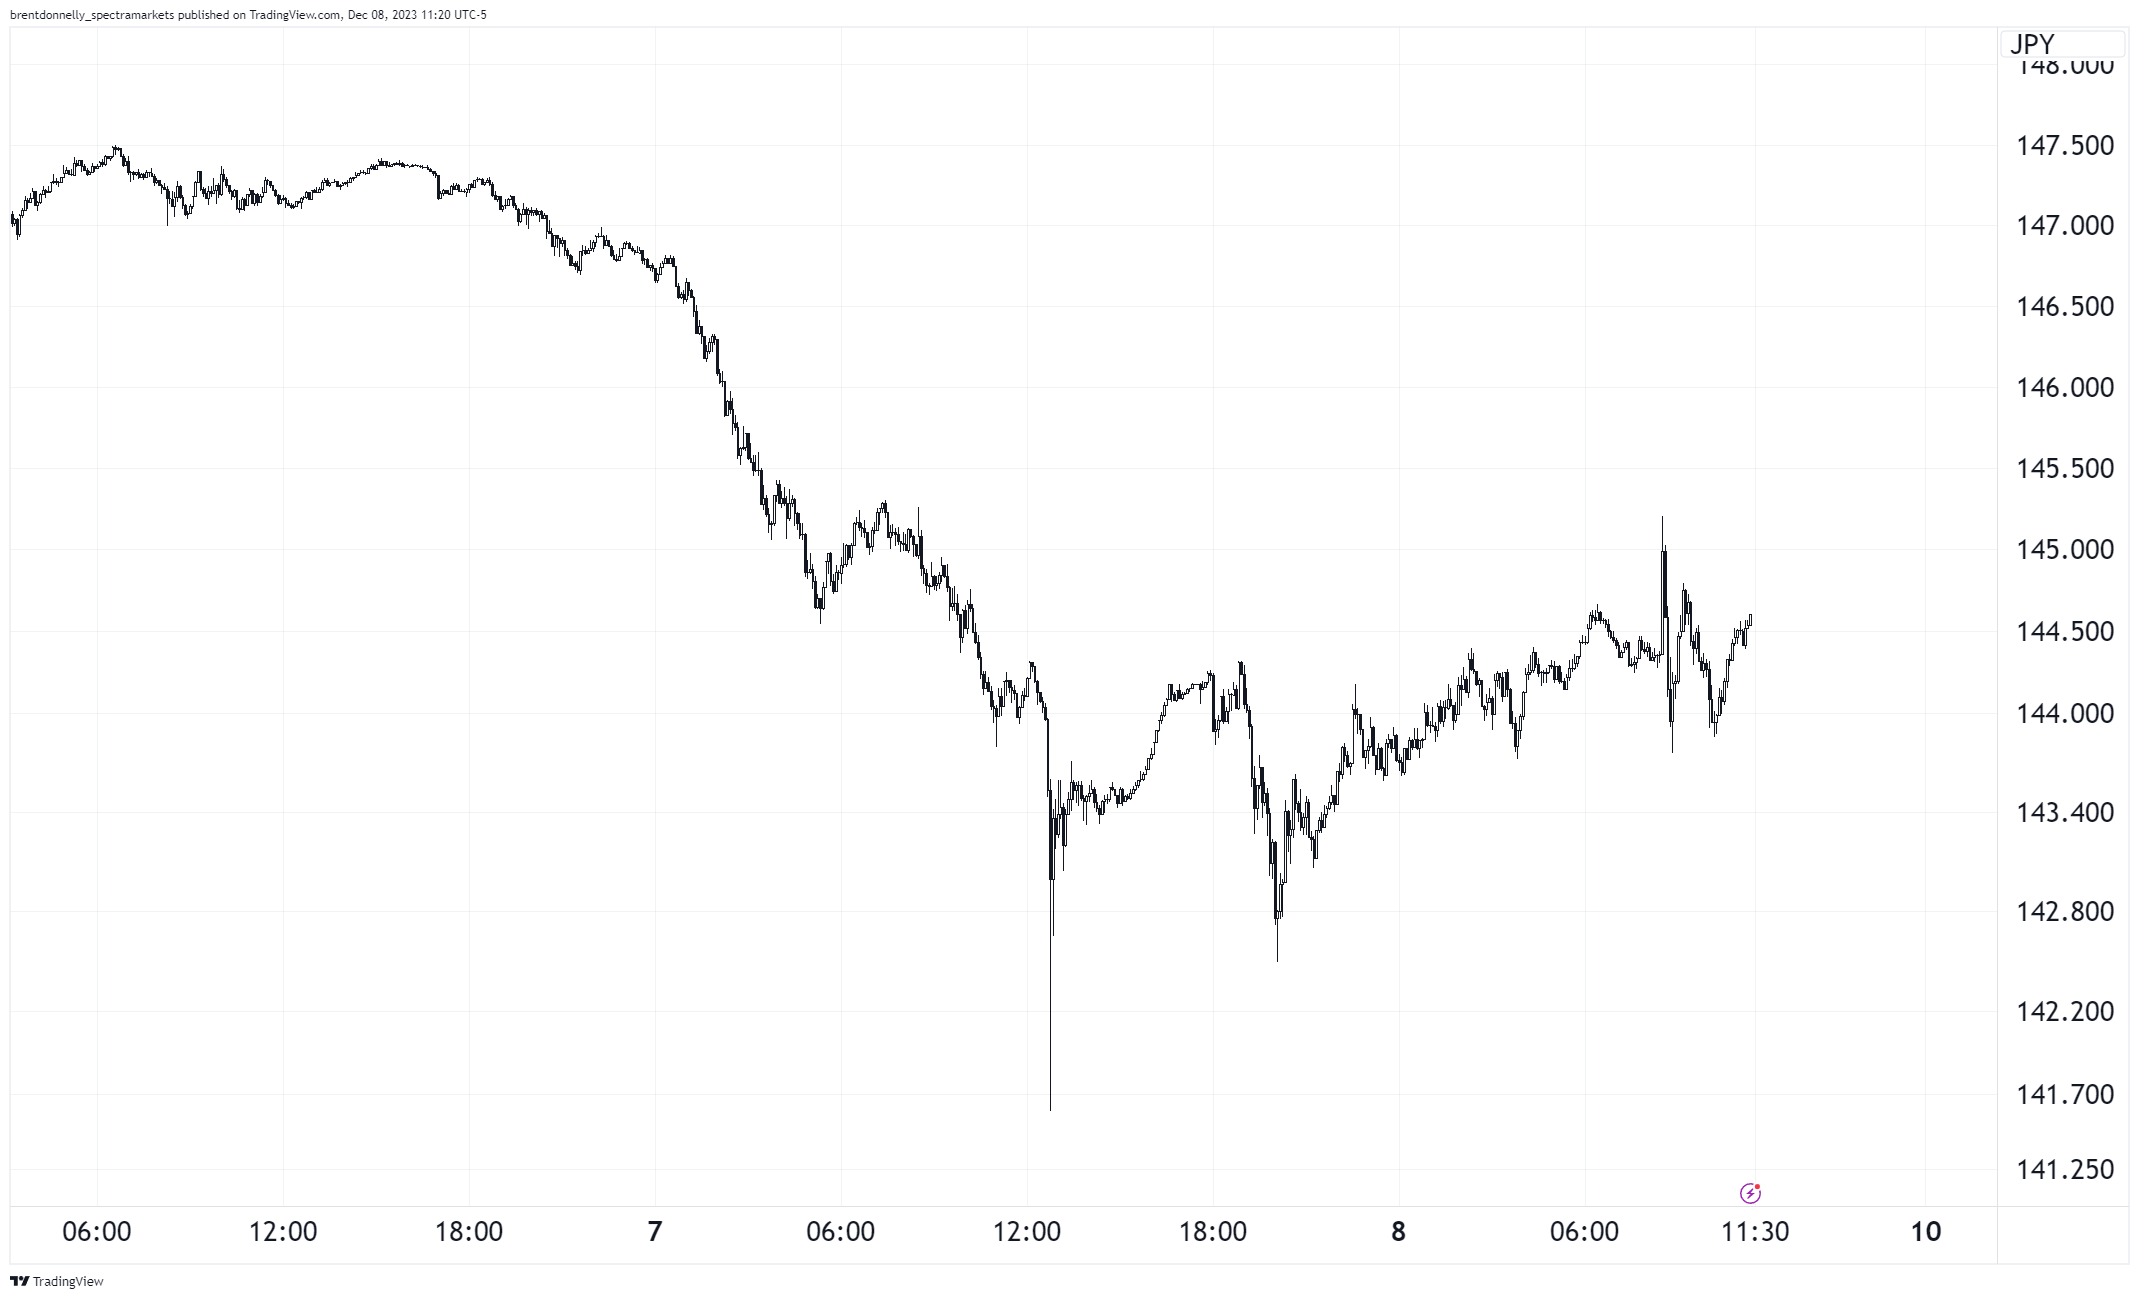
Here’s the 5-minute USDJPY this week. Check out that capitulation flashy thing yesterday!
USDJPY 5-minute chart
Crypto
It’s a mania! Crypto Twitter is alive with the sound of music as altcoins are ripping, BTC and ETH are mega bid and the Catholic Church has announced their intention to follow Michael Saylor and sell bonds to finance bitcoin treasury purchases. The last point is not true.
It’s hard to find crypto traders on Twitter who have some semblance of flexibility because mostly it’s just NGU and rah rah when things are moving up and crickets and the haters loling when things are going down. A notable exception to this is @TheFlowHorse who leans bullish but has a solid understanding of sentiment and behavioral elements and can play long, short, or flat as conditions merit.
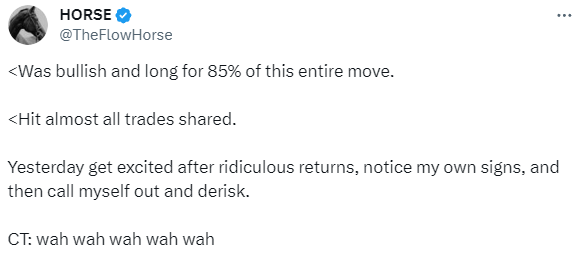
He caught the big move up and went flat and I think that’s interesting as the January 10 ETF approval nears, the game of chicken will become more fraught as the volume of buy the rumor / sell the fact longs might be larger than the volume of available bids between 43k and 36k when the myriad approvals are inevitably announced. Anyway, Horse is a good follow, whether he’s right or wrong on this one.
Given the price action in gold, my cautiously bearish view on NASDAQ, the near-ejaculatory euphoria of Crypto Twitter and the looming January 10 date, I would bet 35k before 51k at this juncture.
Commodities
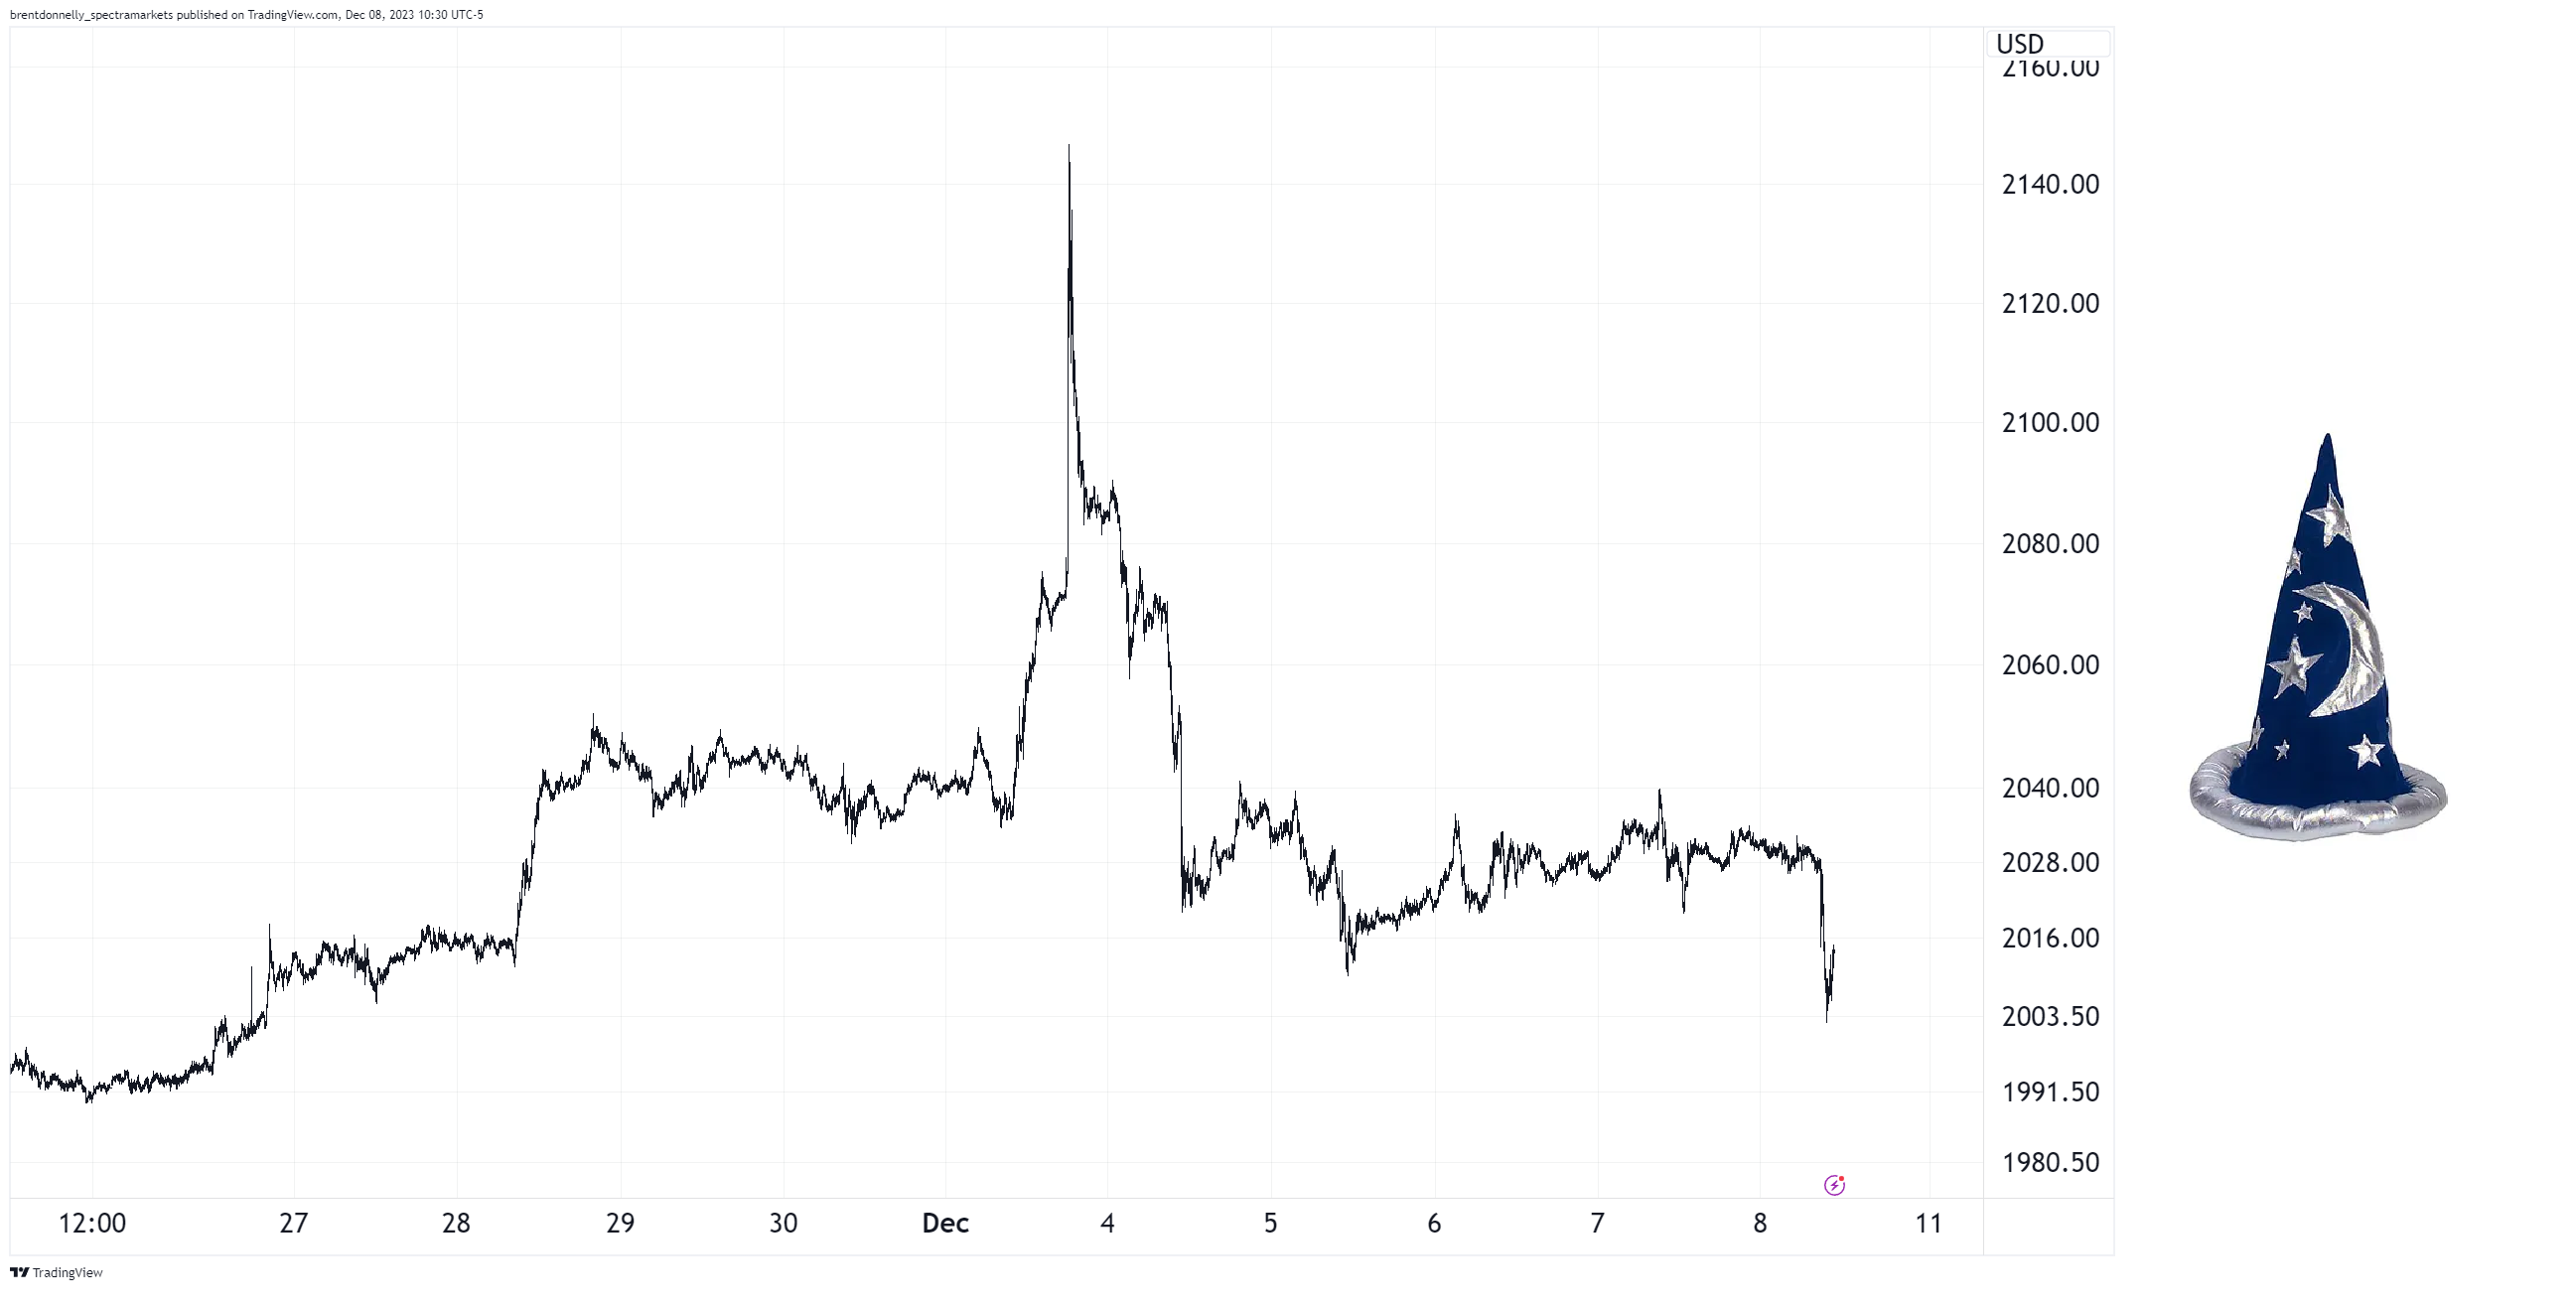
One of the most outrageous gold moves in ages took place this past Sunday. Early Asia is a time for wild moves in low liquidity and very often ultimate tops and bottoms are set in that window because the dearth of liquidity allows the market to gap until it finds a strong hand. In this case, the strong hands were at 2140 in gold. Recall oil did the same thing after Russia went into Ukraine and the Sunday night high of $130 was never touched again.
There’s a whole section on Sunday gaps in my book The Art of Currency Trading because they are an important pattern that has a strong logic and even if people know about it, it’s really, really hard to trade so it keeps on working.
I was bullish for a few weeks going into this blowoff but I am not bullish anymore. This is the stuff major highs are made of and it incorporates three of my favorite patterns in one. Volume spike on blowoff price, Slingshot Reversal, and Sunday Gap and Trap.
Gold 5-minute chart looks like a wizard hat
Oil is slow-mo collapsing as the market’s relentless infatuation with higher oil continues to cost. Every time some new shiny story appears, the market piles back into oil but now we have had two wars and Saudi price pump attempts and SPR refill action and OPEC cuts and we’re at the lows. It’s time to use your imagination. Could oil go below $50? Sure, it could. It’s one of the craziest good news / bad price big-picture setups I have ever seen.
OK! That was 6 minutes. Please share this newsletter with any aspiring finance professionals that you know! Thanks!
Get rich or have fun trying.
Links of the week
Interesting / smart
Why do investors play low probability games?
Broadly applicable concepts
14 Amazon Leadership Principles
GTA VI FTW
Music from Gitts
“It’s 15 minutes altogether. Worth it.”
https://youtu.be/82T1trAQS-E
