
The soft landing continues. Core PCE is low, stocks are at the ATH, and both nominal and real growth are strong. Good news is good news.

Here’s what you need to know about markets and macro this week
Global Macro
The soft landing continues. Core PCE, the Fed’s preferred measure of inflation, is running below 2% annualized over the past six months, stocks are at the ATH, and both nominal and real growth are strong. This week we got a smorgasbord of data and the key releases were strong GDP, strong ISM, strong home sales, and soft inflation. Again, you need to dig pretty deep into arcane data or slice and dice the headlines with a Ginsu to tease out anything negative.
Good news is good news.
The defining feature of this economic moment is that the polycrisis, Covid PTSD, political polarization, failure to heal from the 2021/2022 inflation pain, and depression from social media and smartphone addiction mean the “how it feels” is totally disconnected from “how it actually is”. So economists pursue niche third-tier indicators to reverse engineer an explanation for perceived weakness instead of following the first-tier workhorse economic data that pretty much all shows the economy on cruise control.
Nothing lasts forever, of course, and one day the inverted yield curve will correctly call the “inevitable” recession. Because recessions happen sometimes. But as was the case in 2005/2007, the inverted yield curve is costing investors billions of dollars and creating a ton of fear about a future event whose existence is certain but whose timing is unknowable.
Economists’ preferred inversion indicator (3-month vs. 10-year yields) inverted in November 2022. Since then, the S&P 500 is up 28%, NASDAQ is up 53%, and US 10-year yields are 40bps higher. There is no way you could have made money trading the inverted yield curve but there are about 37 ways you could have lost money. You need much more than an inverted yield curve before you can rationally or profitably position for a recession.
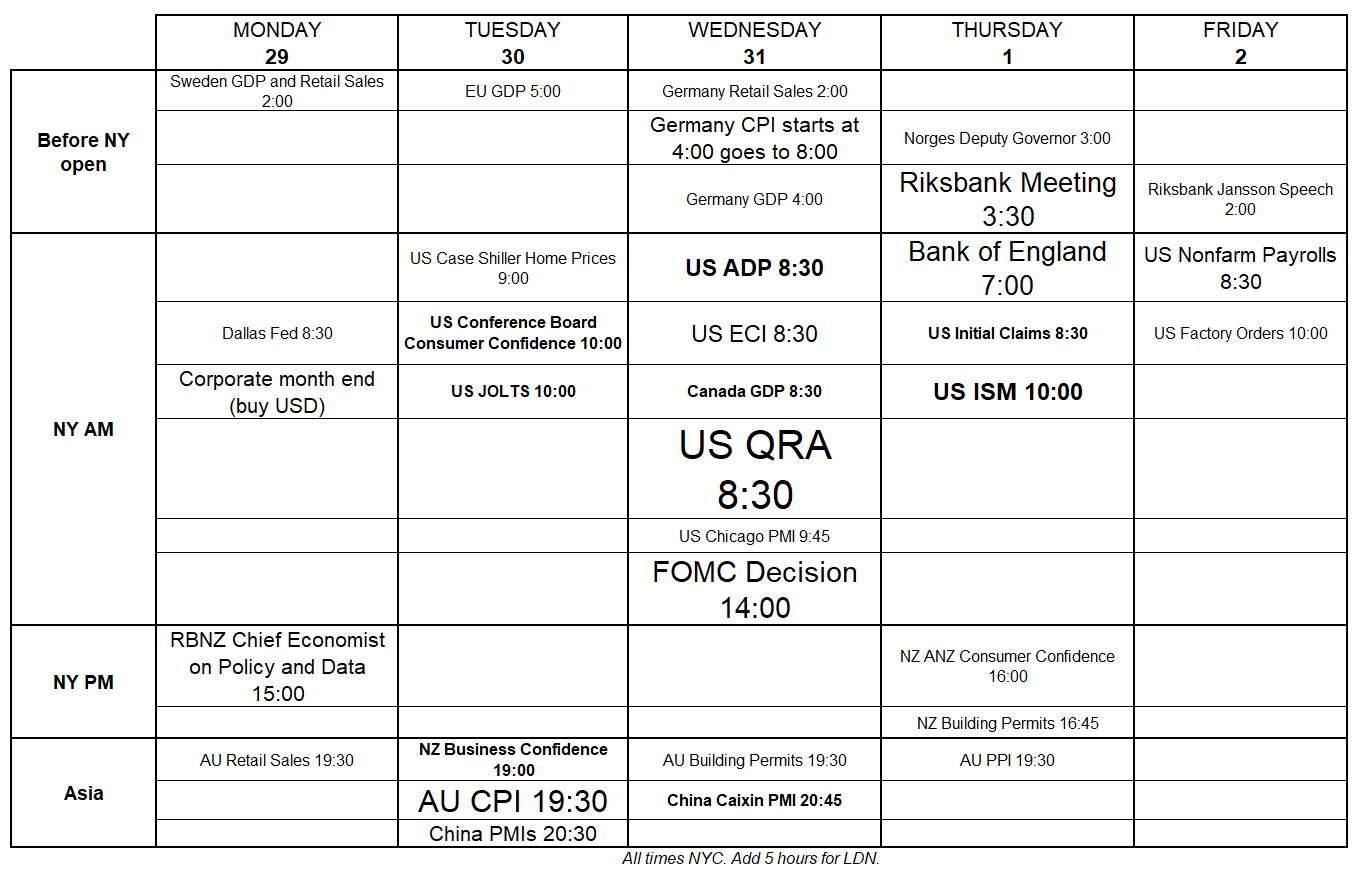
If last week was a smorgasbord of data, this week is an all-you-can-eat buffet. Here’s the complete calendar, courtesy of the nice folks at am/FX.
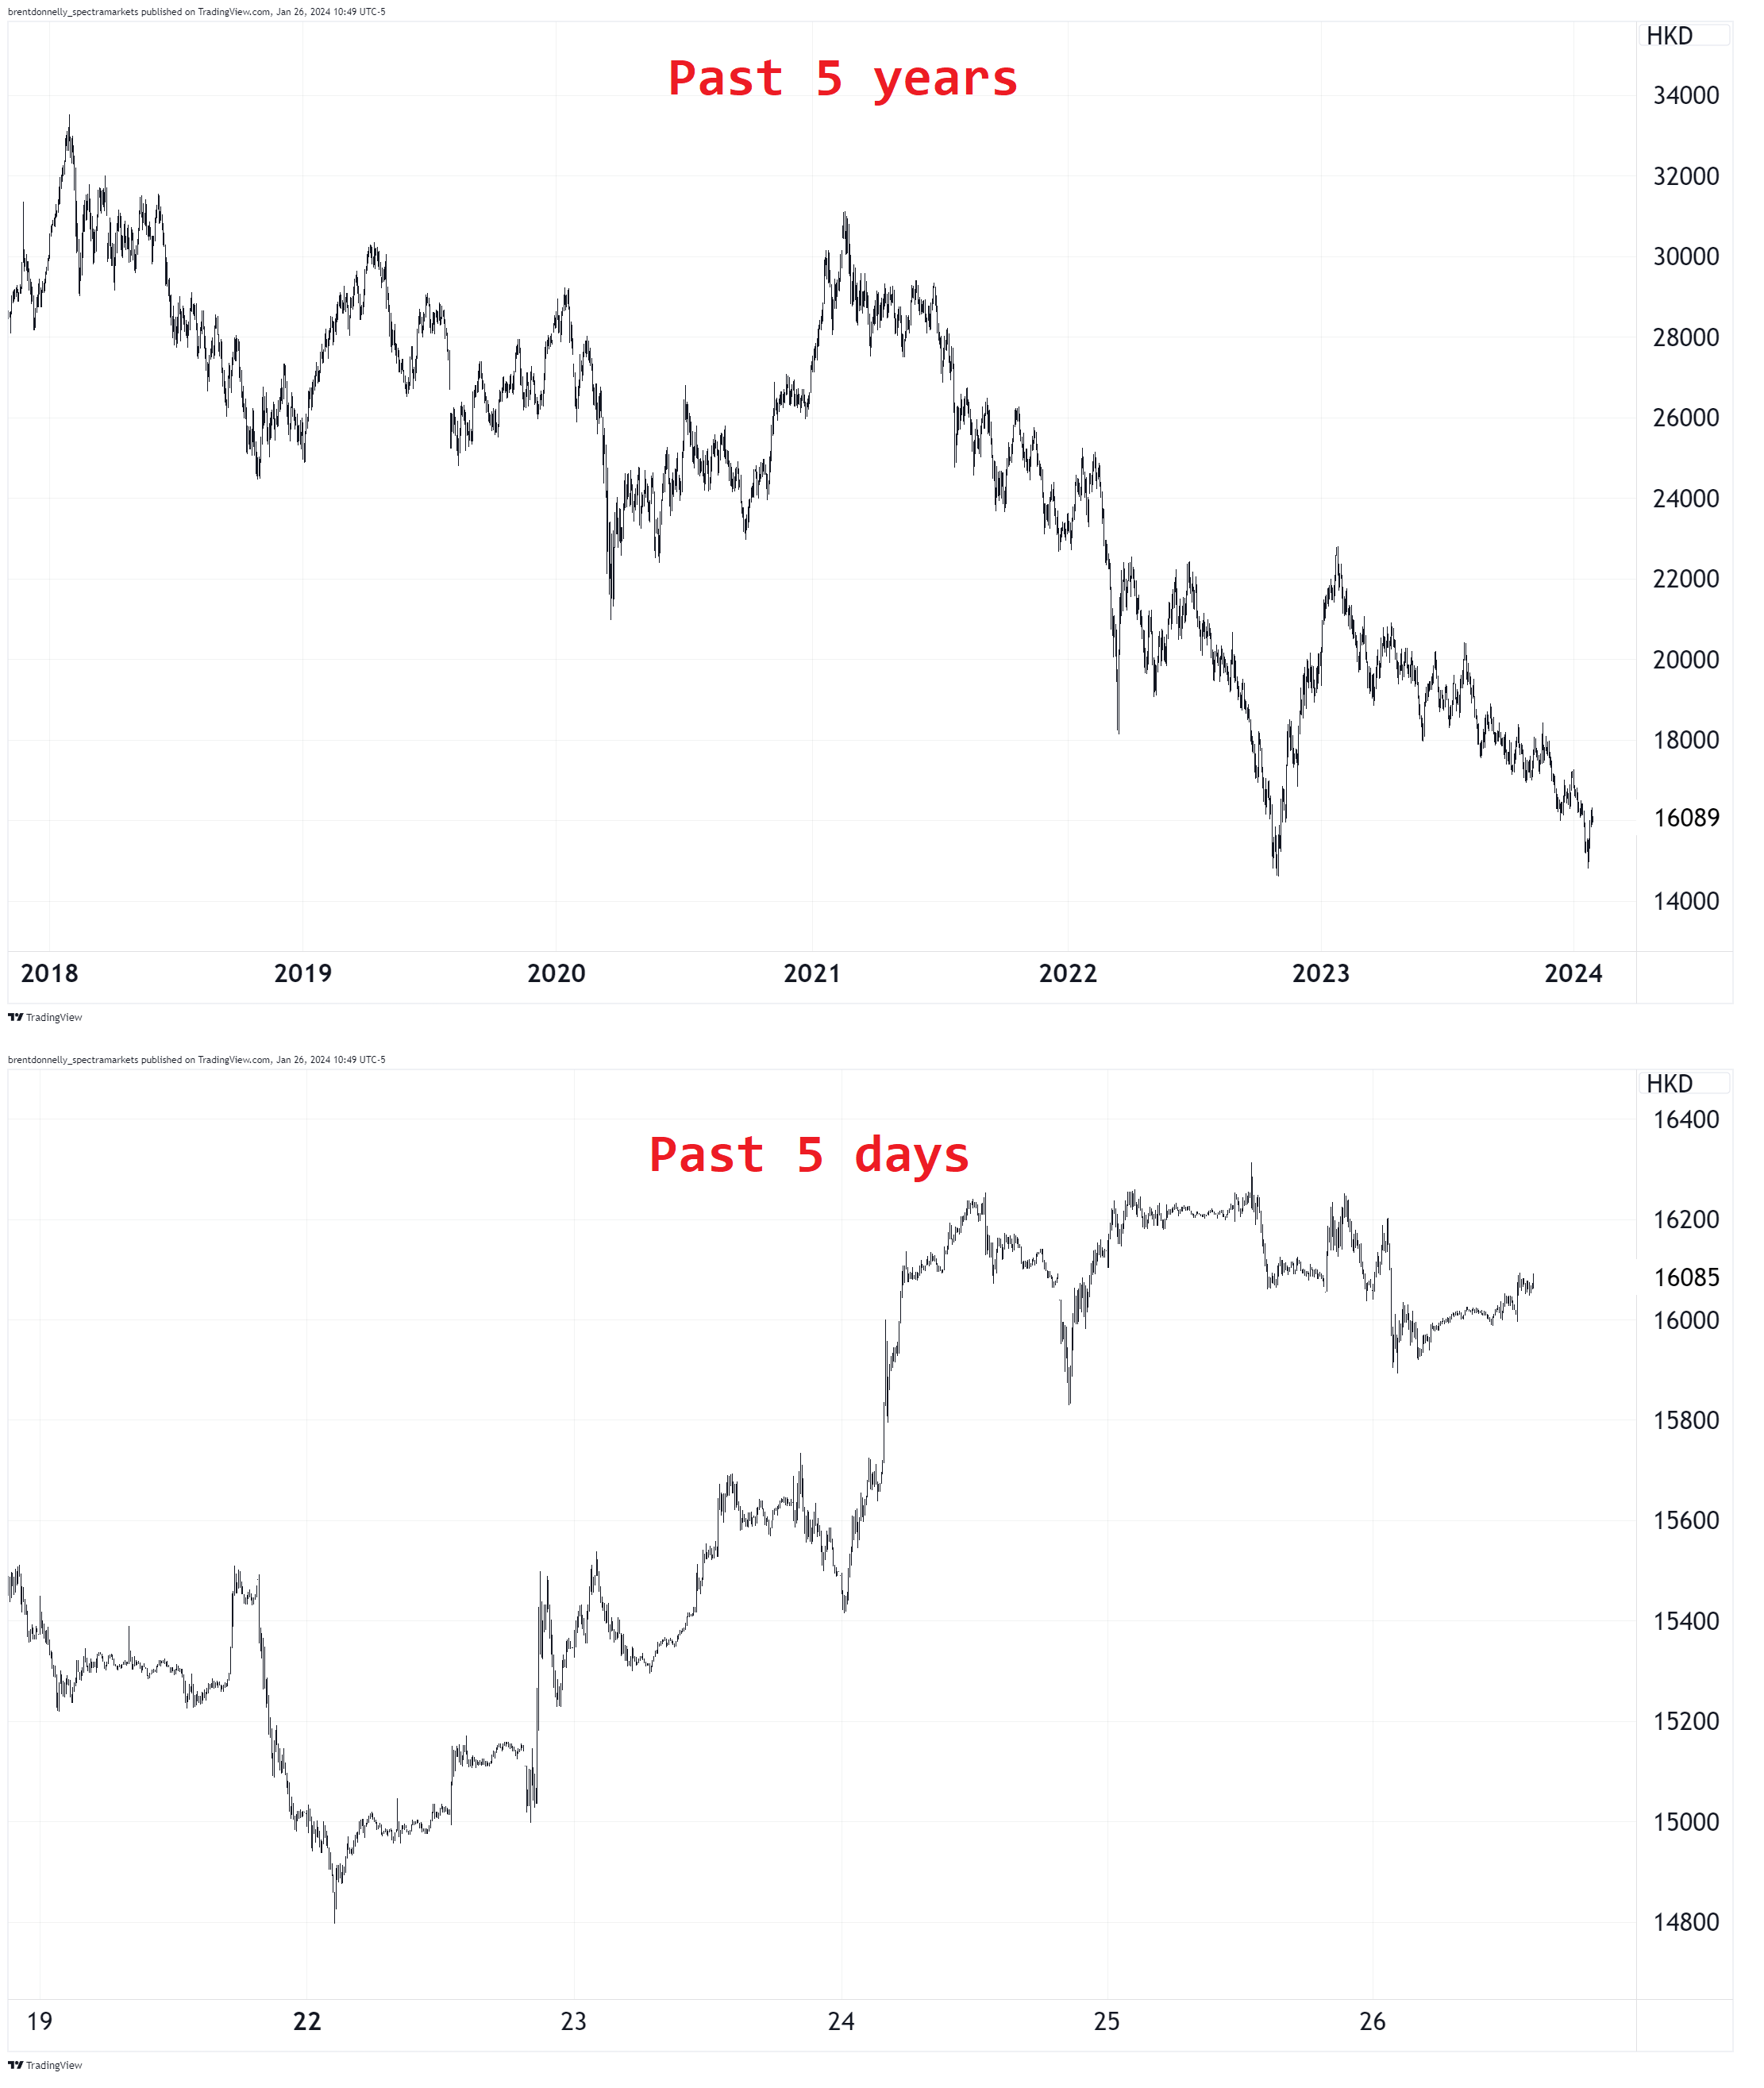
Last week I highlighted the disastrous Hang Seng chart and then this week authorities in China announced a big series of measures to try to stabilize things. Depending on your level of zoom, it looks like a huge rally or a tiny bounce.
Hang Seng Index Futures, served two ways
There is a mix of skepticism and hope now with regard to Chinese assets. While copper has spiked in response to the possible confidence boost, currencies like AUD and NZD, which are often China proxies, are stuck in the muck like feral pigs.
AUDUSD 1-hour chart after China rescue package and RRR rate cut

Interesting note: High-profile forced liquidations are a hallmark of important tops and bottoms and we got one in China this week.
Here’s an example of another liquidation. This one at the tippy top in tech in 2021:
Markets are brutal.
February 10 is Chinese New Year, and historically there tends to be some appreciation in Chinese assets going into that important holiday as most of the markets there are controlled by the government (at the margin). For example, here’s the performance of USDCNH (US dollar vs. China offshore yuan) on average into and after Chinese New Year. The line on the chart going down means lower USD and stronger yuan.
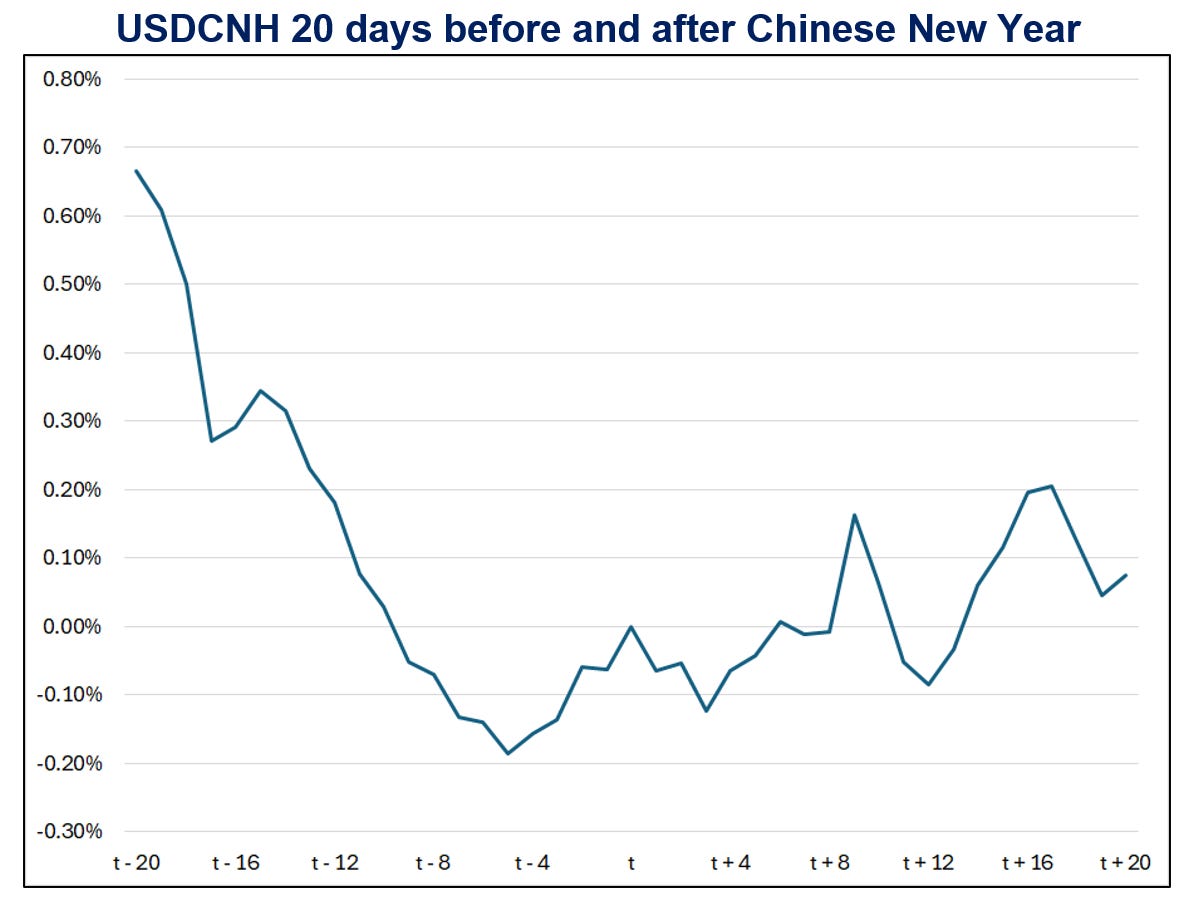
1% might not seem like much, but it is. The currency is tightly managed against the dollar and therefore a 1% average move over 20 days is a super strong result for a study like this. As you can see the stabilization effort happens in advance of the New Year (presumably to establish confidence and encourage consumer spending and travel) and dissipates thereafter.
Stocks
All the stocks went up this week, except Tesla*. As the EV and ESG narratives have turned and common knowledge seems to be that hybrids are better than pure electric vehicles, the gargantuan market cap assigned to TSLA looks like it needs to come down. While acolytes view TSLA as a tech company, not a car company, this might have been true when it had 20% margins but is almost certainly not true as it now has 8.3% operating margins. The price cuts might help delivery volumes but sales growth is done and margins are contracting.
*false, exaggeration
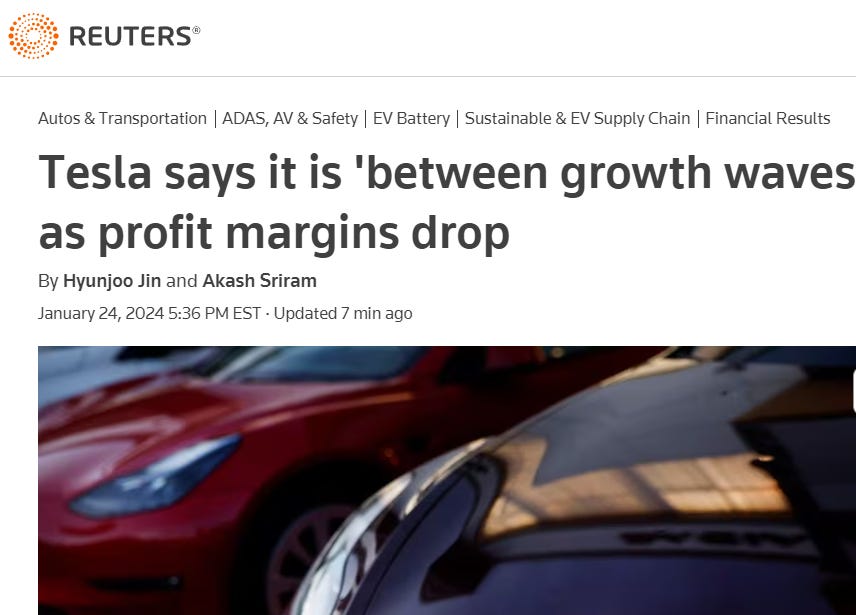
This “between growth waves” spin from Tesla is like when you’re unemployed and you say “I’m between jobs.”
Reminder:
Tesla market cap 600B
Porsche market cap 75B
Mercedes market cap 70B
BMW market cap 65B
Tesla operating margin was 8.2% in Q4 2023 vs. Mercedes at 13.4% and BMW 17.6%. If the market decides Tesla is just another car company and the EV narrative is past its sell-by date… No price target is too low.
This is not investment advice!
And for the record, I’m not a permabear on Tesla. Here’s proof:
Anyway. Tesla is returning to earth while the NASDAQ is doing this:
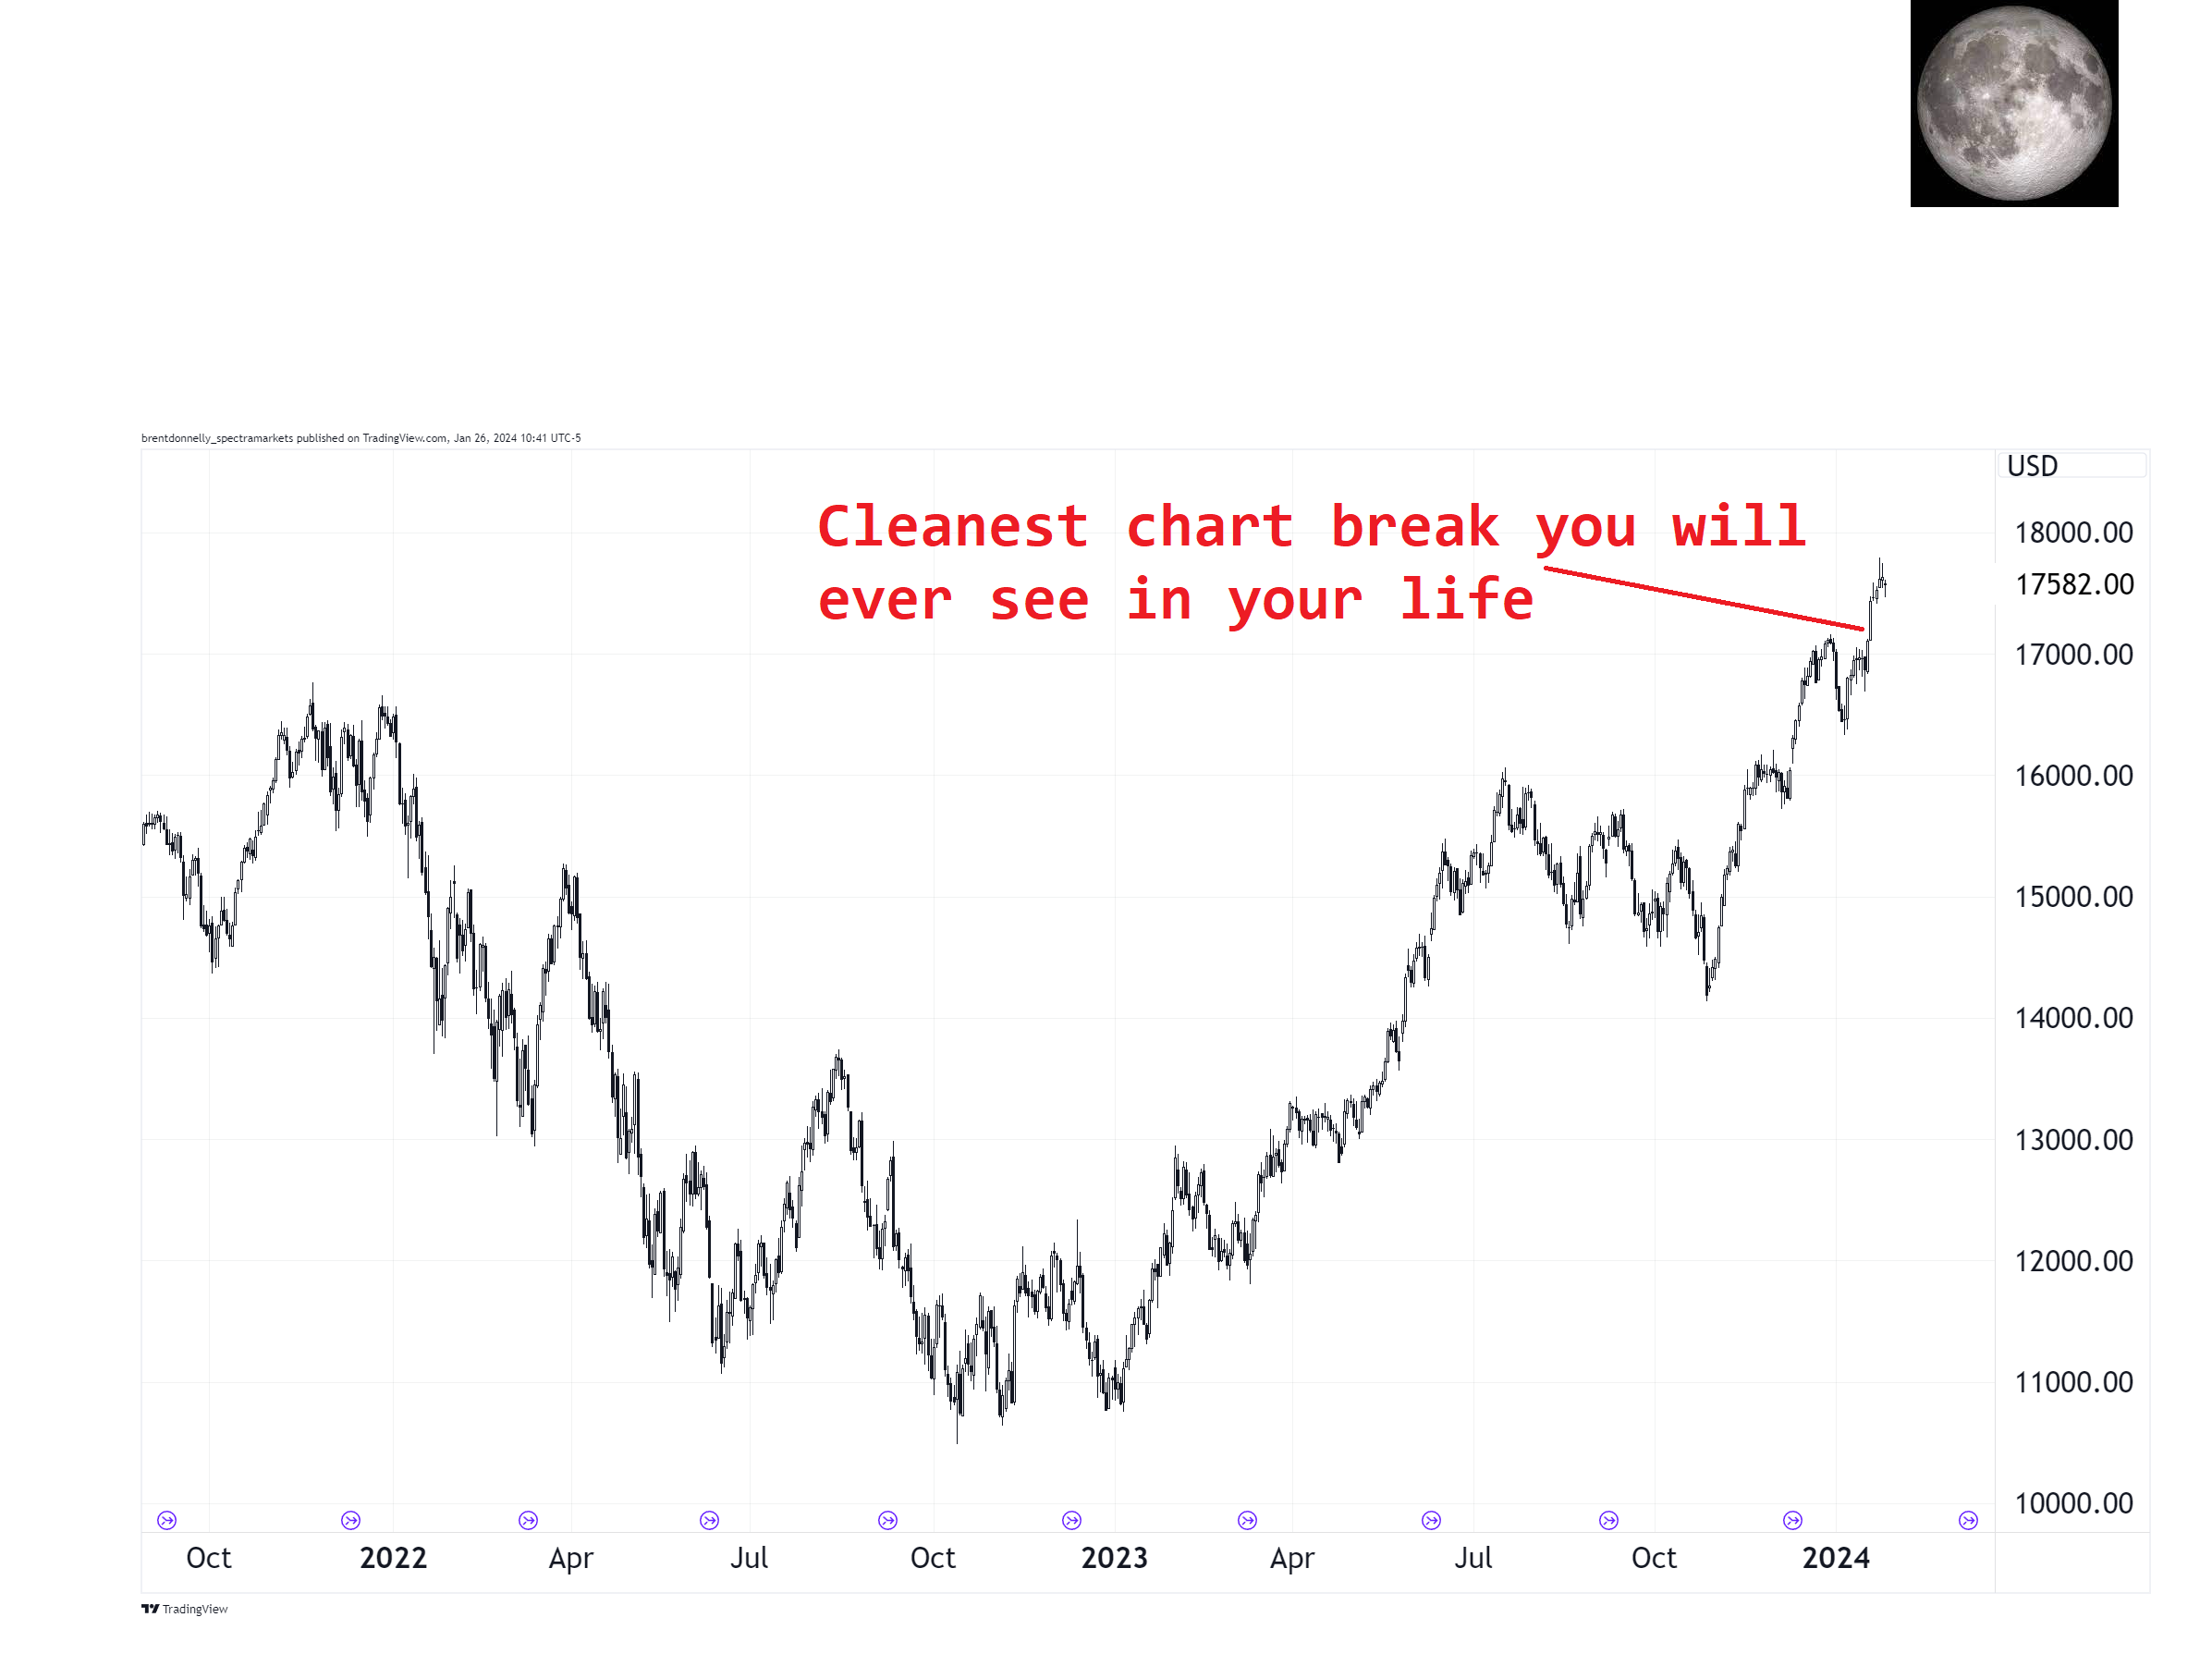
It’s hard to know what to do when stocks are moving like this because it feels a tad bubbly and yet bubbly can stay bubbly longer than shorts can stay solvent. And tech bull markets always feel kinda bubbly due to our shared experiences of 2000 and 2021. But if you wanted some evidence that we are in a moment of ebullience:
https://x.com/donnelly_brent/status/1750894150042419331?s=20
Anyway, I’m agnostic on stocks for now. Bulls on parade. Here is this week’s 14-word stock market summary:
Bull market, dude. Five thousand SPX is a magnet. Price/sales: Avert your eyes.
Interest Rates
Yields are in a holding pattern ahead of next week’s barn-burning economic event schedule as the 2023 year-end overshoot has been remedied and now you have a bunch of crosswinds as inflation falls and growth remains robust. The Quarterly Refunding Announcement this week is seen as a headline event, but the more I think about it, the more I believe Yellen will avoid rocking the boat in either direction.
As you can see in this chart, the March cut is a coin toss.
% chance of a 25bp cut priced in for the March FOMC meeting (-100 = 1 25bp cut)
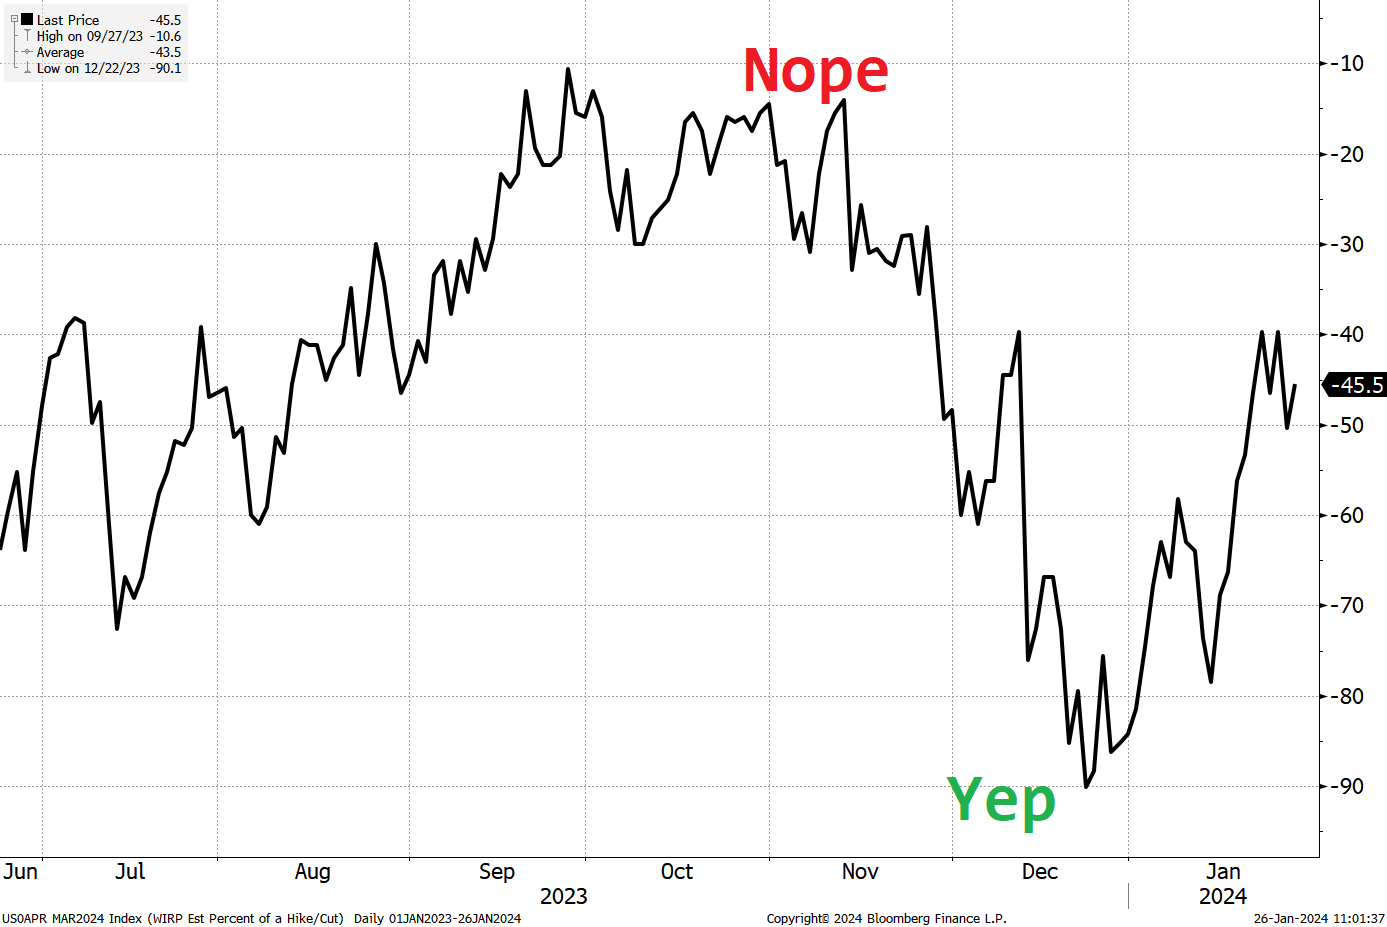
This graphic reminds me of the Sesame Street aliens. Yep yep yep yep yep.
Fiat Currencies
The US dollar is an all weather currency as the many Fed cuts priced into the strip are having no impact on FX because cuts are priced in basically everywhere. FX relies on interest rate divergence to create volatility and most global yields are bobbing up and down in synch.
Here is EURUSD vs. the 10-year Germany/USA rate differential, for example.
EURUSD vs. DE/US 10-year spread (hourly back to summer 2023)
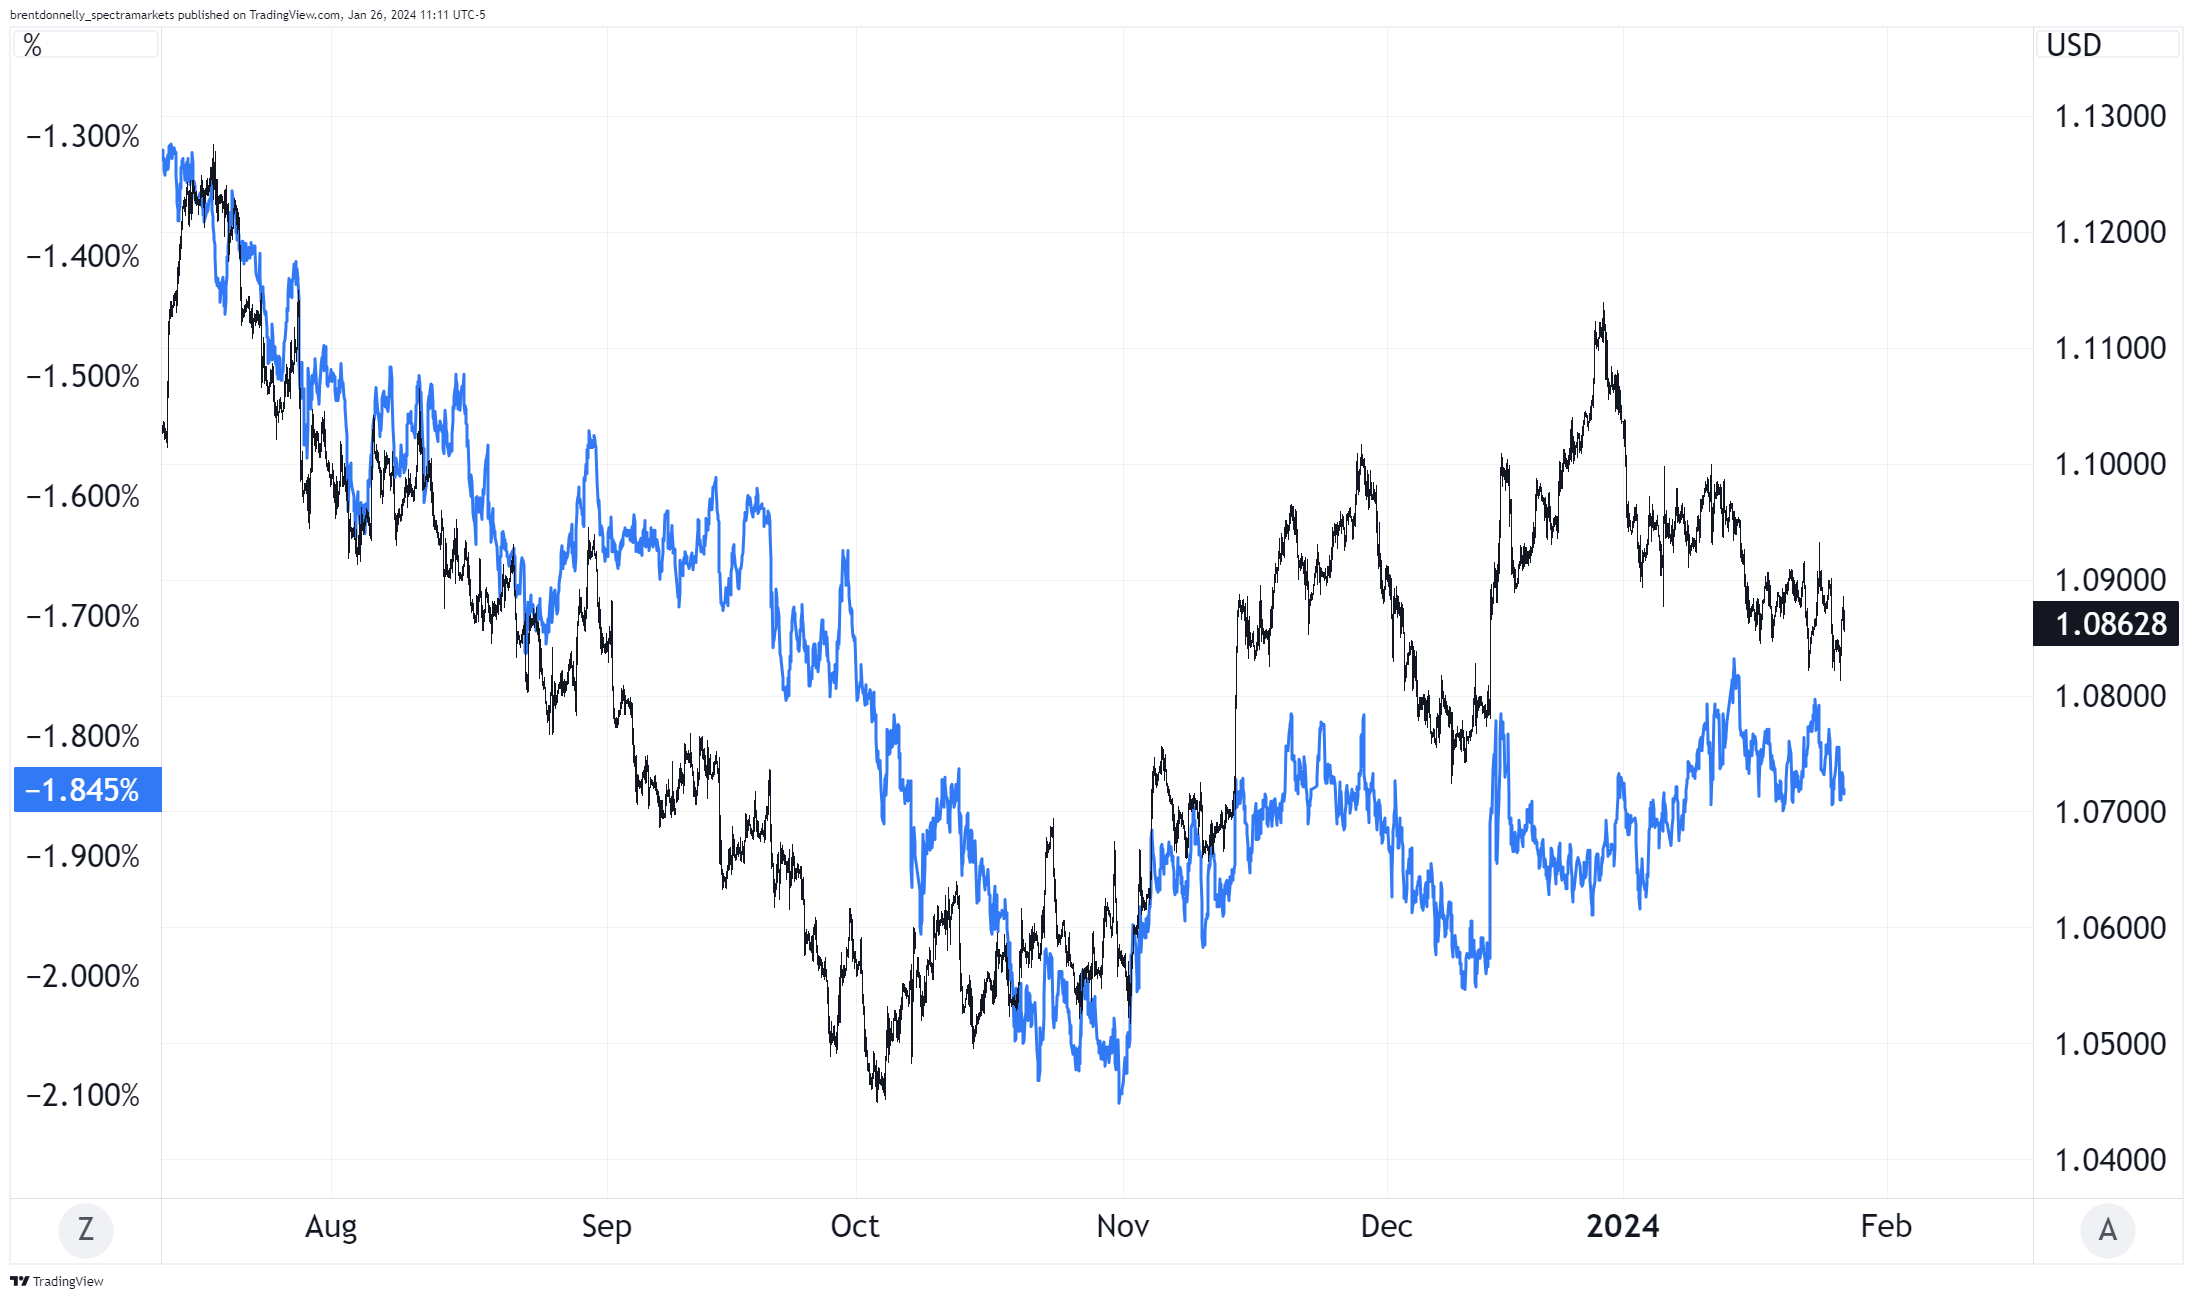
You can see that as US yields trended higher faster than German yields last year, EURUSD went down. The Germany/US spread got to 2% or so. Then Janet Yellen released the hounds and US yields dropped a bit, but not much faster than Germany’s. Stability in the rate spread has led to a range trade in the currency as we have been bounded by 1.08/1.1125 for three months now.
USDJPY looks like it’s ready to make new cycle highs now (not investment advice, my views are subject to change). Reasons:
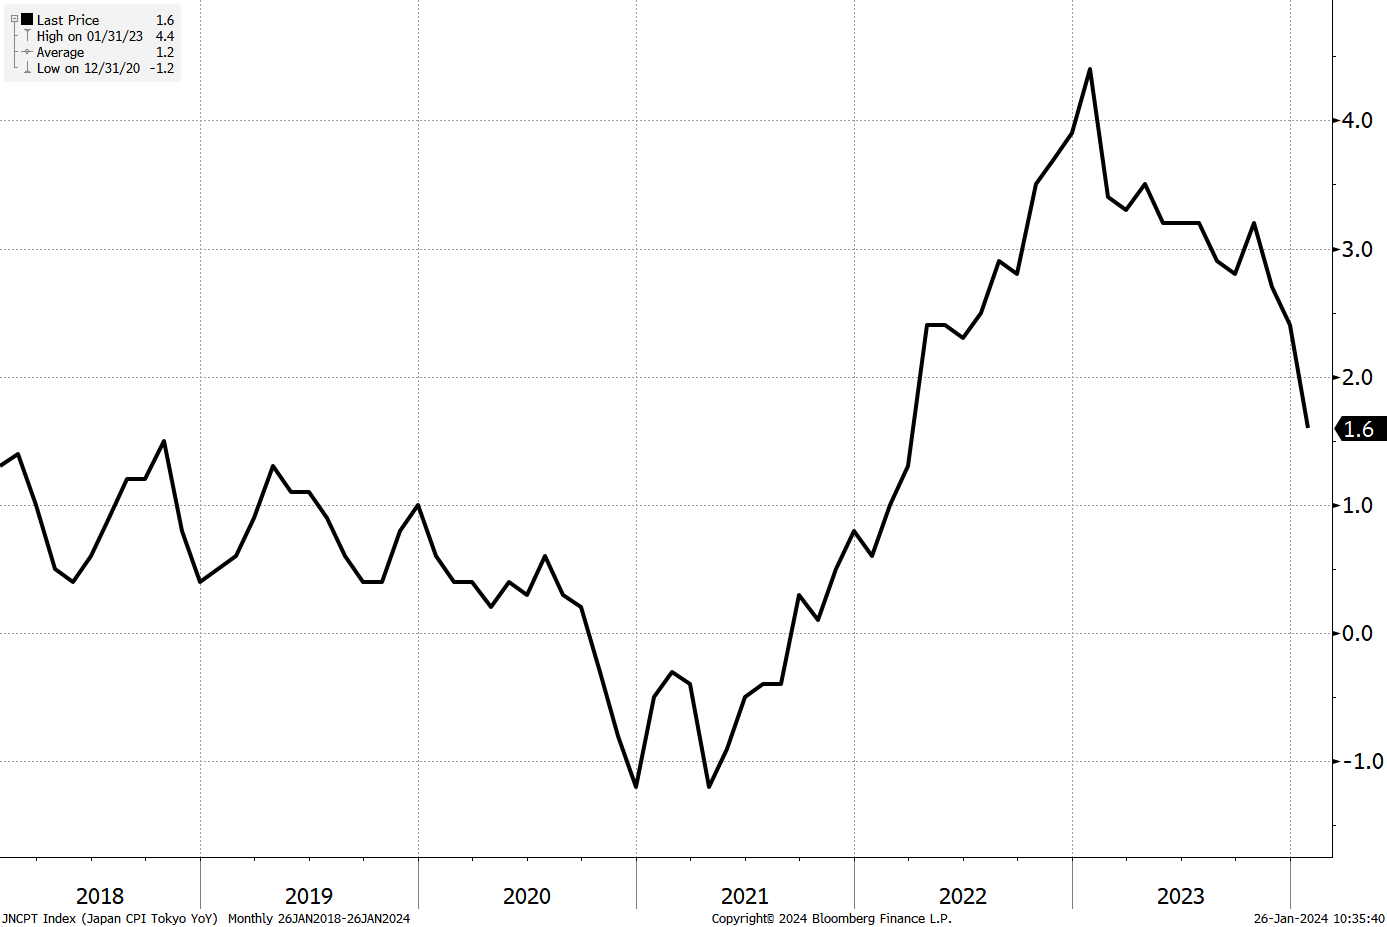
Japan CPI rolling over. The BOJ missed their chance to hike rates and start normalizing.
Tokyo CPI, YoY, 2018 to now
Flows into month end are likely to see significant USDJPY buying. This is too micro to write about in Friday Speedrun, but flows matter. The MOF is unlikely to care too much about USDJPY at least until we see 152 and I think the massive list of events next week and the flow profile lean towards a retest of that level soon.
Finally, AUD is supposed to rally when there is good news in China. Here’s what it has done. The chart shows AUD vs. copper because copper is a China growth proxy.
AUDUSD in black vs. Copper futures in red (Hourly back to November 2023)
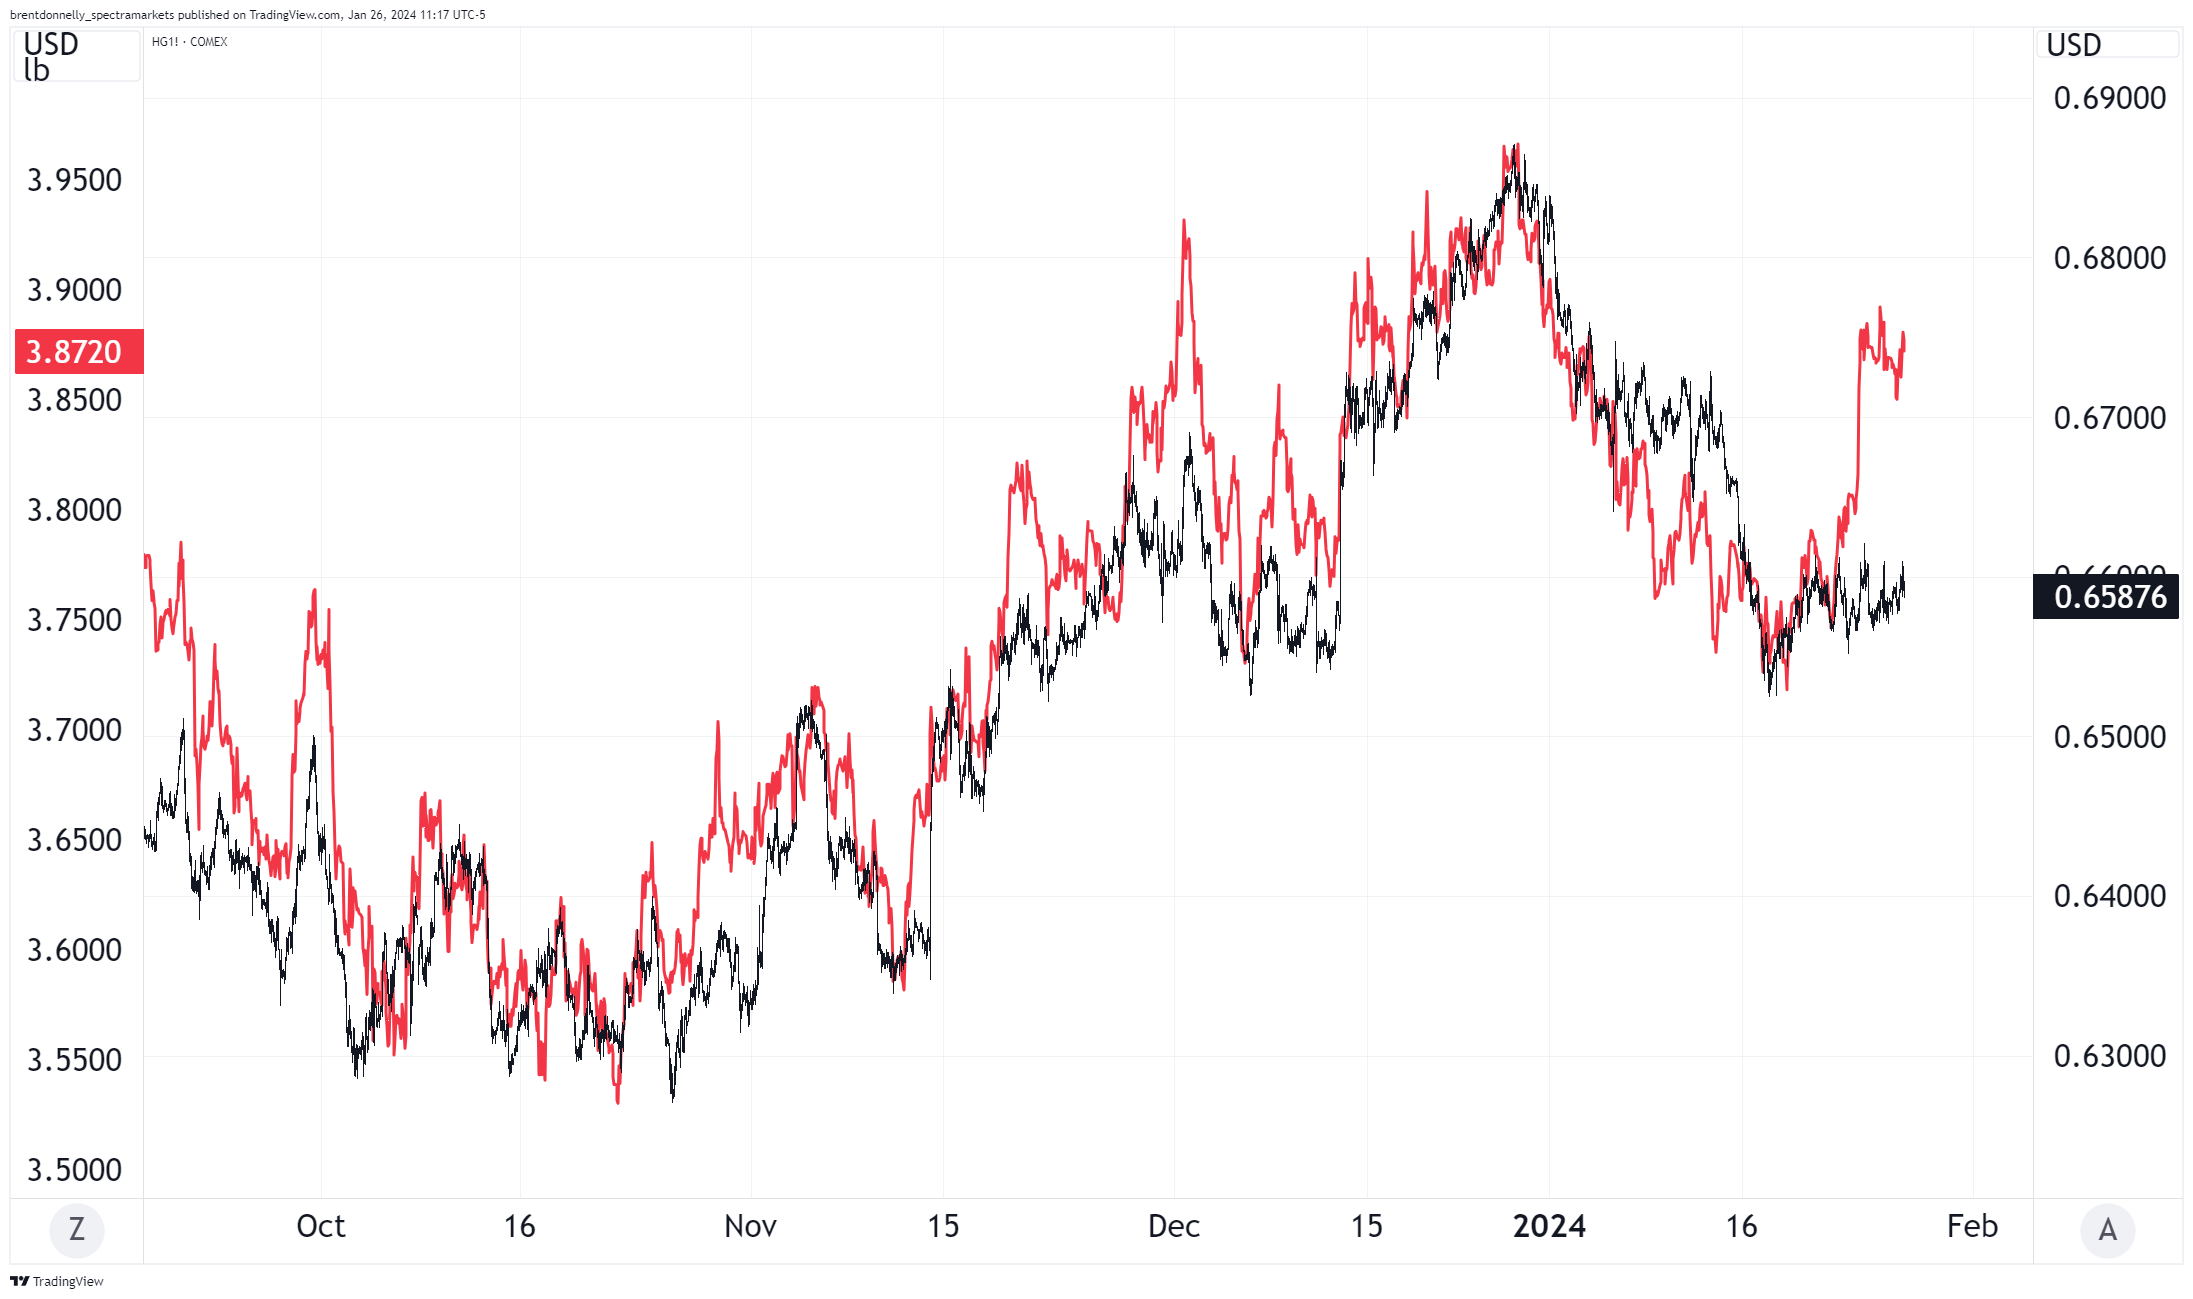
Does that mean AUD is cheap? Or does it mean it trades like a pig? Maybe we’ll get more insight when Australian CPI comes out early next week.
Crypto
Bitcoin took out the stops below 40k but there wasn’t much follow-through and now it’s kind of wandering a bit aimlessly. All the hot coins, like SOL and friends, are off the boil, but not collapsing. I am a big believer in simple technical indicators because I think techs are mostly useful for risk management, not forecasting. Use simple indicators as green, yellow, and red lights and formulate your primary thesis from narrative, fundamentals, psychology, positioning and whatever else.
The reason horizontal lines are useful is that they tend to reflect real bid and ask supply and demand in the real world. This is in contrast to something like a Gann fan or a Fibonacci number which is purely numerical and unrelated to underlying market making / order flow. I explain this here:
https://www.spectramarkets.com/technical-analysis-market-structure/
A feature of horizontal lines is that when they break, they tend to stay as significant reference points in the other direction. In other words, broken resistance becomes support. This is what has played out in SOL so far.
SOL chart back to mid-2023
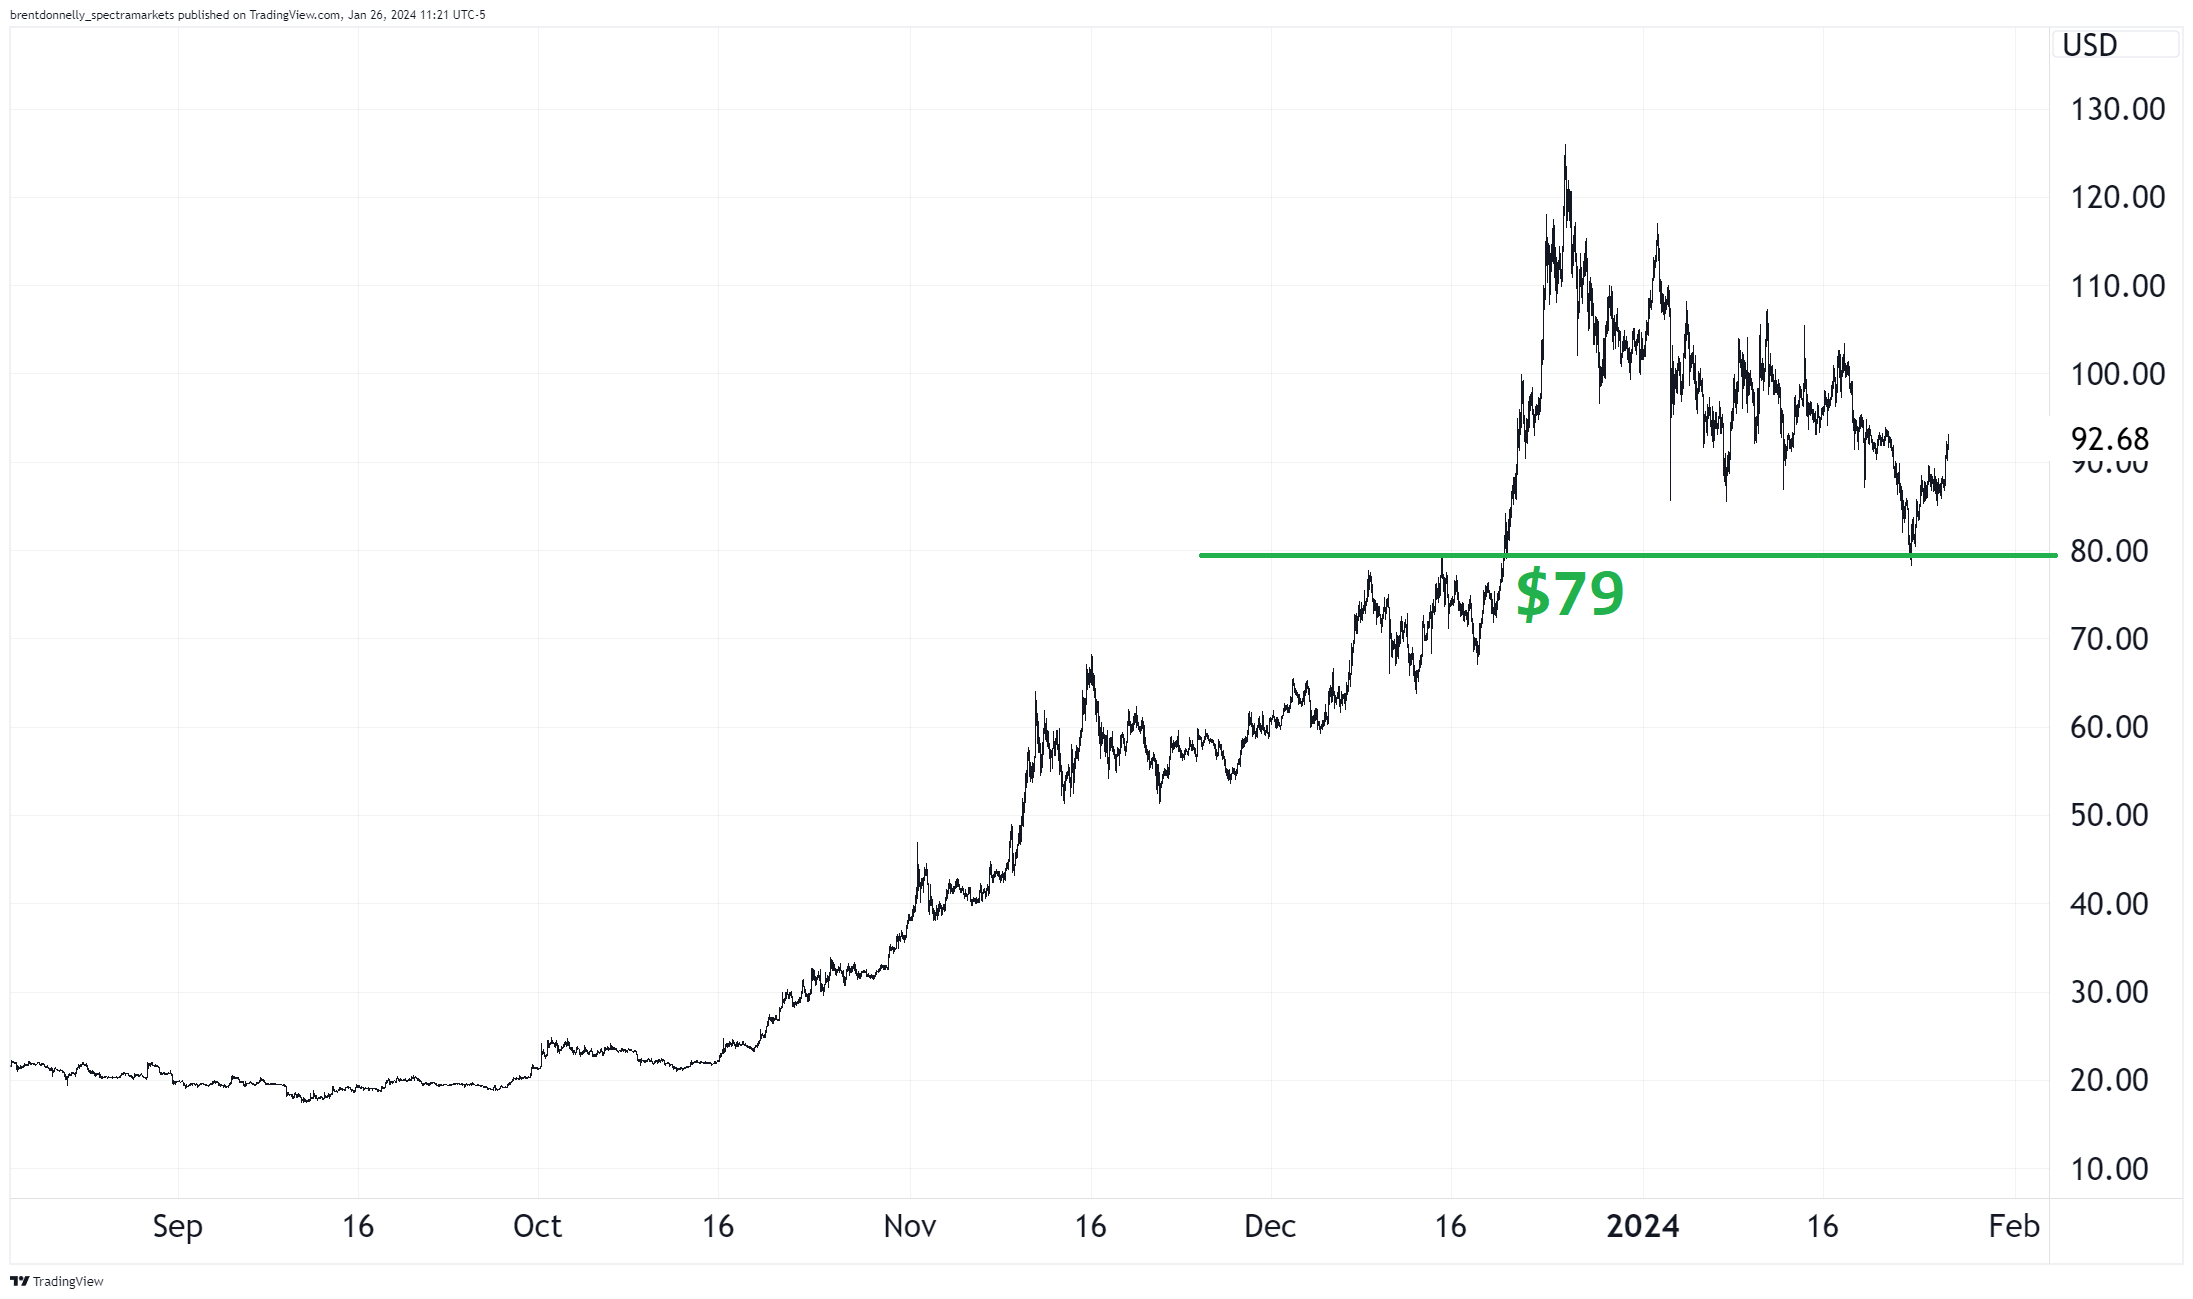
It went vertical on the break of $79, peaked at 126 and held $79 on the retest. If you’re bullish, the risk management is pretty simple: If it goes below $78.50, get out. If you expect a retest of the 2023 high, you’re risking 14 to make 32.50 from current levels.
Again, the chart doesn’t necessarily predict anything, but it gives you a way to structure your trade with a good risk/reward ratio and a clear exit plan. That’s why techs are useful.
Commodities
Copper was the big story in commodities this week as it benefits from the Chinese stabilization/stimulus and continued strong growth in the US. Other growth commodities like oil, iron ore and rebar are also doing well.
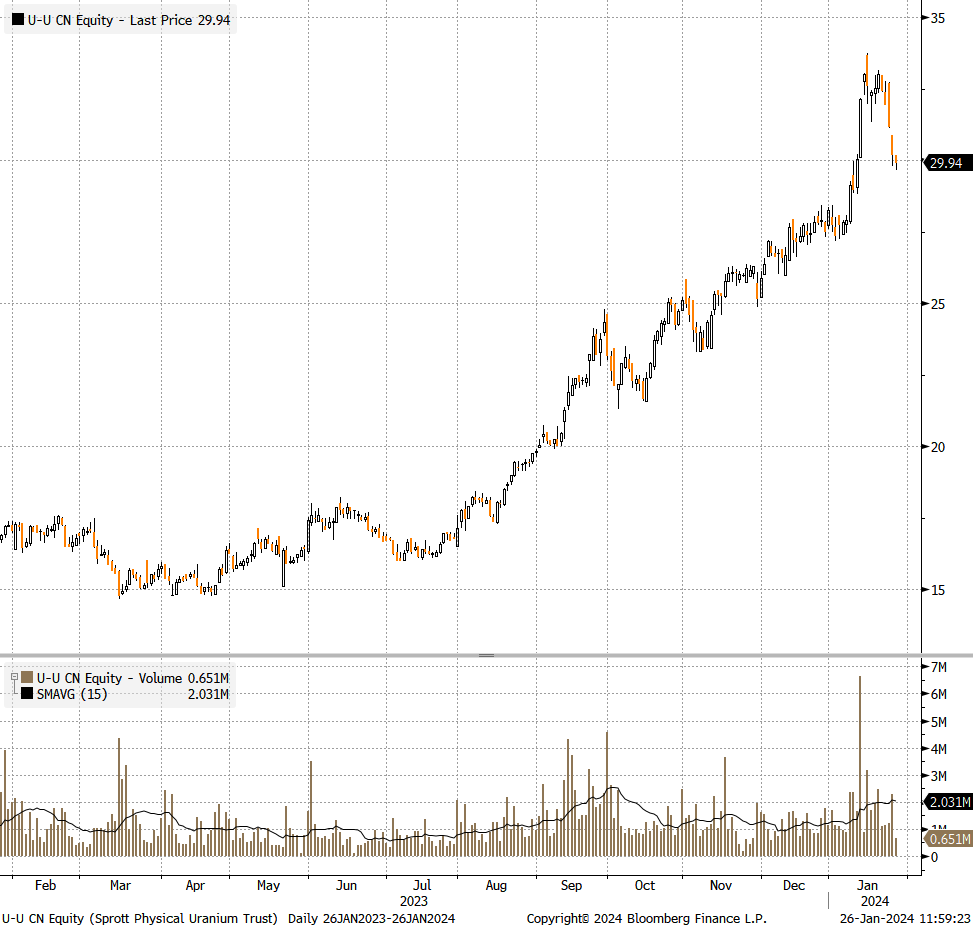
Meanwhile, one of the most hyped trades of the past few years, one that has paid huge dividends despite being highly consensus, has pulled back a bit in a spicy reversal. The Sprott Uranium Trust hit a new all-time high on a massive volume spike January 12, peaked on the 16th, and has put in a gnarly reversal. Fading something just because it’s popular is stupid, but this high volume reversal might be a warning that it’s time to take some profits if you caught the uranium wave. The half-life of this atomic rally in uranium may now be short as nuclear upside narrative momentum already hit critical mass; price action could turn radioactive as a chain reaction leads to a decay in profits.
The Sprott Uranium Trust, daily 01JAN23 to now (with volume bars)
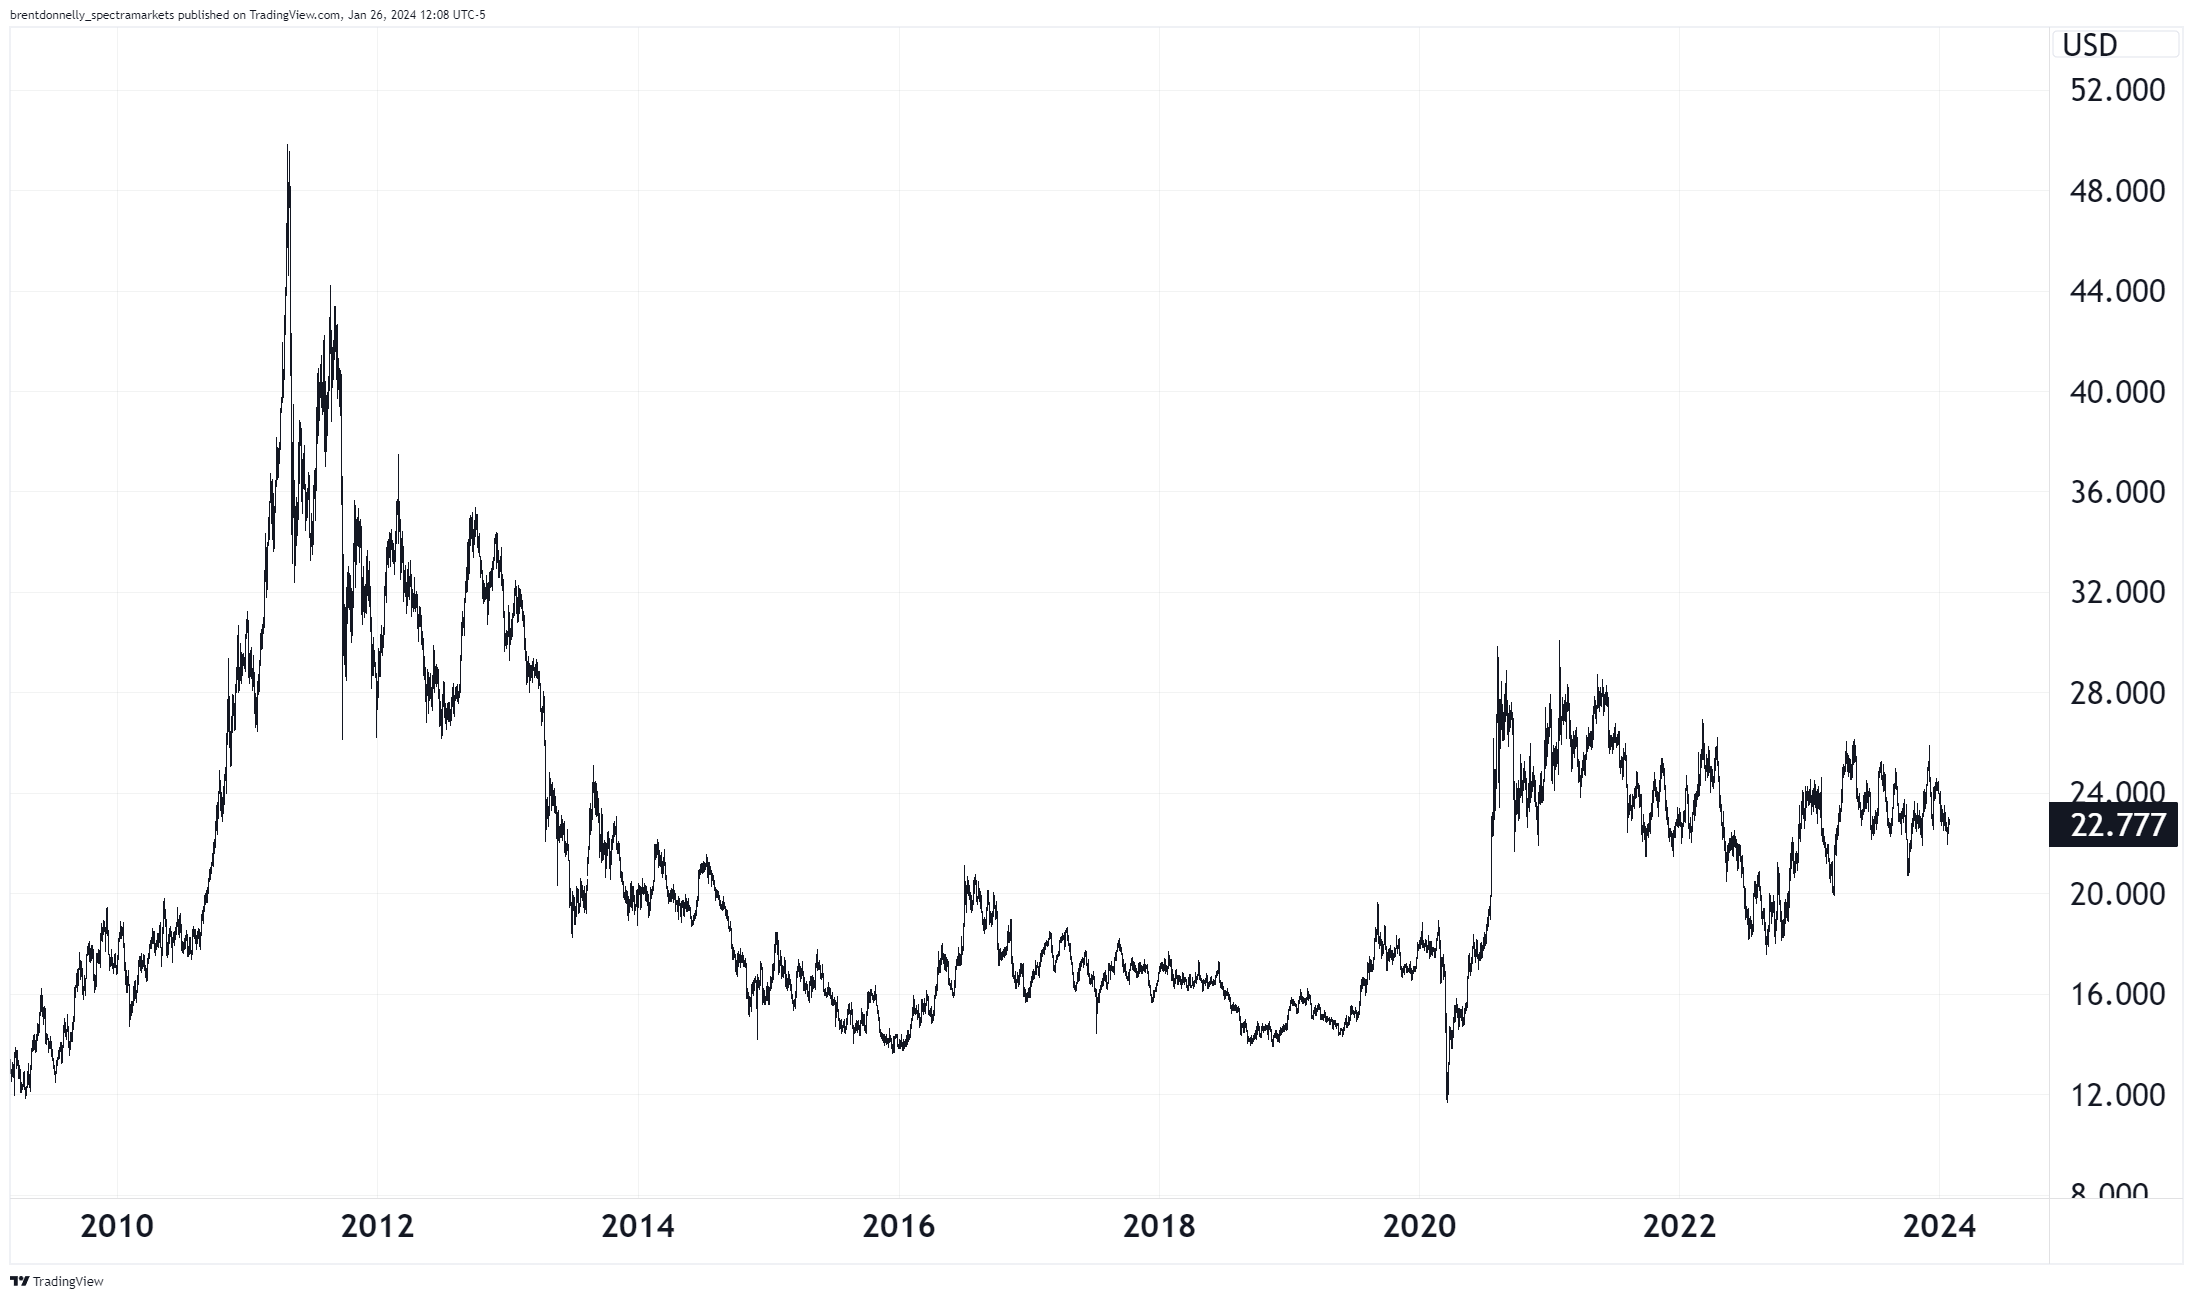
Finally, the strong dollar is pressing on the neck of gold and silver a bit this week. Given the balance sheet expansion and fiat debasement we have seen since 2010, silver should be ashamed of itself. Any way you slice and dice the data, equities and crypto have been a much better hedge for fiat debasement than precious metals. And to make matters worse, precious metals are negative carry. And to those that bought GDX. Man. That thing is a pig. Worse than the metals!
Silver, 2009 to now
OK! That was 6 minutes. Please share this newsletter with any aspiring finance professionals that you know. Thanks!
Get rich or have fun trying.
Links of the week
Interesting / smart
Very long read but worth the 45 minutes. We are not alone.
https://www.thenewatlantis.com/publications/do-elephants-have-souls
Neat
Love yo’self
We all have inner voices telling us that we suck or that bad stuff is going to happen. I like the way Snoop turns the tables here.
A podcast
The David McWilliams Podcast is very, very good. The one covering the Milei speech (linked) was particularly interesting—David’s style (edgy funny + super smart) resonates with me. Thanks Stephen for the heads up.
Music
It’s probably not cool to like Ed Sheeran, but this is still one of my favorite songs. It came out right when I was reading Infinite Jest and there is obvious serendipity/symmetry between the two (Joelle Van Dyne, DfW, etc.).
So the song and the book are both forever burnt into my mind as one singular dual memory.
https://youtu.be/UAWcs5H-qgQ
