Rate diffs offset by TINA
![]()

Rate diffs offset by TINA

![]()
Short USDCHF vol expiring 30APR
Sell put spread: 0.7800/0.7780
Sell call spread: 0.7860/0.7880
Risk 1 to make 1.1
I was off for a few days, and FX has been fairly quiet with some corporate USD buying yesterday but overall, not much going on. Today we get Powell’s last meeting as Chair, but the curve is priced almost perfectly for nothing from the Fed over the next year. I am not sure I remember a point in time in the last 10 years when there was nothing priced in either direction for a full twelve months. To get a greater than 50% chance of a move in rates, you have to scan all the way down to October 2027.
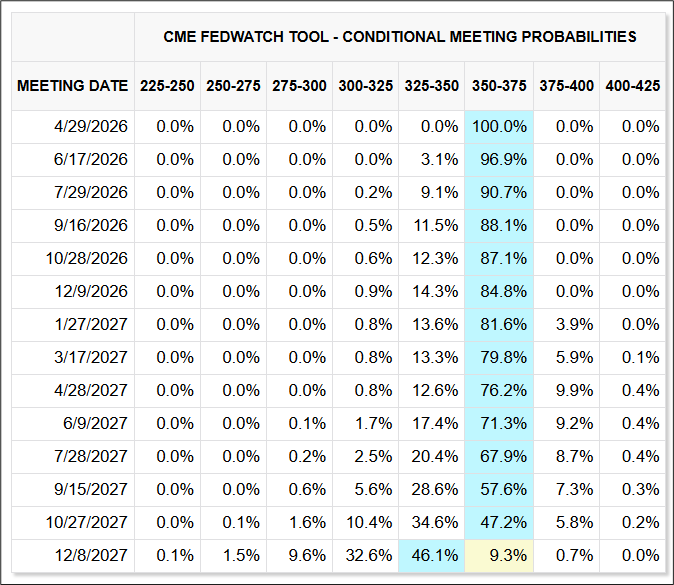
Meanwhile, you have Norway and Australia priced for hikes in May, ECB and BoE priced for a hike in June, and the RBNZ, maybe by July. Most of the global pricing looks reasonable, but markets pricing four hikes from the RBNZ over the next 12 months looks egregious to me. As has been the case for the past nine weeks, any time you receive rates in any country other than the U.S., you are selling topside wings in crude oil.
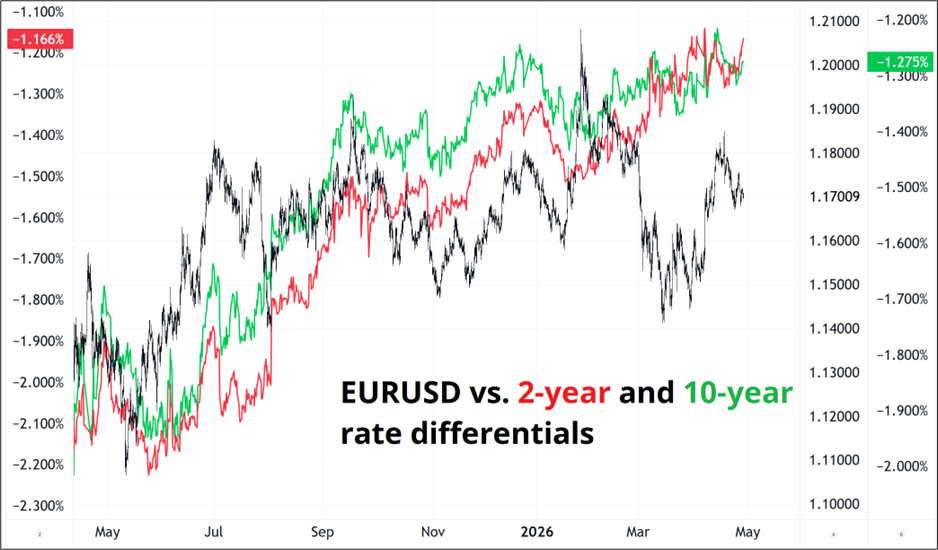
The USD is in a push and pull contest between interest rate differentials (lower USD) and U.S. exceptionalism and the rebirth of the AI trade and higher for longer oil prices (higher USD). My bet is that the weaker USD forces will prevail over time, but it’s incredibly tricky as rate hikes into economic weakness in Europe and Australia are not guaranteed to net a stronger currency as we saw in 2008 and 2011.
Here is EURUSD vs. rate differentials since May 2025.
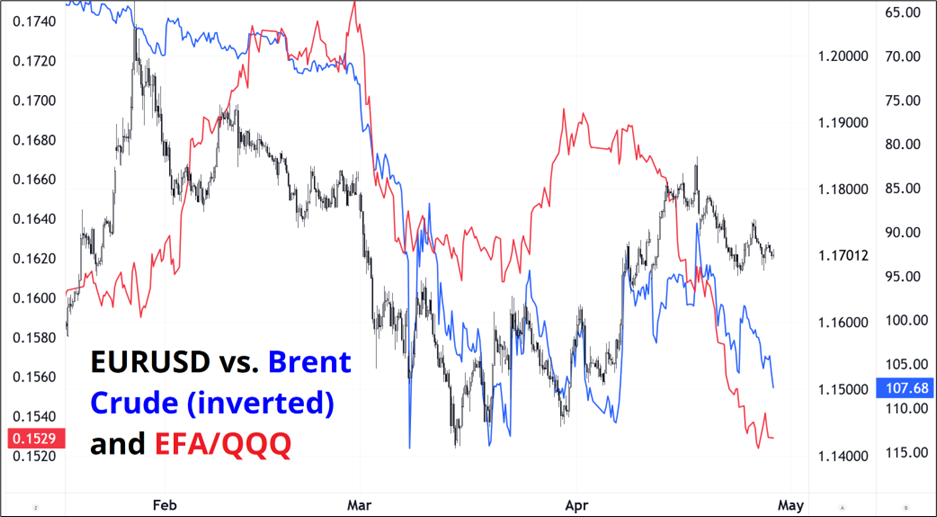
And here is EURUSD vs. oil prices and U.S. Exceptionalism. This chart starts in January 2026 because the oil relationship only mattered once the war started.
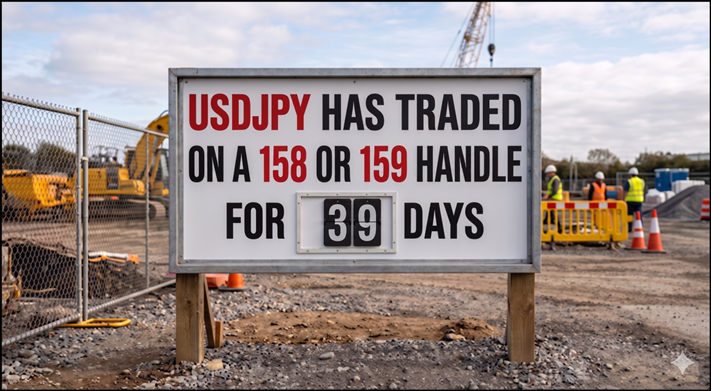
When markets are caught in crosswinds like this, I believe it’s best to wait for something to change. No real point in getting involved in G10 FX right here right now. The USDJPY story is made even more complicated by the Boy Who Cried Wolf situation as Kanda and friends continue to chirp about the weak JPY while the BOJ stands pat and nobody is willing to take on the MOF. So USDJPY remains 158/160. This cannot last forever, but if you’re bullish USDJPY, it’s scary to be long above 160 and if you’re bearish because of rate differentials, you have been wrong for so long your confidence is not strong.
Out of curiosity, I ran the Sharpe ratio of the macro majors I track. Interesting to see AUDNZD and EURNOK winning.
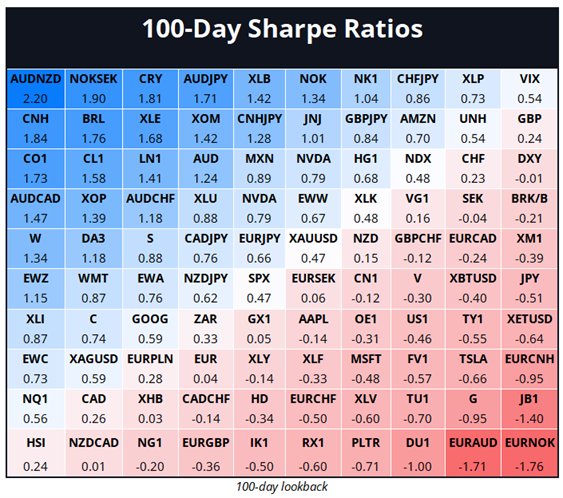
This sort of screen is a good starting point for mean reversion trades but I don’t see any other reason to be short AUDNZD right now and so I am not touching it. You could argue that the drop in gold helps make the case for AUDNZD, but given I think RBNZ is mispriced, shorts are not for me.
Today is a huge day for earnings, so I took a look at the four companies releasing today and tried to find anything interesting in their history. First, here’s a simple chart of going long all four stocks at the close of trading on earnings day and covering at the open the next day.
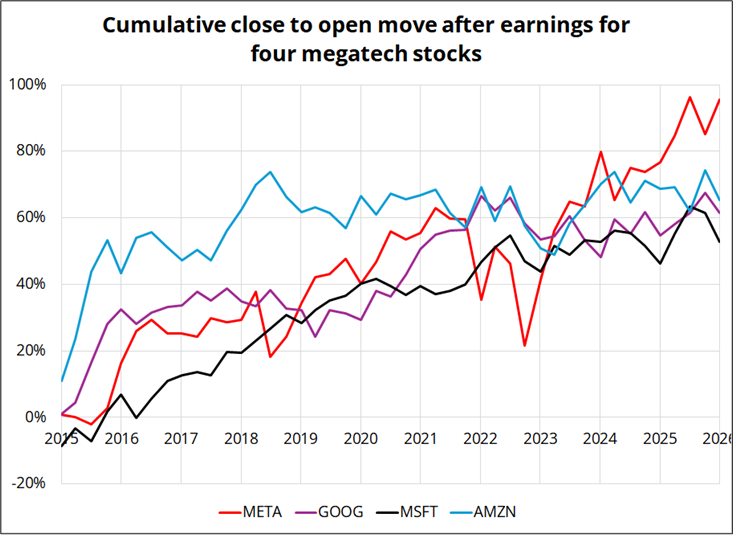
The chart is what I would have expected, and mostly reflects the historical regime where these companies were cash printing machines with very low capex. In other words, there is no strong reason to expect the earnings outperformance trend from 2026 to 2035 to match what happened 2015 to 2026.
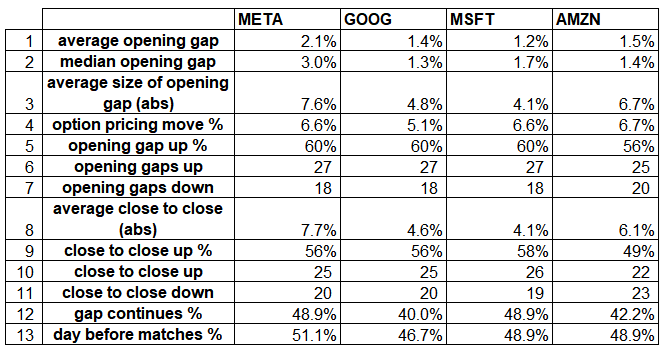
I had some other questions. They are answered in this table (line-by-line explanations below). All data 2015 to now.
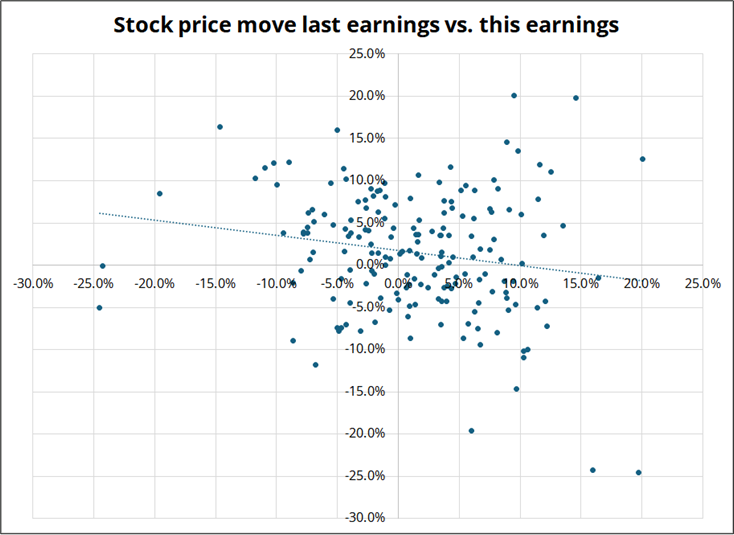
Finally, I checked the relationship between the move last time and the move this time. That is, if the stock went up on earnings last time, is it more likely to go up or down this time? The data is pretty random, but there is a mild mean reversion aspect. This makes sense to me. For MSFT today (for example) perhaps there’s a slight asymmetry where people are less shocked by bad earnings given the last report was weak. In other words, the surprise factor would come from a miss in the other direction.
If a company’s stock went up on earnings last time, it goes up 51.9% of the time on the next one. If it went down last time, it goes up 67.6% of the time on this release. Overall, two earnings reports in a row have the same sign only 44.1% of the time. So there is a bit of a mean reversion element, which makes sense from a behavioral finance perspective: People anchor on what happened last time.
This scatter shows META, AMZN, GOOG, and MSFT earnings 2015 to today.
The earnings moves for the stocks last time were:
META +10.3%
AMZN -9.0%
GOOG -6.0%
MSFT -8.6%
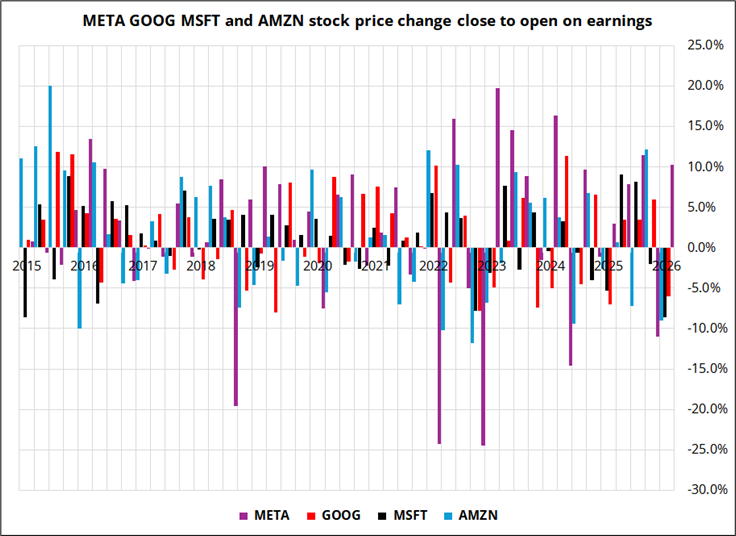
And here’s the full data set for your scanning pleasure.
Avis went all the way back down. I have a great story about trading that little bubble last week, and since my new book is already with the proofreaders, I will publish it in here at some point. Pretty sure it’s my best PA trade ever. The educational part is how I did four different trade structures, and how each of them did or did not work out.
Apologies for the lack of FX trades of late. Sometimes you just have to wait. The USDCHF ping pong trade needs some USD selling to come in over the next 24 hours, or it’s going to finish out of the money. With stocks up 9% or so this month, I would expect some heavy USD selling in the next 24 hours and so I am not giving up hope.
The “Captured Fed” narrative is completely dead at this point as the market converges on the reality that economic data and the real world ultimately determine Fed policy. Not the president. With the ultimate insider replacing Powell, I don’t think the new Fed is going to look any different than the old Fed. Warsh can bloviate about the balance sheet, but do you really think there is going to be a meaningful reduction supported by the committee? It’s like politicians saying they will reduce the deficit. Sure.
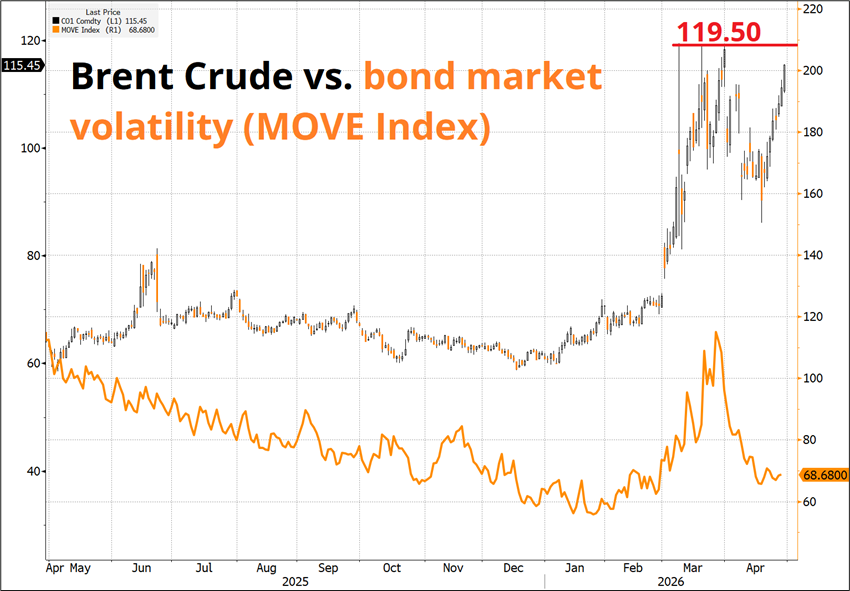
It’s easy to forget about oil, but don’t! A break of $120 in Brent will probably lead to an uptick in bond market volatility and a less complacent world with tighter financial conditions.
![]()
