Why sentiment data in the US has not been a useful predictor of hard data or the real economy.


Lamborghini started out making tractors. They still make tractors!

Why sentiment data in the US has not been a useful predictor of hard data or the real economy.

Lamborghini started out making tractors. They still make tractors!
Short CADJPY at 108.90
Stop loss 110.26
Long 10DEC EURMXN
18.70/18.20 put spread
~50bps EUR
off 19.16 spot
November 1, 2023
One of the most interesting phenomena in this economic cycle has been the way the soft data and sentiment releases in the US have been very poor predictors of the hard data. As such, the overlays of sentiment data that predicted calamity for the USA have not worked and that has been part of the reason that we have had this disconnect between the persistence of the recession call throughout 2023 and the much brighter reality. If most economists use soft data as a leading indicator, and it’s wrong, then most economist forecasts are going to be wrong.
There seem to be two things going on. First, the psychological and emotional damage from COVID continues to be a dark blot on the fabric of the US psyche. The pandemic blasted a hole in citizens’ trust in government, money, politics, science, and more. And it brought painful inflation. As such, consumer sentiment remains depressed, regardless of nominal economic performance. You can see this marked in yellow in the heatmap.
Second, there is this pervasive fear that higher rates will lead to economic disaster. You see it on Twitter, and you see it in business sentiment as the start of the Fed rate hike cycle cracked business sentiment and it never came back. I’m making a cause/effect statement here that is wildly simplistic, but tight money is probably at the heart of it.
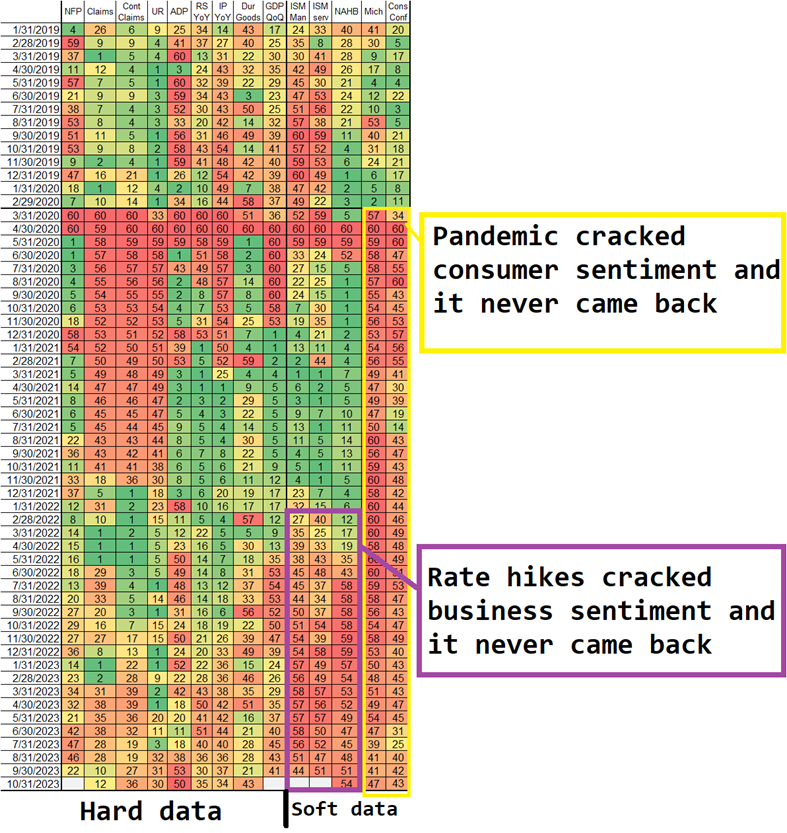
This sort of heatmap is a nice visual way to see the evolution of the economy over time. I took a look at the 2002-2010 cycle as well just to see if anything interesting jumps out.
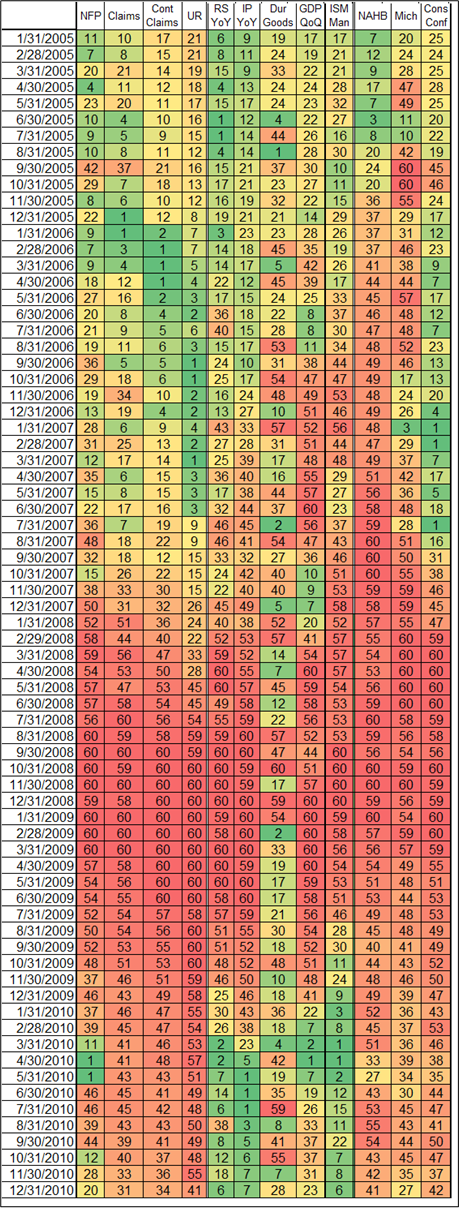
The first thing I looked at was which series led as we moved into the 2008 crash. If you look at the first four columns, NFP and Claims turned first, while Continuing Claims was slow and the Unemployment Rate was very, very late. This is consistent with what you see if you overlay Claims and UR. The Unemployment Rate is a useless, badly lagging statistic. I don’t know why anyone even looks at it. Same thing every cycle.
In that cycle, NAHB obviously gave an early warning, but that cycle was more housing-centric than any other and this cycle is less housing-centric than any other when it comes to employment and economic outcomes. ISM was an OK lead indicator, in theory, except that it rebounded April/June 2007 after the Bear Stearns bailout and so again sentiment was a really bad indicator there. It just followed the Fed and the stock market, the opposite of 2022 when lower stocks and a tighter Fed dropped ISM and it meant little for the real economy.
All this shows is there is no right answer, or one size fits all methodology that works cycle-to-cycle or regime-to-regime. Some data like the US Unemployment Rate, is always lagging and never useful. But soft data is a good predictor at times, and useless at times. When sentiment is driven by politics, deaths of despair, inflation, collapsing trust in institutions, and other variables unrelated to nominal growth, it’s not a good predictor of nominal growth. That’s been the case this cycle. That’s why hard data is so much more important than soft data right now.
As such, I think the most important data points for tracking the US economy right now are:
What other hard data do you think will lead if and when the US economy turns weaker?
Take a look at the positioning report below. I think the broad theme of diverging nominal yield direction is interesting and makes for some compelling possibilities in the CAD and AUD crosses, for example.
Have a high-powered day.
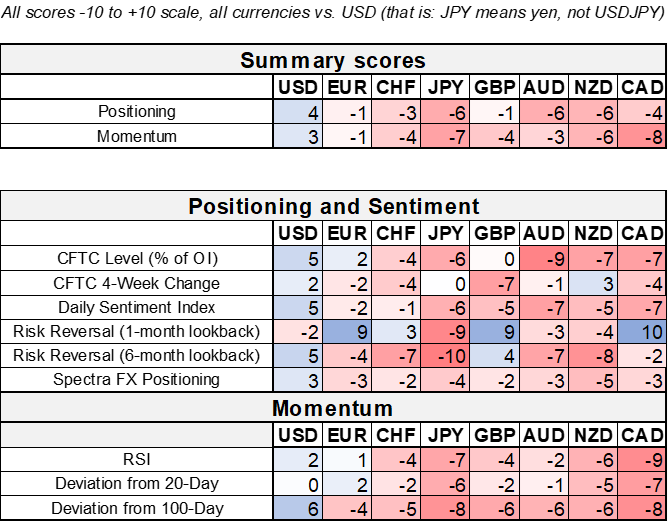
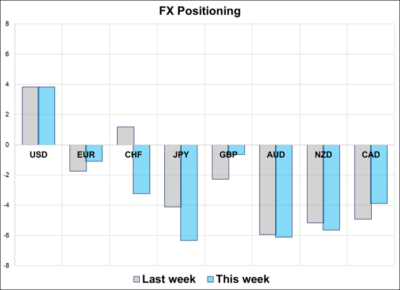
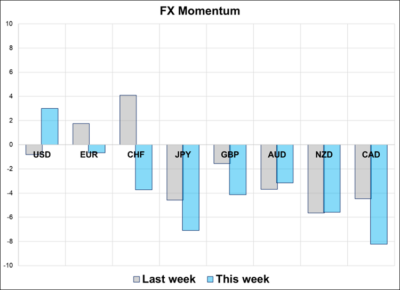
The Spectra FX Positioning and Momentum Report
Hi. Welcome to this week’s report. US dollar longs remain near an extreme as trend following and carry models and real money continue to gradually build long positions. The foray into CHF longs on the Middle East conflict was short-lived and EURCHF is churning in a way that first hurt the CHF shorts built up after the dovish SNB and is now hurting CHF longs built up after the Hamas attack on Israel.
1. The dollar continues to key off US yields, but rate differentials have gone wild in different directions with the RBA and AU rates finally playing catch up while European yields fall in response to slowing economies and falling inflation. As such, the interest rate overlays tell a mixed story (AUDUSD higher, EURUSD lower, etc.) and are not useful for dollar prediction in aggregate.
This dispersion has put many crosses in the limelight as the general vibe out there is: I can’t be long USD at these levels but it’s pointless to be short. The sentiment is generally that there will be a time and place for a big USD down trade, but we aren’t there yet. The market is scared of the ballooning US deficits and fiscal story but unwilling to fight the cyclical growth story because it refuses to die. Atlanta Fed GDPNow at 2.3% vs. economists at 0.8% is symptomatic of the persistent doom and gloom out there—doom and gloom that never seems to come to pass.
Hiding out in the crosses is a rational response to USD crosswinds.
2. It’s a good setup for the MOF if they want to intervene. Positioning is long USD, the BOJ is normalizing, and US yields are not skyrocketing for now. They can argue that FX moves do not reflect fundamentals and are more a result of speculation. Some will scoff, and I’m not saying they have an amazing argument, but they can argue it with a straight face, if they want to.
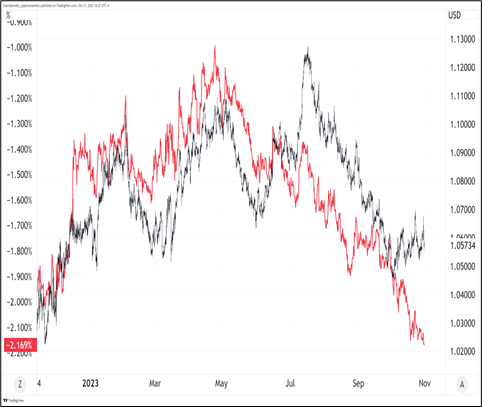
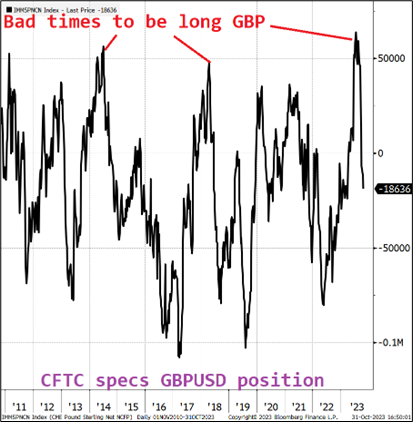
3. As discussed throughout June, the CFTC has a terrible record with GBP longs. The huge long it put on around 1.2800 has now finally been liquidated so that is one less headwind for cable now.
—
That’s this week’s report. Thank you for reading.

Ferruccio Lamborghini, the man who founded the company of his namesake, originally owned a tractor company. Lamborghini Trattori S.p.A was founded in 1948 in Cento, Italy. Despite being famous for becoming a luxury car entrepreneur, it took Lamborghini fifteen years to begin producing sports cars.