The CADCHF short was sort of like being wrong and still not losing money. I still like the trade.
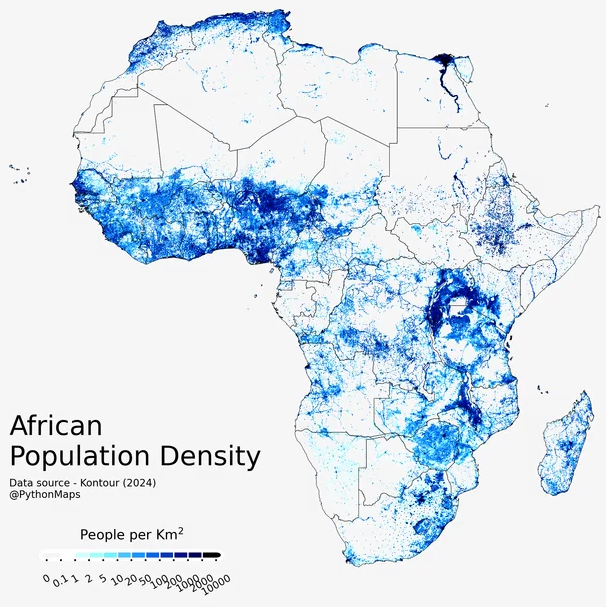
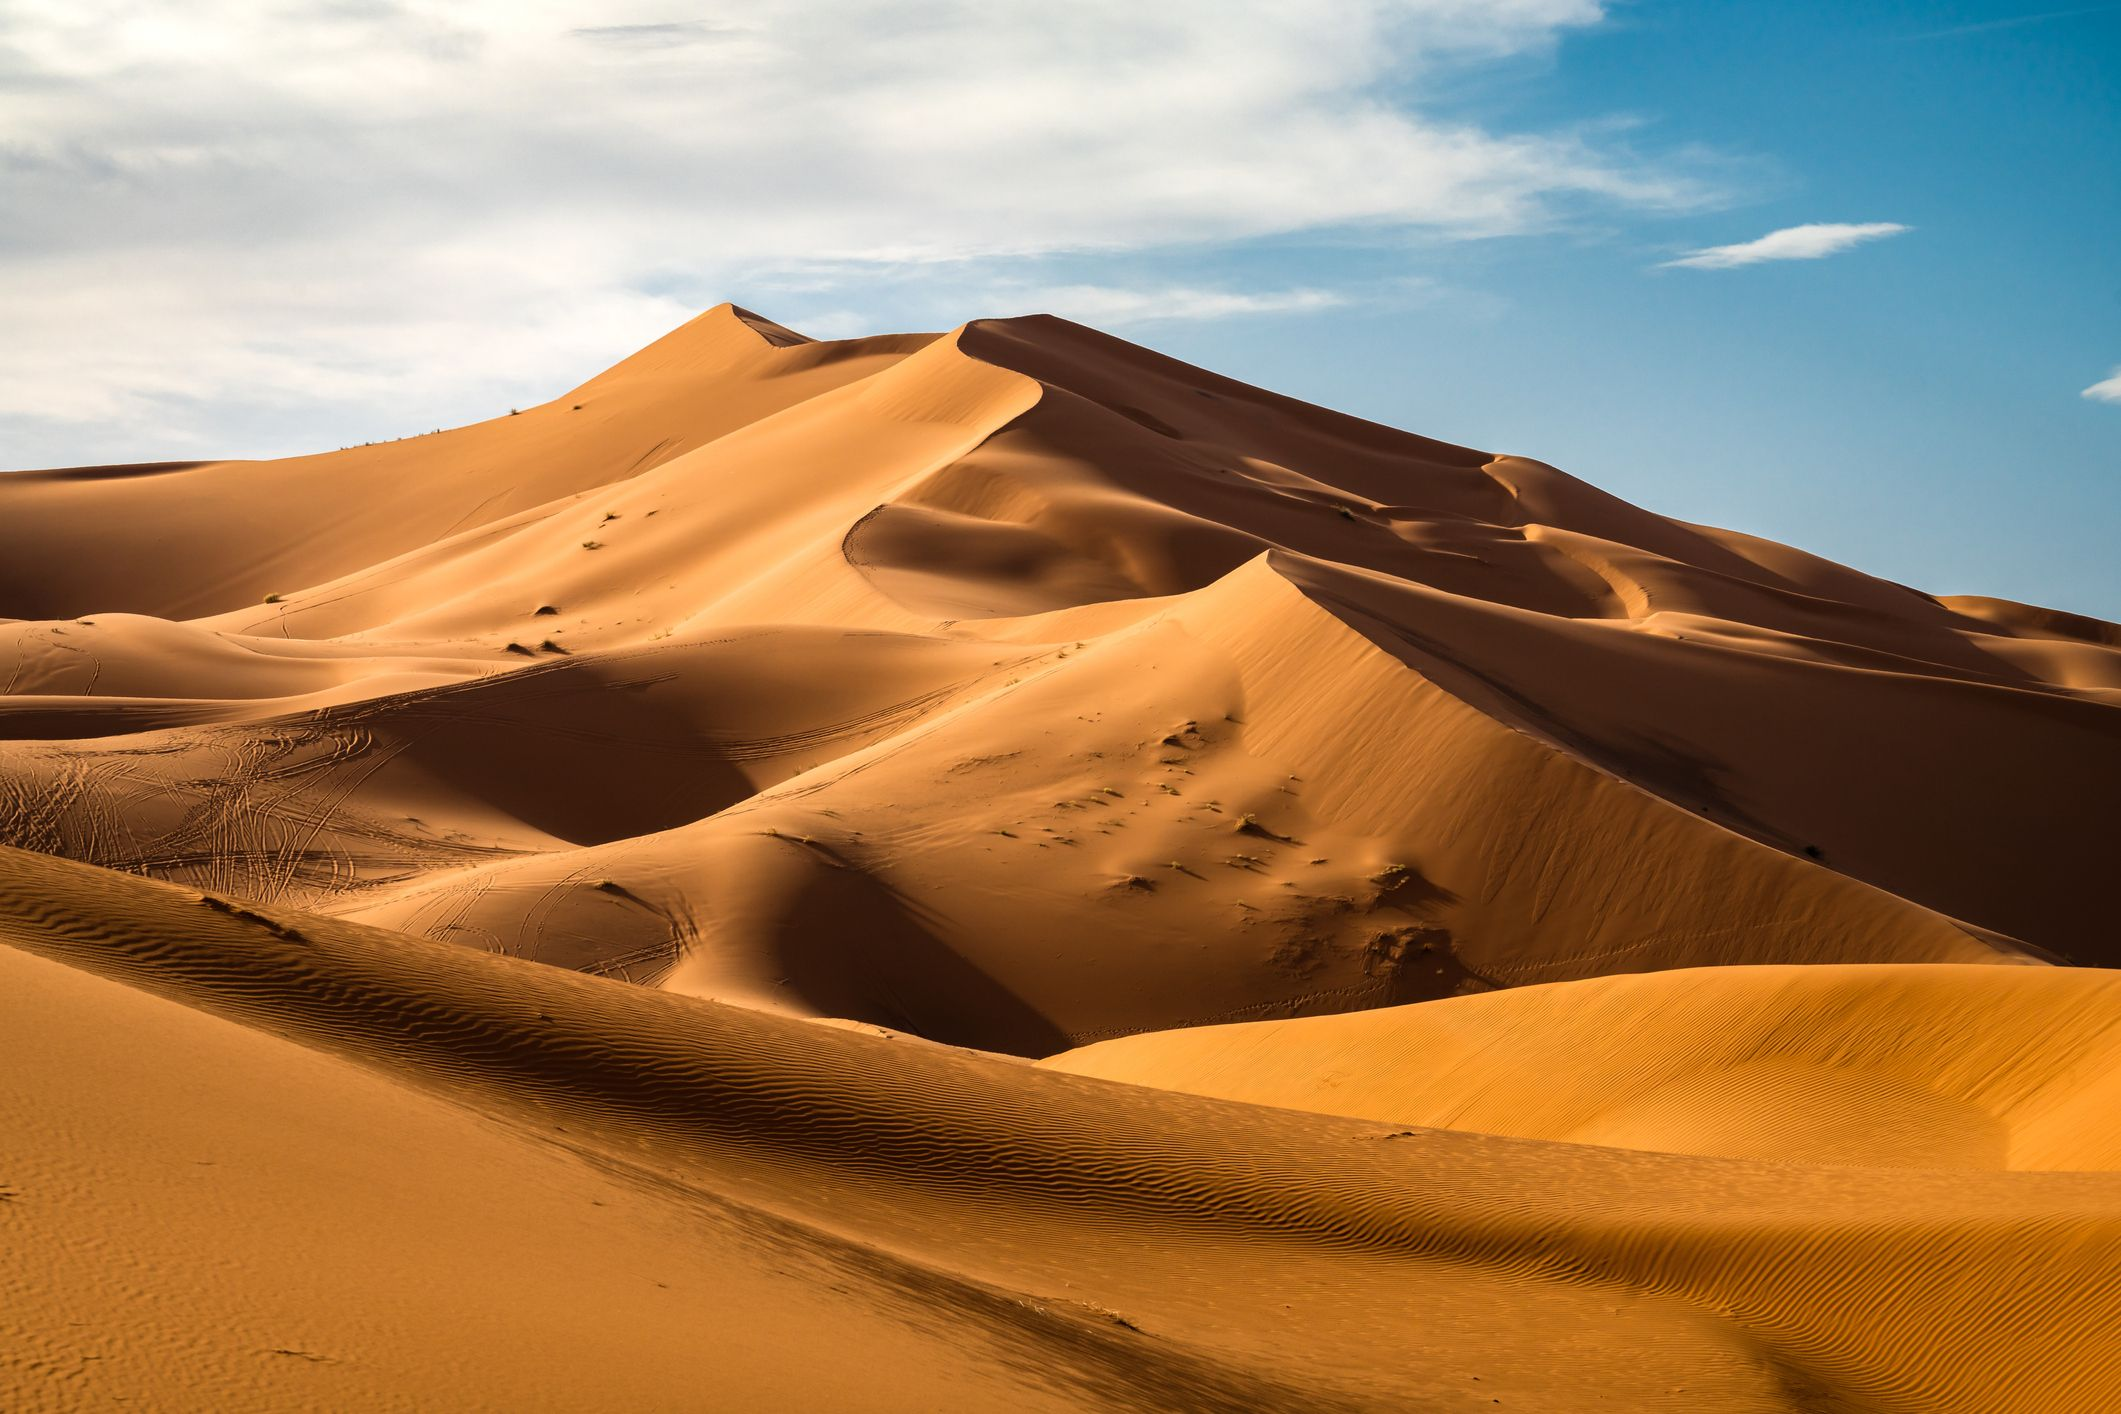
African Population Density features a large empty patch

The CADCHF short was sort of like being wrong and still not losing money. I still like the trade.
African Population Density features a large empty patch
Stop loss 0.6576
Welcome to the new look and feel of Spectra Markets. Please check out the rest of the new website, where you can search the am/FX and Friday Speedrun Libraries and see what else we are working on. Like Spectra School. Feedback is always welcome and appreciated. Shoutout to MM and JR who made this all happen!
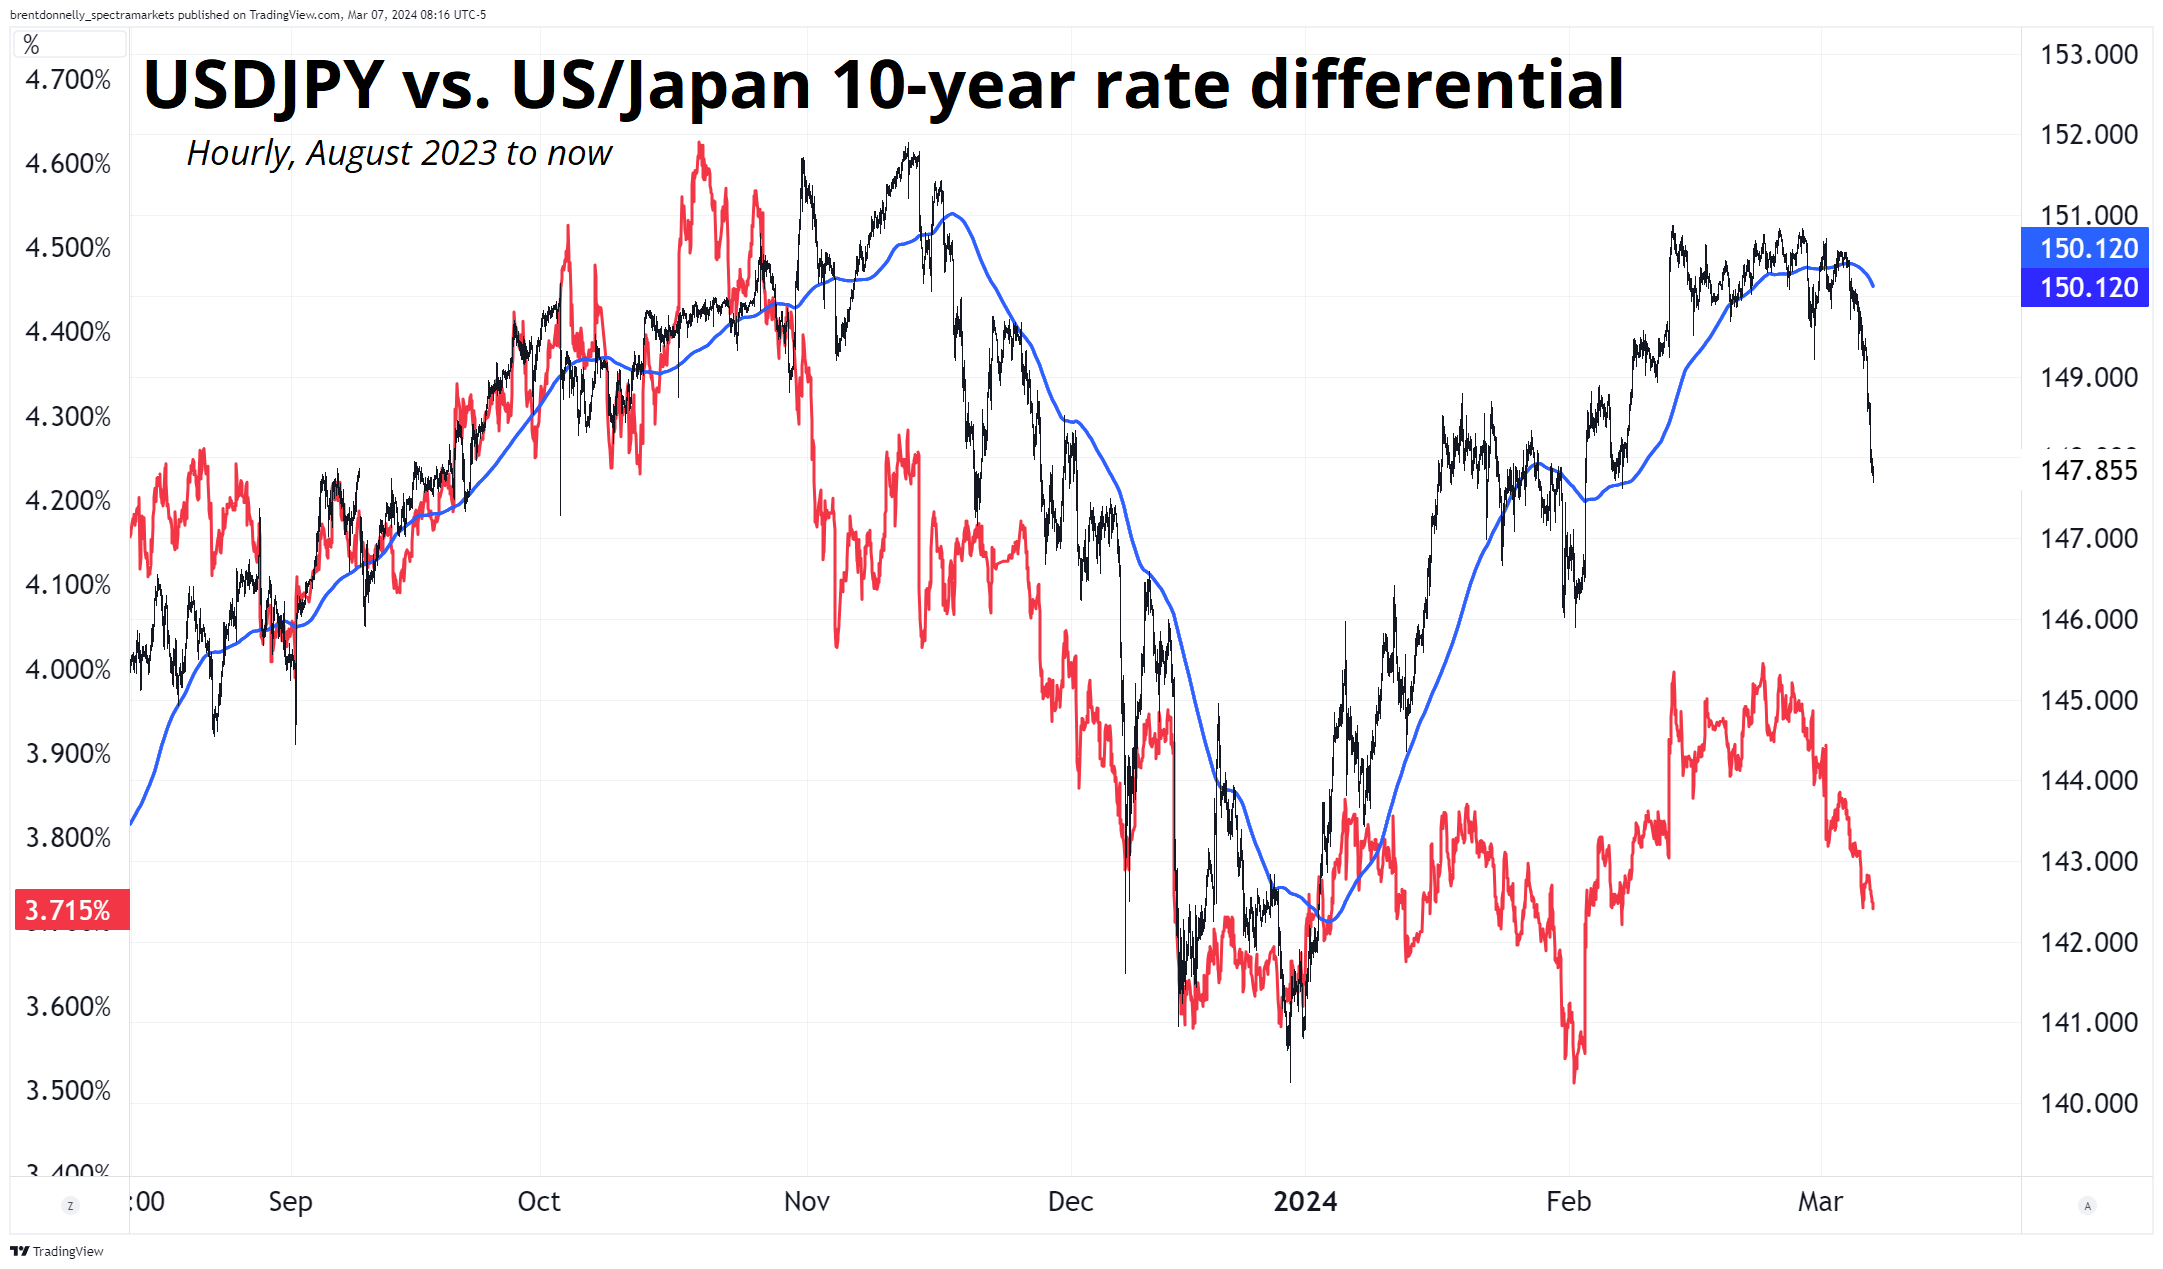
It feels like the great BOJ normalization trade of 2022 and 2023 is now the trade of 2024, but really it’s probably just that USDJPY is catching down to US yields after long and unbearable lags. Rate differentials have pointed lower for a while and now the gap has started to close.
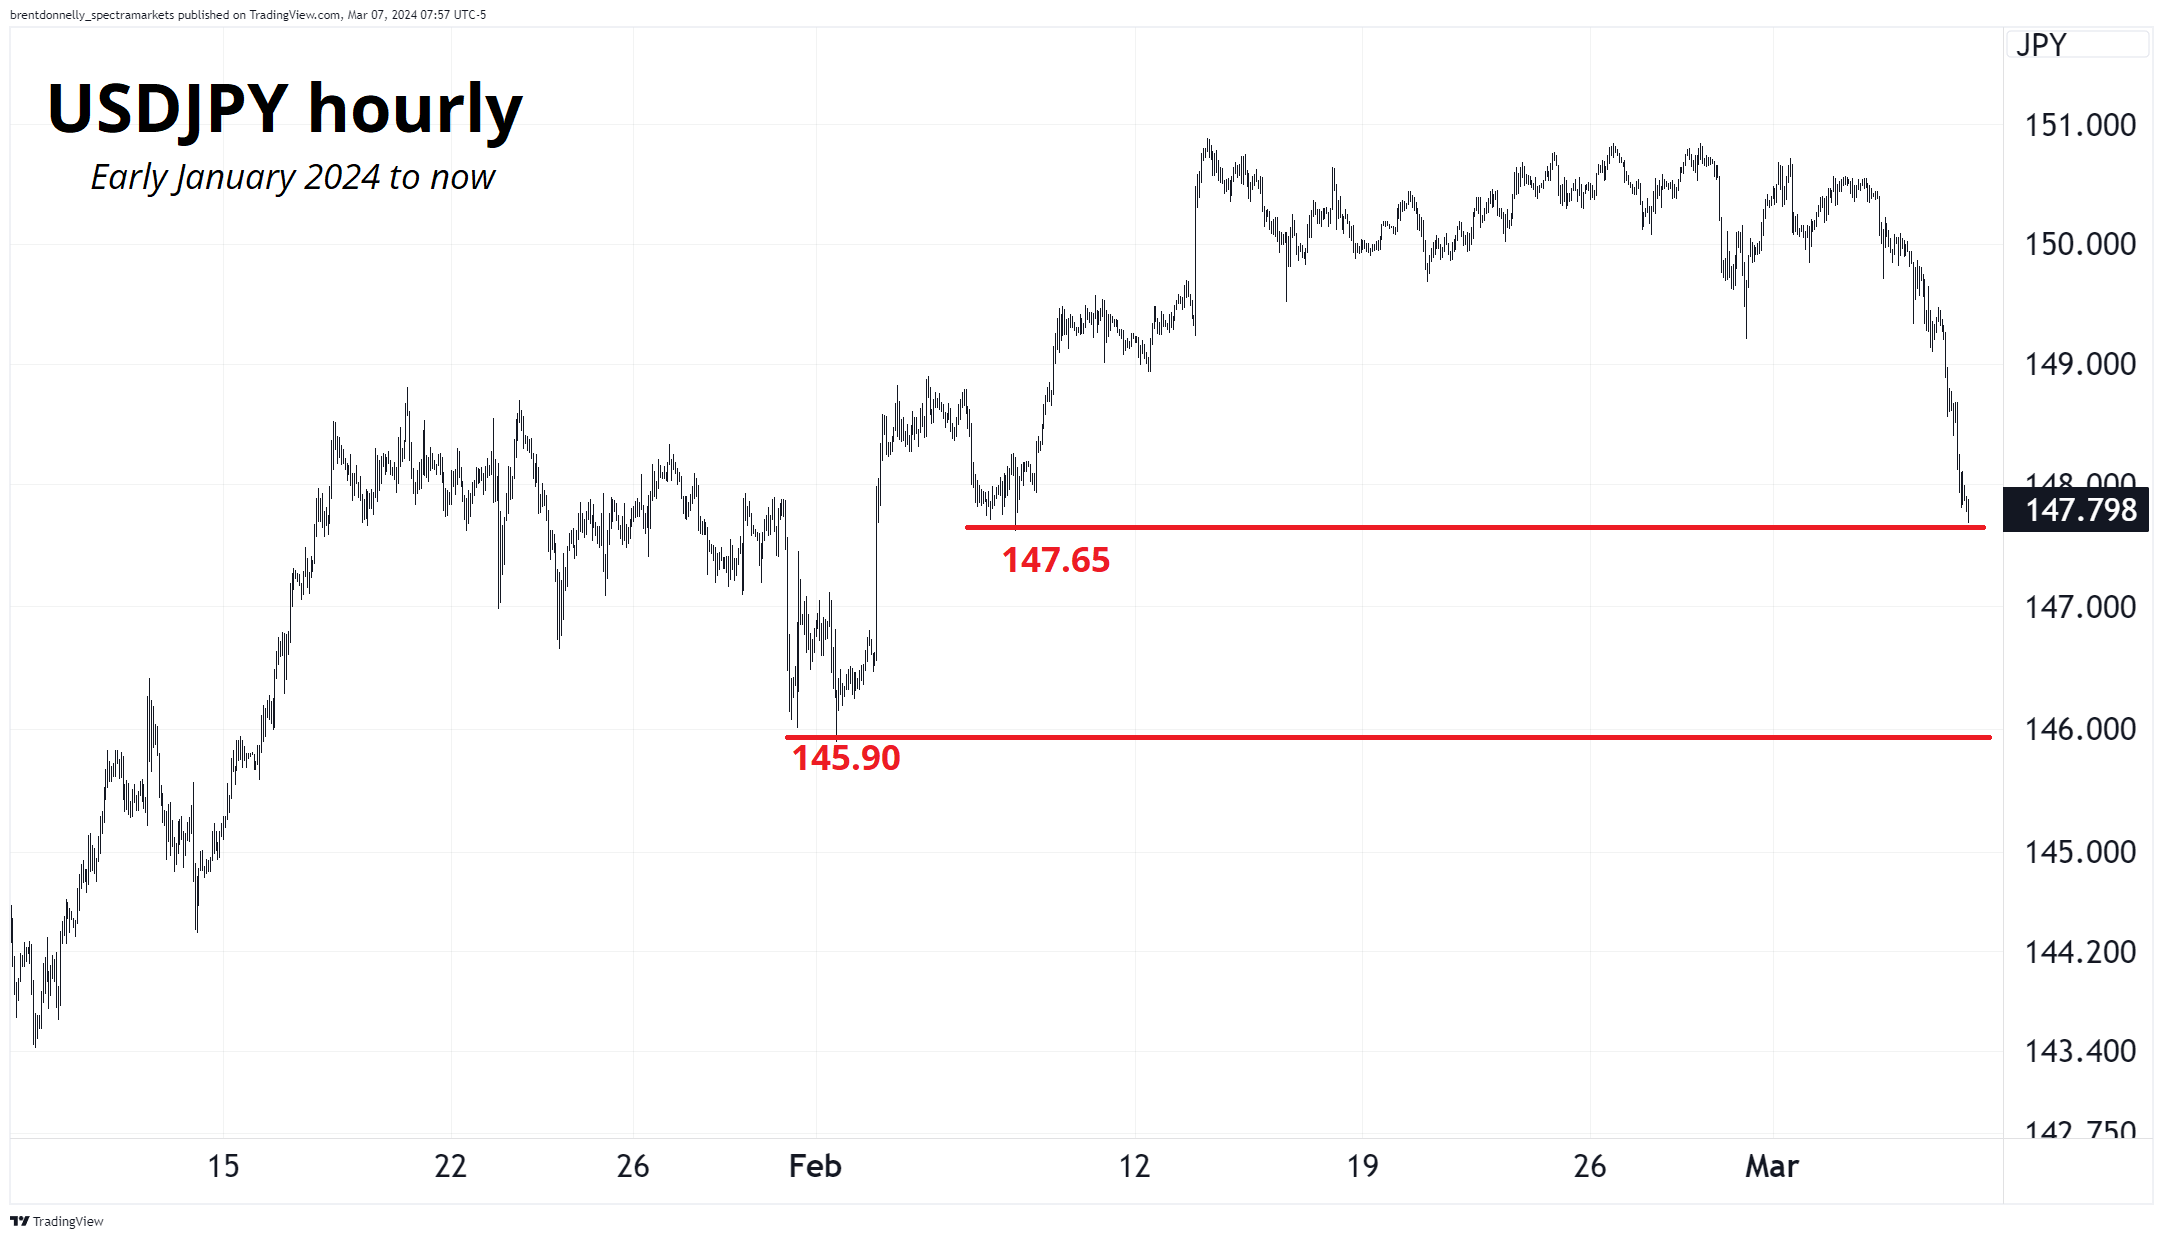
We are now on first big support, and I expect more profit-taking than new positions here as the market was not overly long USDJPY. While carry models and CTAs were certainly long, specs were leaning short CHFJPY and flat USDJPY. Given the relative strength of global equity markets, the rippers in gold and BTC, and the hard-to-explain sogginess in yields, a weak NFP is going to trigger huge moves in yields and the dollar while a strong release will probably be seen more as a chance to fade.
That said, I believe Average Hourly Earnings tomorrow is the most important component of the release following Waller’s comments (discussed yesterday) while the February CPI data (released March 12) is the real determinant of whether or not we accelerate this yields down / USD down regime. If the January inflation data was a seasonal aberration, that’s going to be huge for the immaculate disinflation macro believers.
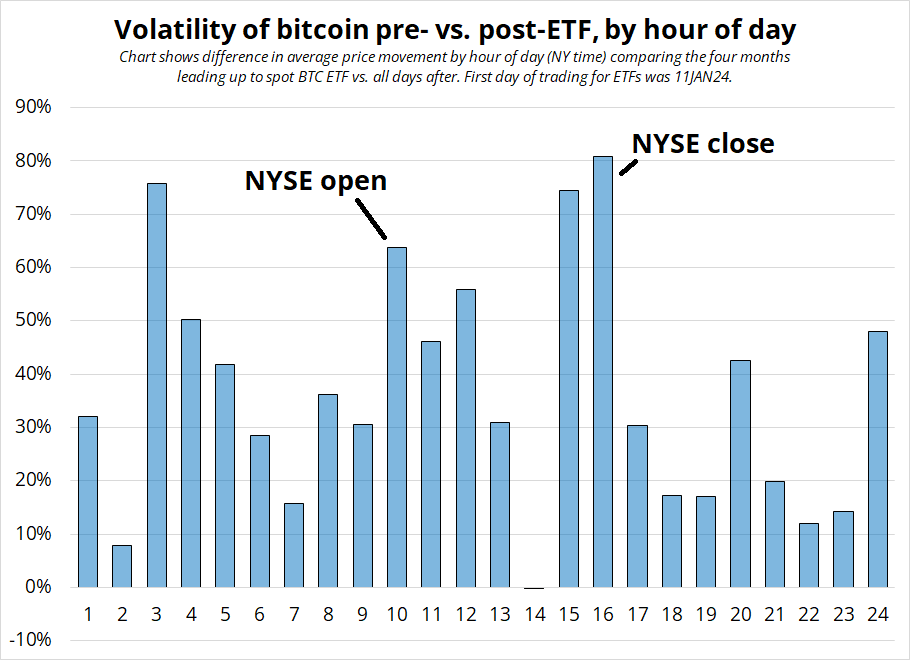
I have been curious about the microstructure impact of the spot ETFs on BTC as the OG coin morphs from initial visions of a libertarian peer-to-peer electronic cash system into mostly a Wall Street flow object / liquidity and risk appetite thermometer. In theory, one would expect a rise in volatility during NY hours and a spike at the open and close as NYSE flows tend to cluster at those key times. That’s what happened!
The chart shows the increase in volatility by hour of day for the pre- and post-ETF eras. I am simply taking the average hourly move (absolute value of change) for each hour and calculating the change for regime 1 vs. regime 2. The pre period (regime 1) is 01SEP23 to 31DEC23 and the post (regime 2) is 11JAN24 to now. I would have thought the NYSE open at 9:30 a.m., i.e., 9-10 a.m. (i.e., 10 on the chart) would be most affected but it’s the close (15:00 and 16:00) that saw the biggest jump in movement. 3 a.m. NY is BTC option expiry, so perhaps the ETF launch has led to more options strategies and hedging? That one I find harder to explain.
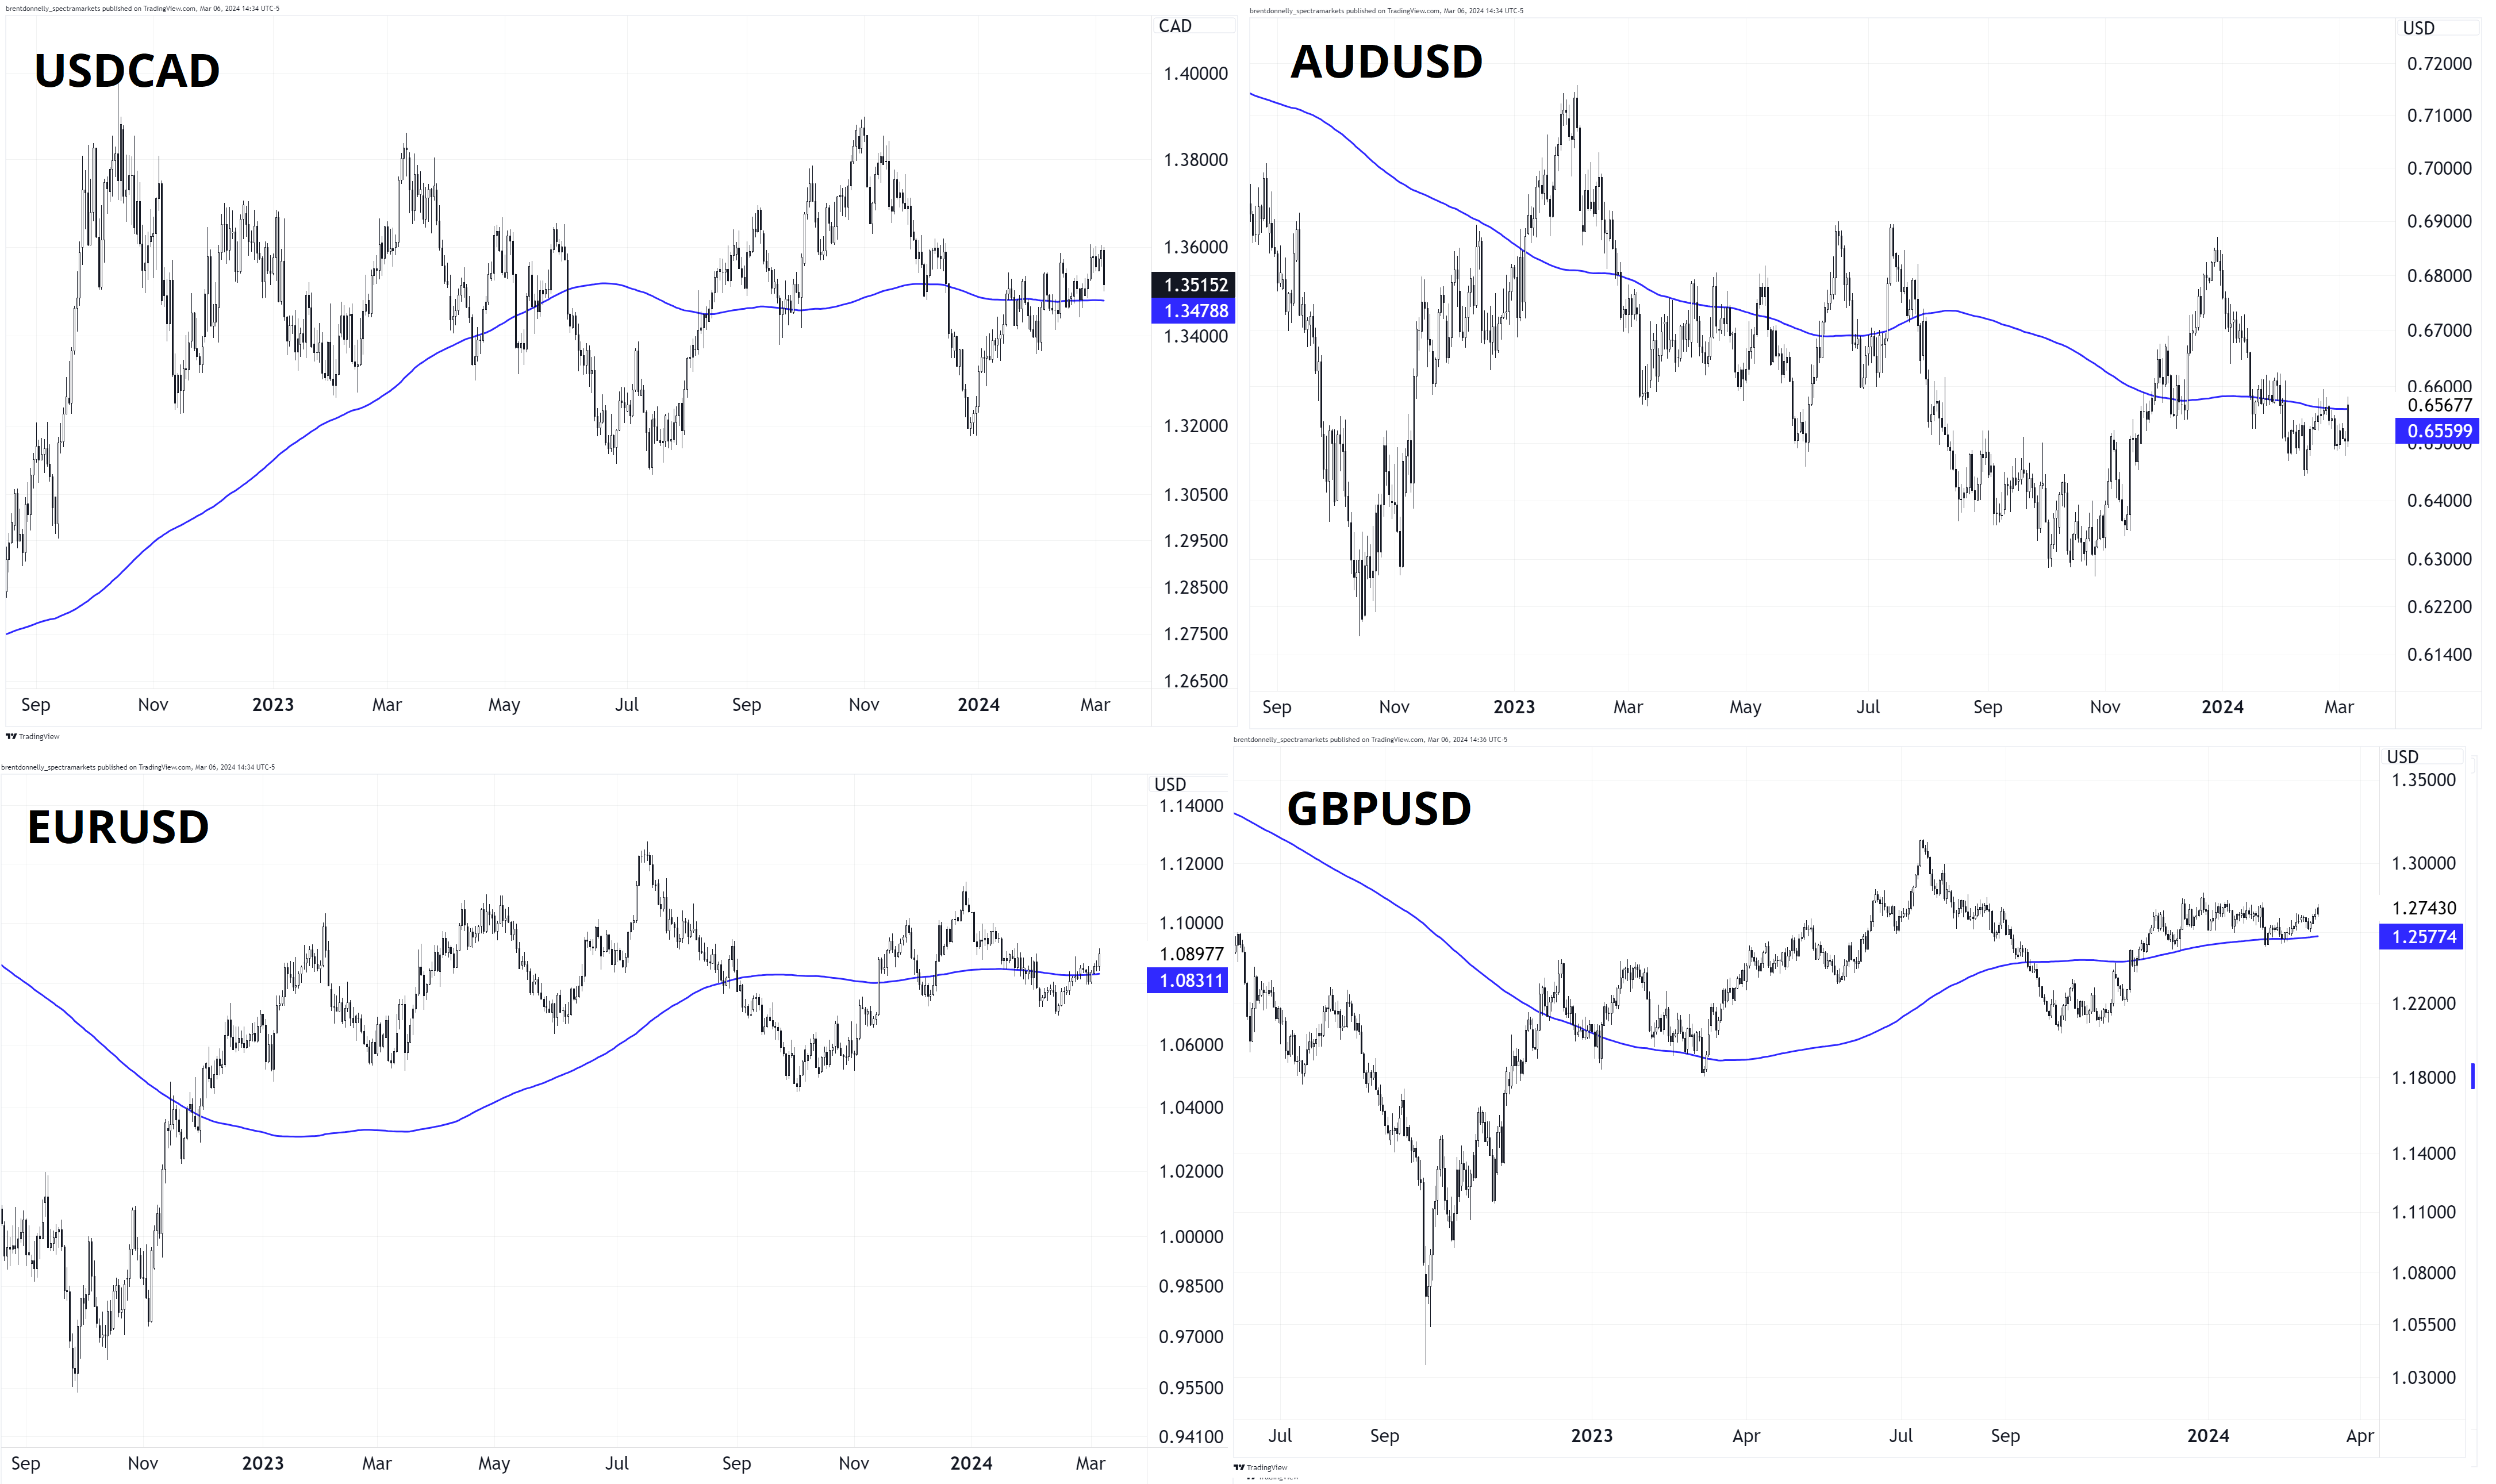
My view on the Bank of Canada was completely wrong, but CADCHF hasn’t moved much. Given the proximity of the 200-day in USDCAD, my overall bearish CAD view, and my sense that CHF short positioning is excessive, I’m going to hold on here for a bit. Also, despite yesterday’s unambiguously not dovish BoC result, rate differentials still point to higher USDCAD, not lower. I also would favor a weaker CA jobs and weaker CA earnings figure on Friday as the Canadian economy looks like it has resolved the labor shortage (see jobs vs. workers chart in here). Also note that Canadian corporate bankruptcies posted a sharp rise in January.
The trade was bad so far, but the structure (long spot, not options, and no USD long exposure) cushioned the badness. Sort of the opposite of being right and losing money, this one was being wrong and not really losing money (so far). I admit that I could be exhibiting the endowment effect here, but my rational mind insists this CADCHF short is worth holding onto. I also admit that the 200-day moving averages have been rather useless lately as is often the case in a rangebound, low vol market. Here are four of them.
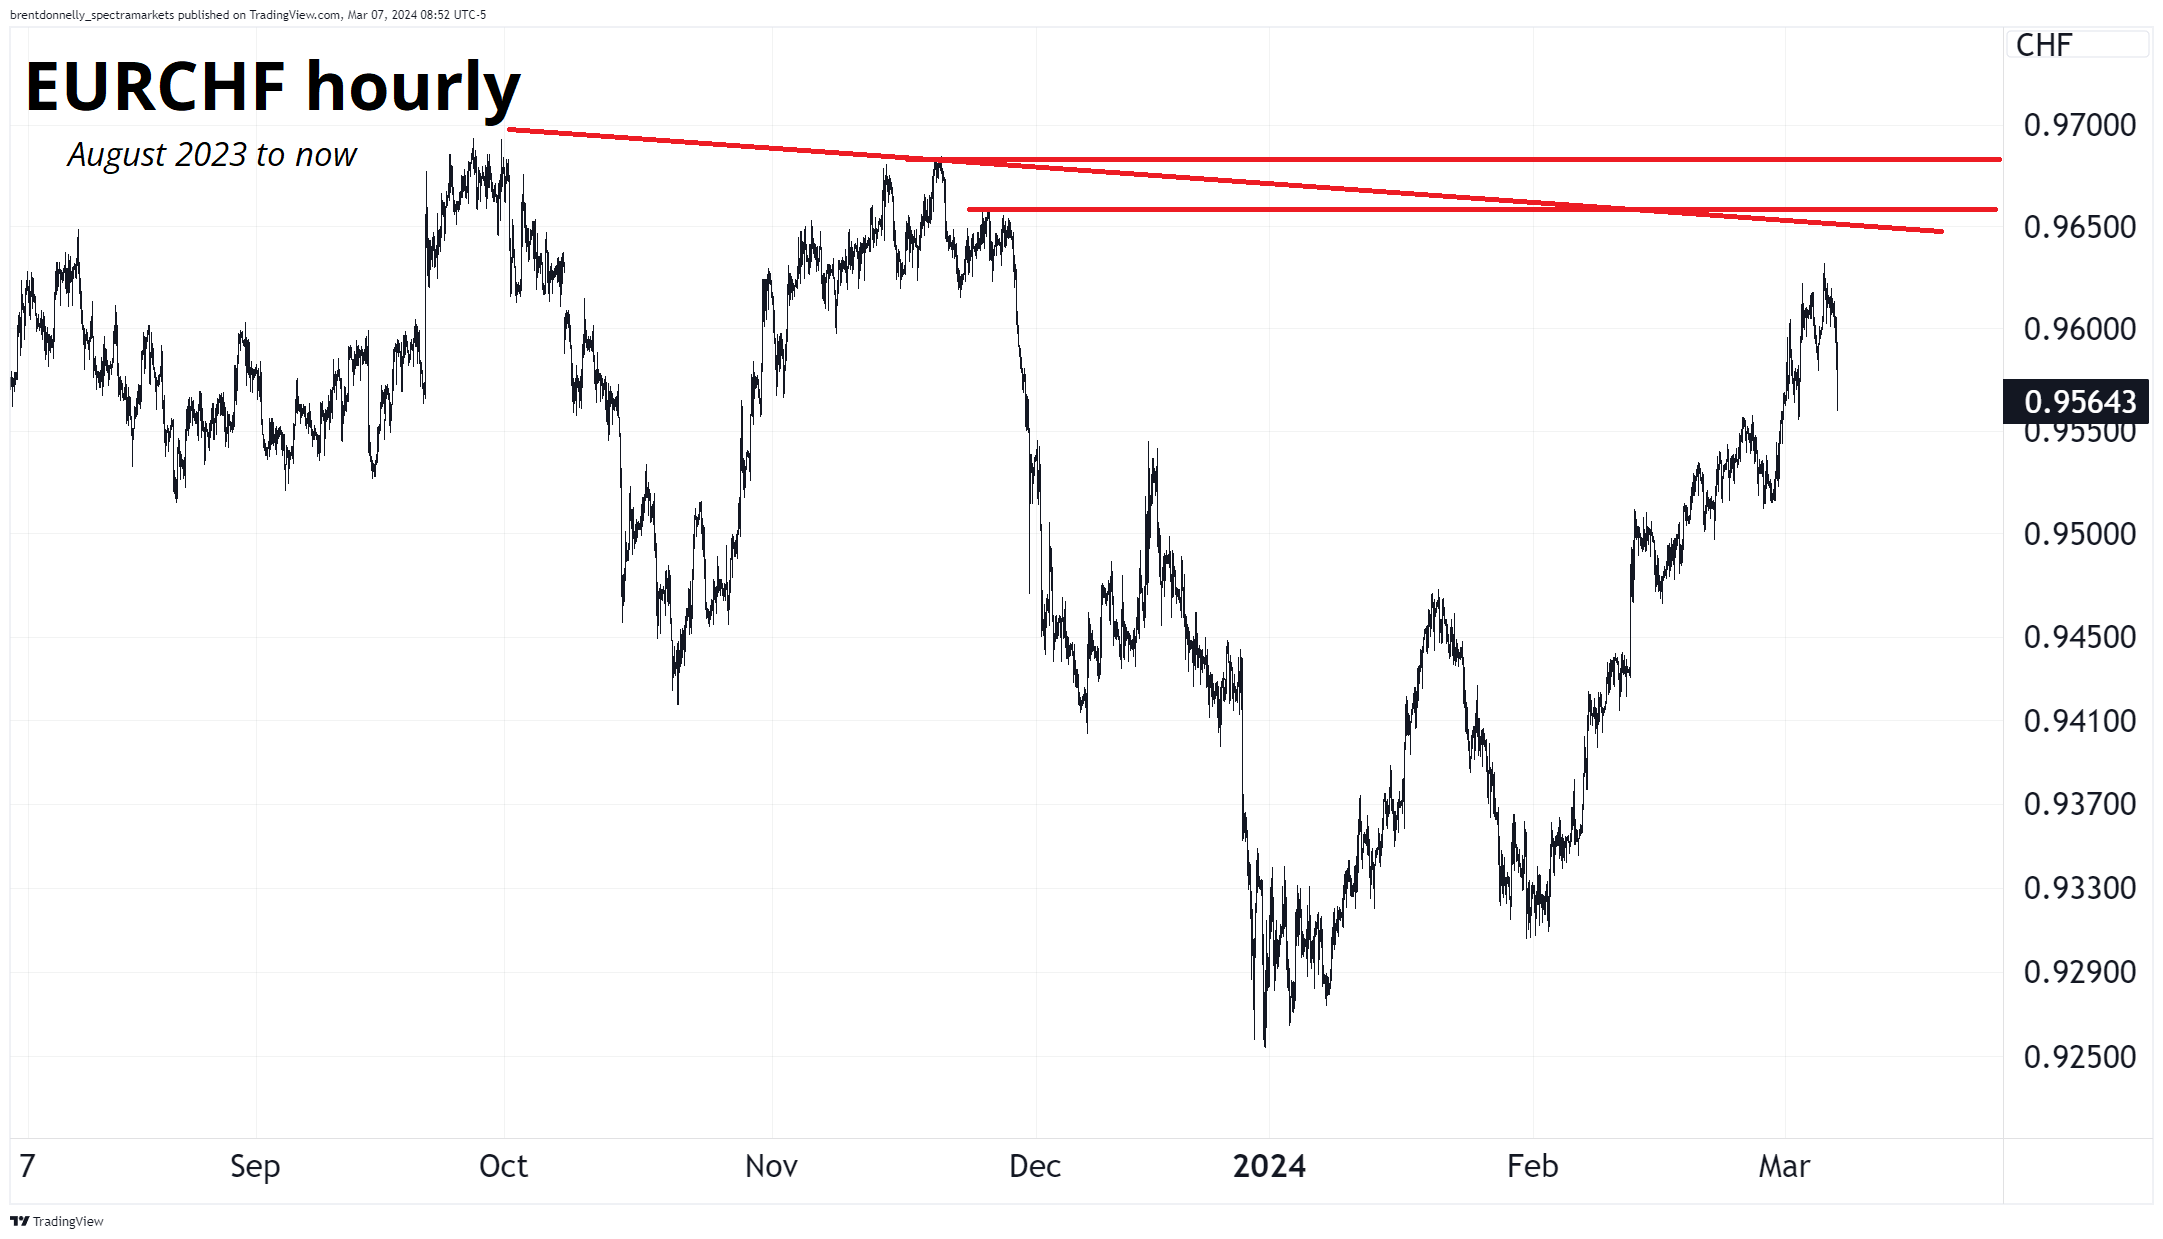
With regard to CHF, we failed well short of triple major resistance.
Final Thoughts
Things that make you go hmm.
Have a well-hydrated day.
Most of that blank area is the Sahara Desert. It’s huge.
It is almost exactly the same size as the United States.
https://www.reddit.com/r/dataisbeautiful/comments/1b6m117/population_density_of_africa_oc/
