We’re all oil traders, for now.
Hello. It’s Friday. Thanks for signing up. I’m Brent Donnelly.
The About Page for Friday Speedrun is here.

We’re all oil traders, for now.
Hello. It’s Friday. Thanks for signing up. I’m Brent Donnelly.
The About Page for Friday Speedrun is here.
Here’s what you need to know about markets and macro this week
Macro’s got the bends.
There are periods when macro is the driving force behind market moves and there are intervals, like now, when it’s more about geopolitics, headlines, risk appetite, and momentum. Nobody cares about the economy or the central banks right now because they are beholden to U.S. big government policy and AI Capex spending. No central bank in the world has much visibility on growth or inflation, and the March economic data is distorted by a month of war impacts and so we are left to wargame what Trump or the IRGC might do next. Which is hard.
There were weeks in March where you could see a big disconnect between what the market was pricing (first, too much complacency, then too much fear) but now the market is just moving onwards and upwards and it’s not super clear anymore whether the shuttering of the Strait of Hormuz even matters. It would have been ludicrous to say so in early March, but it’s starting to feel like how the U.S. economy just shrugged off 500 basis points of hikes and motored on in soft landing mode throughout 2023, 2024, and 2025.
I have discussed how this is possible: The top of K-shaped economy doesn’t care much whether it costs $82 or $102 to fill up the M8, and AI Capex monsters don’t have any issues sourcing materials so far and so sure, close the Strait. See if we care.
Earnings season has been another jamboree for AI faves like AMD and IREN and HUT and while some formerly ebullient zones of the market (like quantum) have gone quiet, the shortage of tokens remains much more important than the shortage of oil. Worries about the basis between physical crude oil and futures have so far been misplaced and we are ten weeks into the war.
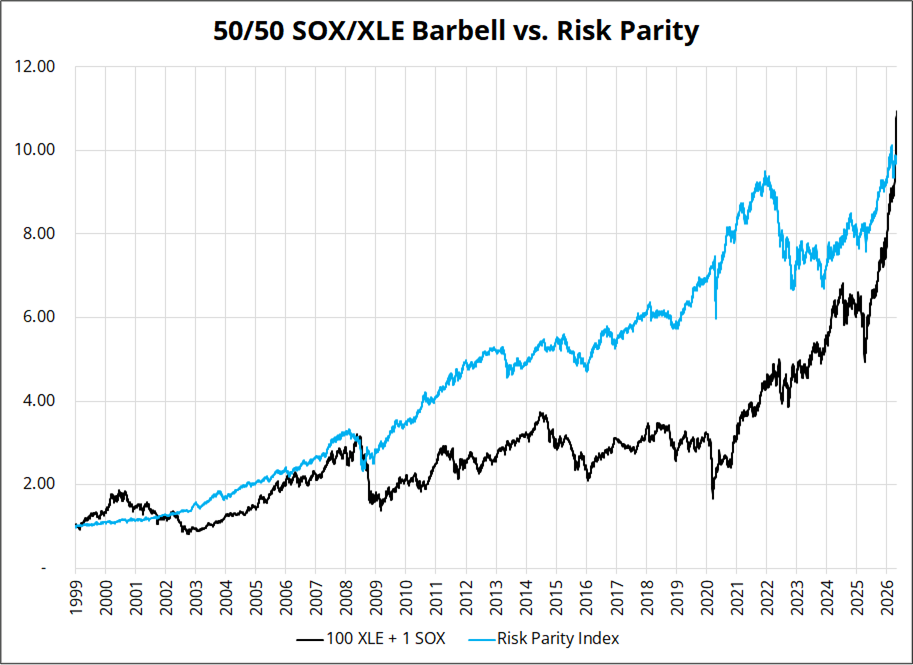
The rallies in energy stocks and in semis have led some to say that energy and semis is the new 60/40. Let me just say that when people say X is the new 60/40, the most likely response is: No, it’s not. The biggest argument against 60/40 now vs. the past 20 years is that there was a massive, unrelenting disinflationary bond market rally going on that whole period. And that’s a fair point. So I am not saying 60/40 will work for the next 20 years, but I think it takes a courageous feat of extrapolation to think that two sectors buoyed by two wars and the invention of ChatGPT in a 5-year span will continue to outperform for the next five years.
This next chart takes a simplistic approach, comparing 100*XLE + SOX to the Advanced Research Risk Parity Index (RPARTR). There are many risk parity indices; I picked this one because the data goes back to 1998. The methodology I am using here is simple, but a more complex methodology will yield similar-looking results.
I can’t help the feeling. It could blow through the ceiling.
Long-term investors don’t get rich buying the thing that just went parabolic. They usually get caught high and dry doing that. They get rich by seeing things others don’t. To quote the GOAT:
“I learned this way back in the 70s from my mentor Speros Drelles. I was a chemical analyst. When should you buy chemical companies? Traditional Wall Street is when earnings are great. Well, you don’t want to buy them when earnings are great, because what are they doing when their earnings are great? They go out and expand capacity. Three or four years later, there’s overcapacity and they’re losing money. What about when they’re losing money? Well, then they’ve stopped building capacity. So three or four years later, capacity will have shrunk and their profit margins will be way up. So, you always have to sort of imagine the world the way it’s going to be in 18 to 24 months as opposed to now. If you buy it now, you’re buying into every single fad every single moment. Whereas if you envision the future, you’re trying to imagine how that might be reflected differently in security prices.”
I am not calling a top in semis or oil. I am just saying that momentum investing has its limits. It’s not a replacement for 60/40.
By far the most boring thing I do each week is prepare the trading calendar for the week ahead. It’s a tricky thing to automate because there is considerable discretion in deciding which events matter. But I care so much about you, the reader, that I put some drops in my eyes and bang a couple of espressos and get it done. What the hell am I doing here? I don’t belong here.
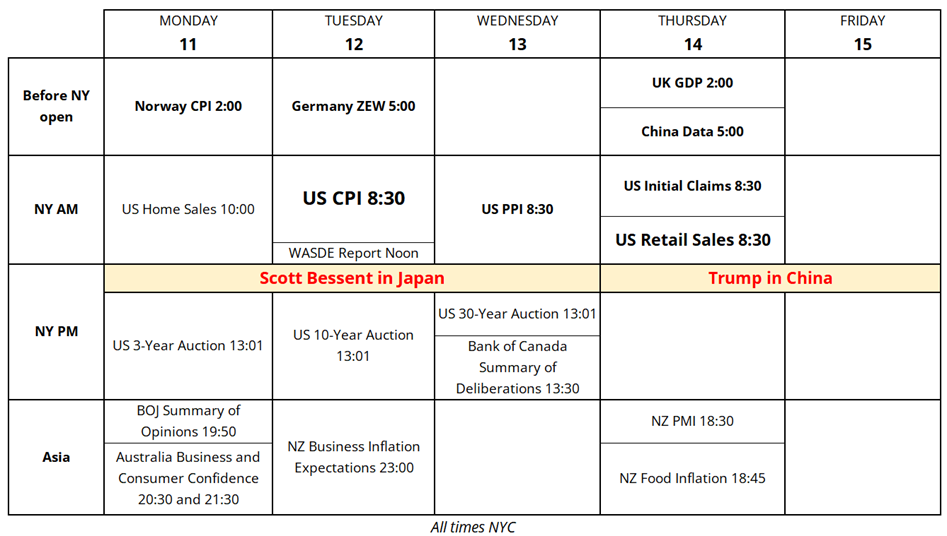
The highlights there are the state visits to Japan and China as Bessent and Takaichi talk about government intervention in the FX markets and Trump and Xi discuss trade policy.
The bears are trotting out hantavirus and El Niño updates at this point in a desperate attempt to get everyone to listen to why SPX should be below 6000 right now::::::::::::::::::::::::but it’s not working. 500bps of hikes, a full shuttering of the Strait of Hormuz, full annihilation of the SaaSosphere, and many other scary things and yet the stock market marches on. Blame deficits, or passive investing, or crazy retail call buying, or whatever you like. Or: Blame corporate profits. Maybe it’s the corporate profits?
A banger from Michael Drury:
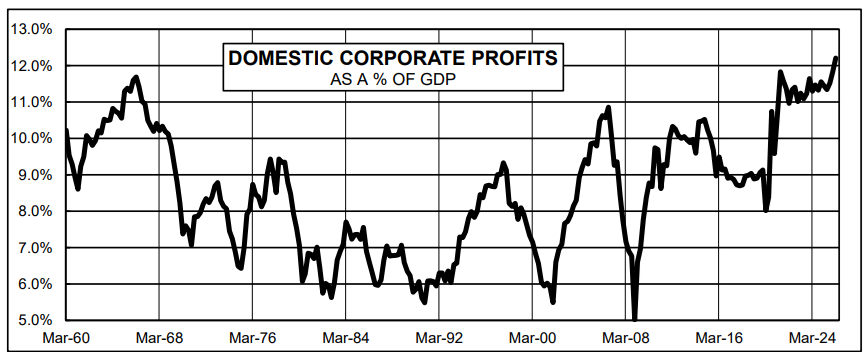
Occam’s Razor is in the house
The bears will tell me that corporate profits are mean reverting. Yes, okay, one day, but not yet. They are doing the opposite of reverting to the mean. They are mean escaping. Mean allergic. They are fleeing the mean, if you will. They are ordering a widening of the y-axis.
Anyhoo, you’ve got massive deficits, all-time high corporate profits, drunken sailors in charge of capex, a U.S. central bank that jettisoned its inflation target five years ago, and a U.S. economy that looked antifragile for a while and now looks just about indestructible.
The smart money (retail) just keeps buying calls! I saw this chart on ZH and didn’t believe it but then I went to Bloomberg and made it myself:
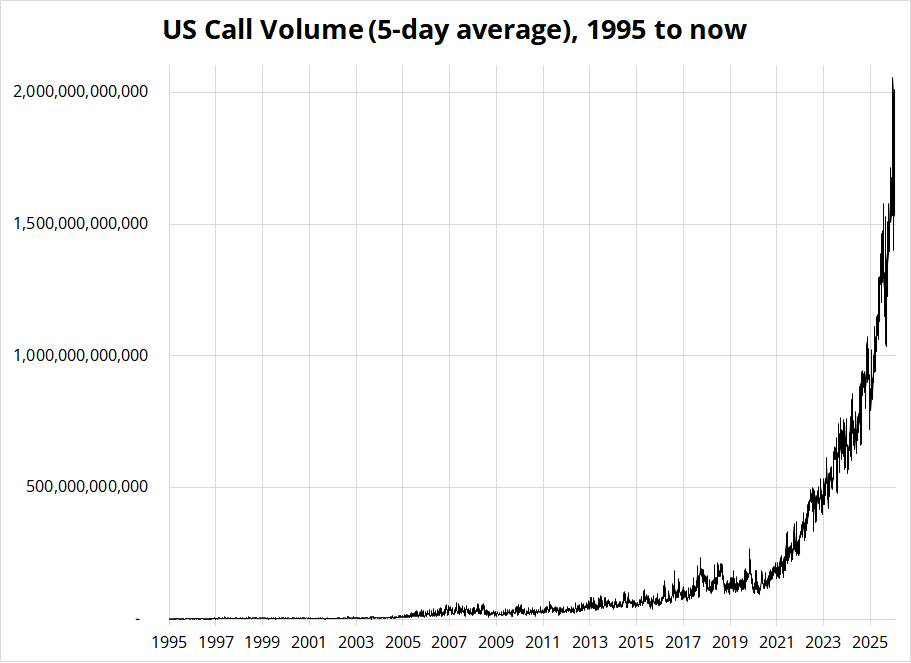
Gravity always wins, you say?
Two trillion! Some of it is shortening of duration and rising market cap overall, but even adjusting for those factors, that’s a heckuva chart. We live in a world where I would guess maybe 20% of current financial market participants have seen a real recession or true bear market and so when either one comes, it’s going to be a visceral shock.
But that could be in 2077.
Here is this week’s 14-word stock market summary (same as last week’s):
We are back in a VIX 17, new all time highs market. Trade accordingly.

https://www.spectramarkets.com/subscribe/
Interest rate madness has cooled somewhat as oil has come off the highs. There hasn’t been a lot of talk about rates in my circles of late, maybe because there is no clear narrative. Of all the products, rates love to trade macro the most and if there’s no macro narrative, there’s no rates narrative either. The narrative is: Oil up / oil down. Much like RORO, the old risk-on / risk-off moniker, Oil up / oil down has a fun acronym: OUOD. Pronounced
Ew. Odd.
It wears me out. It wears me out.
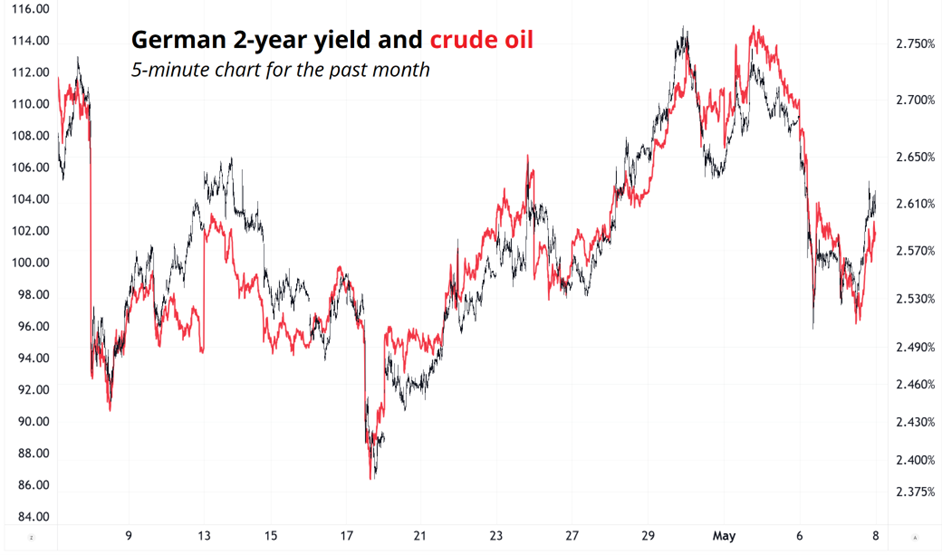
Can you spot the ECB meeting in there? Or the ECB speeches? If you are new to the market: this is a ludicrous level of synchronous movement on a 5-minute chart. This type of tick-for-tick movement usually only happens during moments of maximum scariness and risk aversion. It makes it really annoying to be a rates trader because you signed up for a job as a rates trader but have been demoted to oil trader without warning.
And you will be promoted back up to rates trading at some point, but you don’t know when that is. I am joking about the demotion thing—of course oil traders are cooler than rates traders.
The push and pull for the dollar continues as rate differentials and China and Japan FX policy are bearish USD but mega outperformance of the AI trade is bullish USD. So, that’s a tie. Some cyclical currencies like AUD and BRL are outperforming the USD, while funding type currencies like CHF and EUR are going nowhere.
Interest rate differentials are pushing down on the dollar, but U.S. tech exceptionalism and economic outperformance are supporting it. The impact of the energy market moves is hurting Europe while it helps the U.S. In fact, NG in the United States is down since the start of the war, for example. All this push and pull means the USD is just kind of fluttering around in the wind.
USDJPY is looking up at the Sword of Katayamacles but won’t fall because oil prices are still higher for longer. Ultimately, the price of oil is the primary determinant of the JPY these days, so these MOF USDJPY interventions buy some time until oil prices come back off. If oil goes to $200, the MOF is going to have a big problem, but the nature of intervention is not to turn the market instantly, it’s to stop the momentum and allow time for an organic macro reversal.
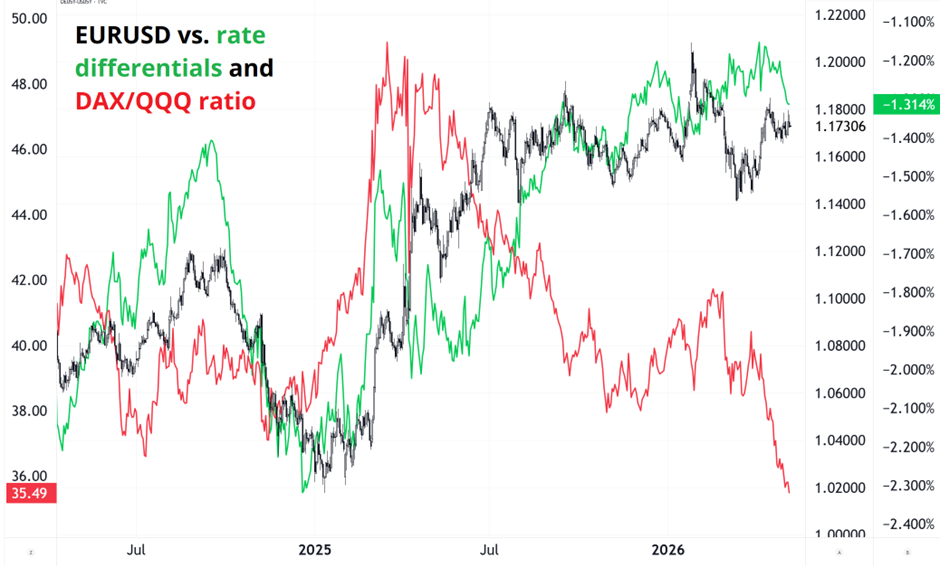
This chart does a good job of explaining why EURUSD isn’t moving. Flows into US tech are pushing the red line, the DAX/QQQ ratio, lower (bullish USD, bearish EURUSD) while rate differentials have been pointing to higher EURUSD (green line). The big upside resolution for the dollar will only come if the market starts to price the Fed blinking on rate hikes. Right now, the hike side of the Fed distribution is truncated, but it’s possible (though improbable) they will find religion on the inflation target one day and start signalling hikes.
Tuesday Japan time is by far the highest headline risk for JPY. Bessent arrives Monday and the meetings that day are prep/low level. Main meetings are all Tuesday. He leaves Wednesday for Beijing. My guess would be readouts would come Tuesday afternoon Japan time, or very late Monday night/very early Tuesday morning NY time.
I am unable to get excited about Trump/Xi.
Xi to Trump: “You do it to yourself. You do. And that’s what really hurts. Is you do it to yourself, just you. You and no one else.”
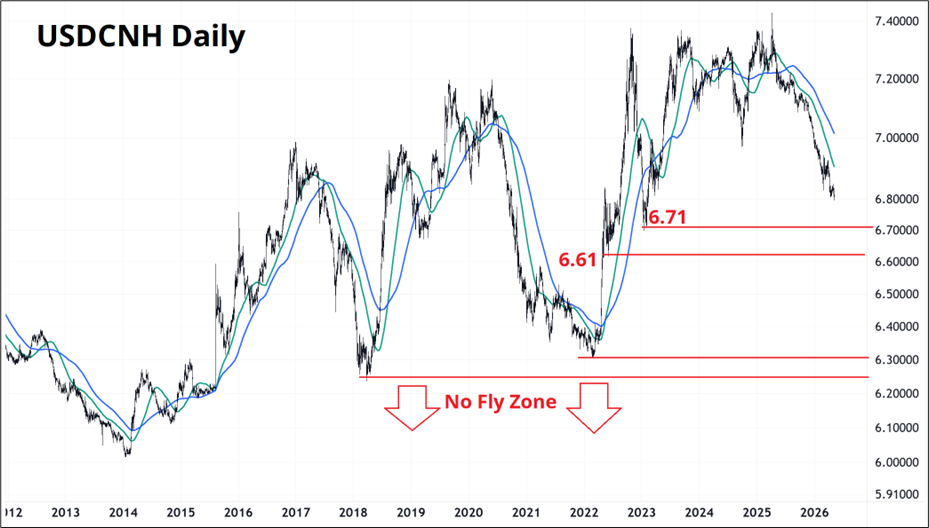
And finally: New multi-year lows for USDCNH (sub 6.80). Massive support and take profit zone is 6.61/6.71.
I would like to get a finger on the pulse of crypto. I realize the results will be somewhat biased by my TradFi audience, but let’s see.
Please complete this super fast 45-second survey
Bitcoin is grinding higher and ETH is reluctantly along for the ride while HYPE is range trading $40/$45. The CLARITY Act’s stablecoin yield language got finalized this week. Tillis and Alsobrooks landed on a compromise that bans rewards “economically or functionally equivalent” to deposit interest but allows balances to be used for activity-based rewards that can clear that test. Passive yield is out, activity-linked rewards stay in. Markup is targeted for the week of May 11, Senate floor in June or July, and Trump’s desk by summer. Perhaps the biggest takeaway here is that Alsobrooks is a real last name. The surname Alsobrooks is of English, specifically locational or habitation, origin, dating back to the medieval period. It is a variant of “Alsobrook” with an added “s,” and is thought to mean “one who dwelled at the old brook” or a similar geographical feature, likely derived from the Old English eald (“old”) and broc (“brook/stream”).

Five year lookback on crypto:
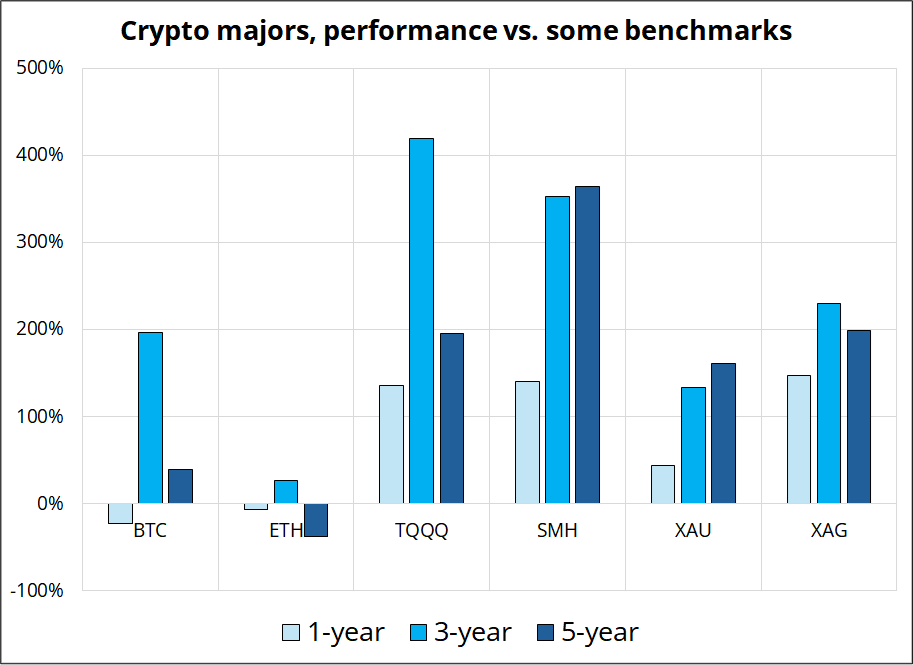
Hmm.
So far, so good for The Economist.
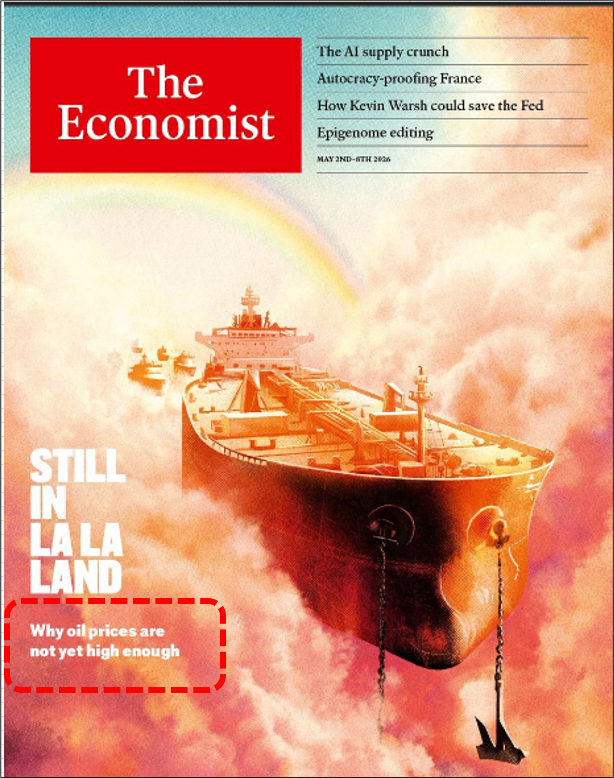
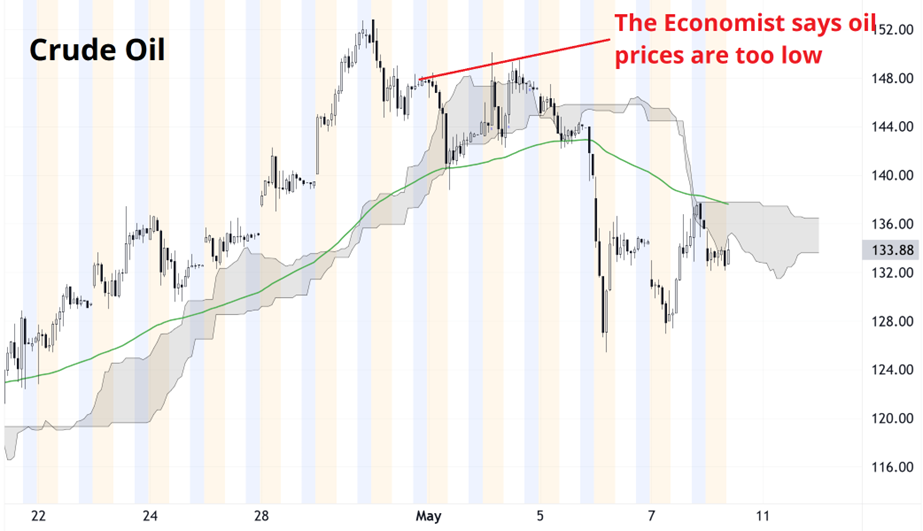
Let’s see how it goes! Will the oil rally fade out again?
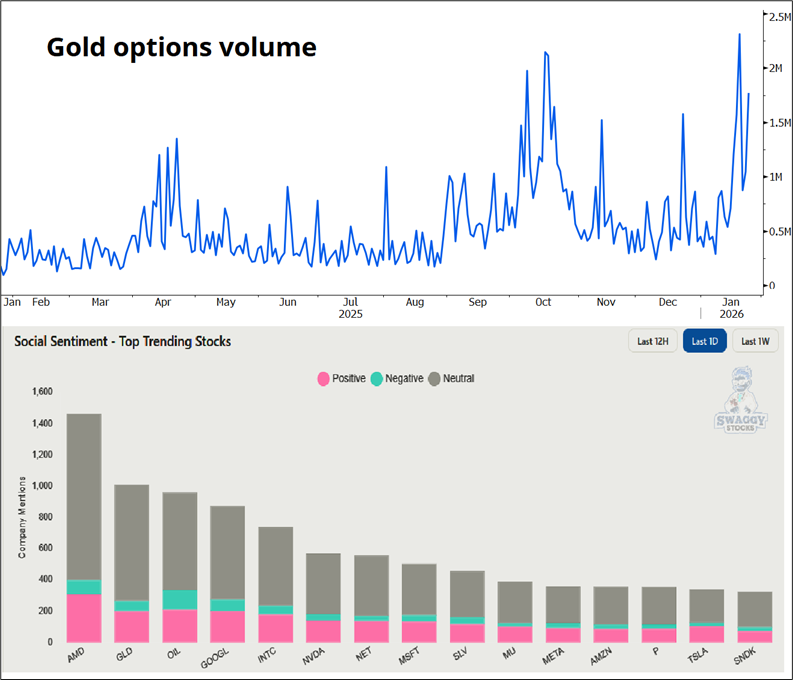
Gold is becoming more interesting to me as the market has forgotten about it somewhat, and the “nothing stops this train” of higher deficits, good nominal growth, and flat or lower policy rates in the United States remains valid. Retail remains involved in gold to a degree that still makes me uncomfortable, but the two blowoff bottoms probably suggest that some of the paper hands have been purged.
Below you can see that GLD options volume is still high, and the r/wallstreetbets crew are still bullish GLD, but I don’t think it’s super worrisome given the price shows no sign of exuberance whatsoever.
The chart is forming a huge triangle, and the 200-day has held since 2023, so a move below 4300 means my bullish idea is wrong and something major has changed. Whatever your time horizon, a stop loss of 4250 looks correct, while you could either buy here as a big picture person who doesn’t care about entries, or you could try to buy at 4580. The big picture person can target 6000 while the more nimble look for a retest of 5400.
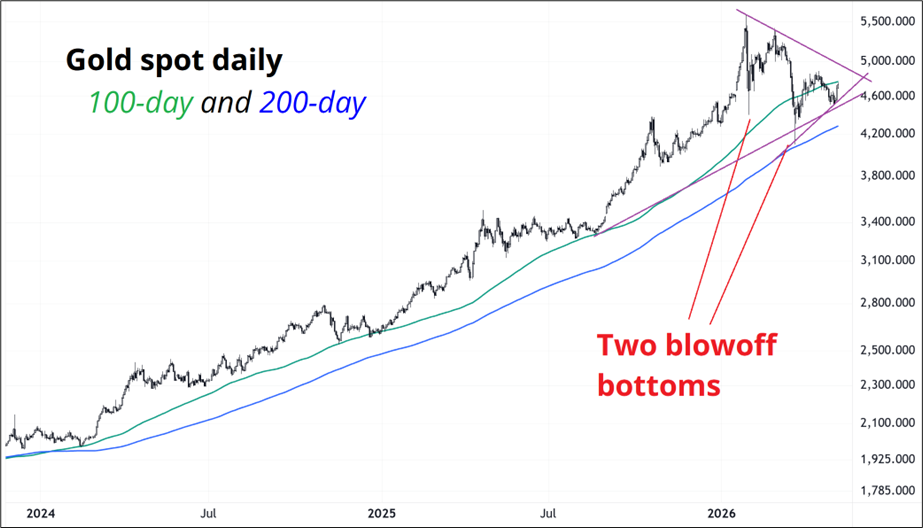
A recapture of the 100-day would start a bullish process that should resolve the triangle break and take us back toward the 5350/5580 failure zone.
That’s it for this week.
Get rich or have fun trying.
*************
The Economics of Intelligence by Citadel Securities
*************
A painting of Vesuvius by a guy that saw it blow up. Seems cheap?
*************
If you like this comic, check out the book “Understanding Comics” by Scott McLoud. It’s one of my favorite books of all time.
*************
AI isn’t coming for your job; it’s coming for your mind.
*************
The song I have asked my wife to play at my funeral.
*************
Thanks for reading the Friday Speedrun! Sign up for free to receive our global macro wrap-up every week.
