Thinking about Sahm’s Rule had me wondering whether you could copy her methodology but use Initial Claims instead of the UR to get an indicator with lower latency. It seems like you can.

This 1977 short film is a good use of nine minutes.

Thinking about Sahm’s Rule had me wondering whether you could copy her methodology but use Initial Claims instead of the UR to get an indicator with lower latency. It seems like you can.

This 1977 short film is a good use of nine minutes.
Short CADJPY at 108.90
Stop loss 110.26
Long 10DEC EURMXN
18.70/18.20 put spread
~50bps EUR
off 19.16 spot
November 9, 2023
The Sahm Rule Recession Indicator signals the start of a recession when the three-month moving average of the national unemployment rate (U3) rises by 0.50 percentage points or more relative to its low during the previous 12 months. It was originally crafted by Claudia Sahm as a rule that would help policymakers deliver timely fiscal stimulus instead of waiting for the lagged NBER recession call.
For more, see Chapter 3 of this summary of the book: Recession Ready. The Sahm Rule has an excellent track record and no issue with false positives. You can see it on Fred right here. By its nature, it is fitted to past data, but it worked out of sample in 2020. The choice of 0.50 is fitted to past data and readings of 0.4 have appeared in the past without a recession.
The indicator is currently at 0.33 and if next month’s UR is 3.9 or higher, it will trigger a recession signal. It’s a great rule because it’s simple, easy to understand, unambiguous, and logical. It is a simple measure of the rate of change of the US labor market and rates of change are all that matter because there is so much underlying momentum and/or inertia in the economy.
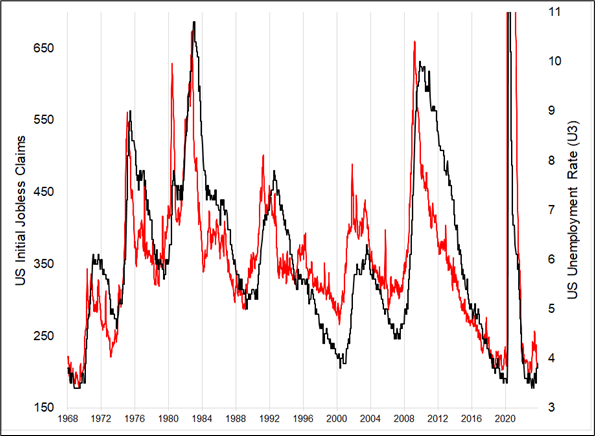
I have always been surprised at how expert economists use the Unemployment Rate to gauge the strength of the US jobs market when we have Initial Claims, a series that reacts faster to changes in the economy than the UR and comes out weekly instead of monthly. You can see in this chart how the red line (Claims) moves earlier and faster than the UR most of the time. At its worst, it moves at exactly the same time as the UR.
Thinking about Sahm’s Rule had me wondering whether you could copy her methodology but use Initial Claims instead of the UR to get an indicator with lower latency. It seems like you can.
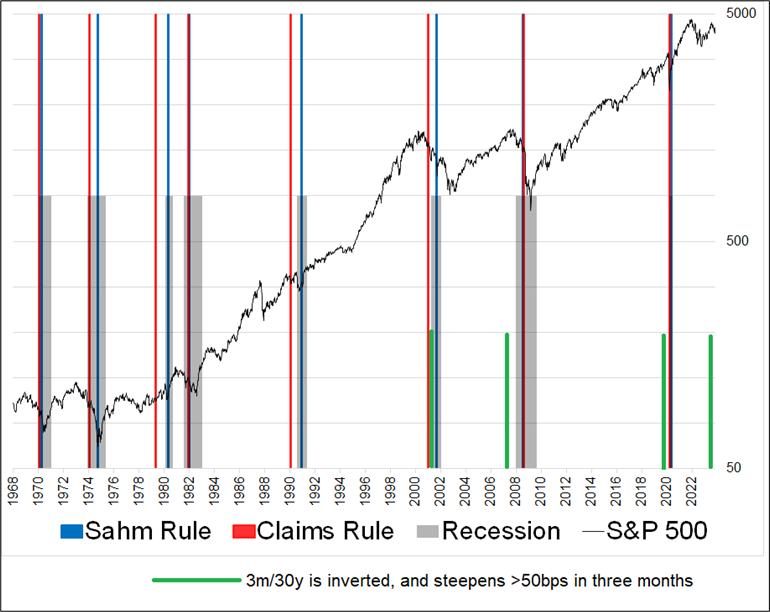
The chart that follows shows blue lines for the Sahm Rule trigger, and red lines for a similar rule using Initial Claims. The gray bars are recession, and I threw in steepenings during inversion because that’s another well-known recession timing indicator. These sorts of things are much more useful than the inverted yield curve signal because simple inversion of a yield curve does not offer timely predictions of recession and thus is not useful to people taking risk in capital markets.
The modified rule, using Initial Claims is as follows:
If 4-week average of Initial Claims is >30% above lowest weekly reading in the past 12 months, the signal triggers.
You can see that the red lines tend to ring the bell earlier than the blue lines, or (like 2008 and 2020) they both ring at the same time. The steepenings are even better but the sample size is small.
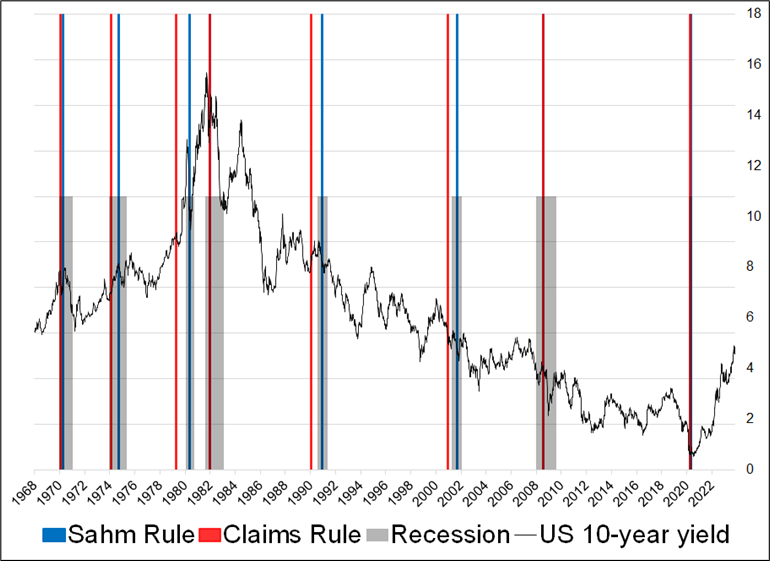
I put the SPX on there because that helps me think about whether an earlier signal is actually useful in the real world. In 2001, it was. Same thing in 1970 and 1974. The recessions of 1980 and 1982 didn’t really hit stocks much, nor did the one in the early 1990s, so the timing was kind of irrelevant. I will show the same chart with bond yields on the next page to offer some different takeaways.
Overall, there are a few takeaways here:
I showed this piece to Claudia, and she said that she agrees with the point I’m making on Initial Claims, but she said in designing the Sahm Rule, she wanted something that triggered in a recession, not something that forecasts a recession. So it makes sense she chose the UR, not Claims.
May the awesomeness of your day increase by many powers of 10.