Two corrections and a bunch of new thoughts on yesterday’s piece.

Russian artist Helga Stentzel makes photographic art using hung laundry.


Two corrections and a bunch of new thoughts on yesterday’s piece.

Russian artist Helga Stentzel makes photographic art using hung laundry.
Short CADJPY at 108.90
Stop loss 110.26
Long 10DEC EURMXN
18.70/18.20 put spread
~50bps EUR
off 19.16 spot
November 10, 2023
I made two errors in my piece yesterday. Thank you to those who responded pointing them out. Sometimes people say “sorry for being nitpicky” etc. but I want you to tell me when I’m wrong so that I can be less wrong! One of the benefits of sending thoughts every day is the useful crowdsourced feedback.
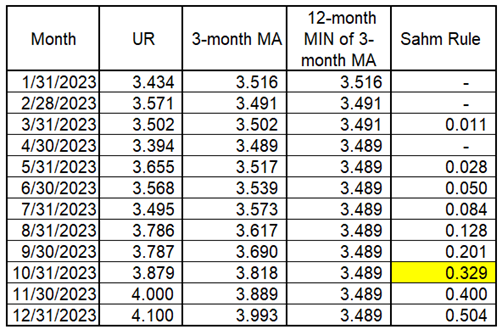
The Sahm Rule is as follows:
3-month moving average of unemployment rate minus MIN(12-month lookback at the 3-month moving average).
I was using the 3-month MA minus the low of the UR instead of the low of the 3-month MA. As such, here’s how we might trigger the Sahm Rule this year. We would need 4.0 and 4.1 in November and December to get above 0.5. This table shows all the data using actual reported, unrounded UR figures.
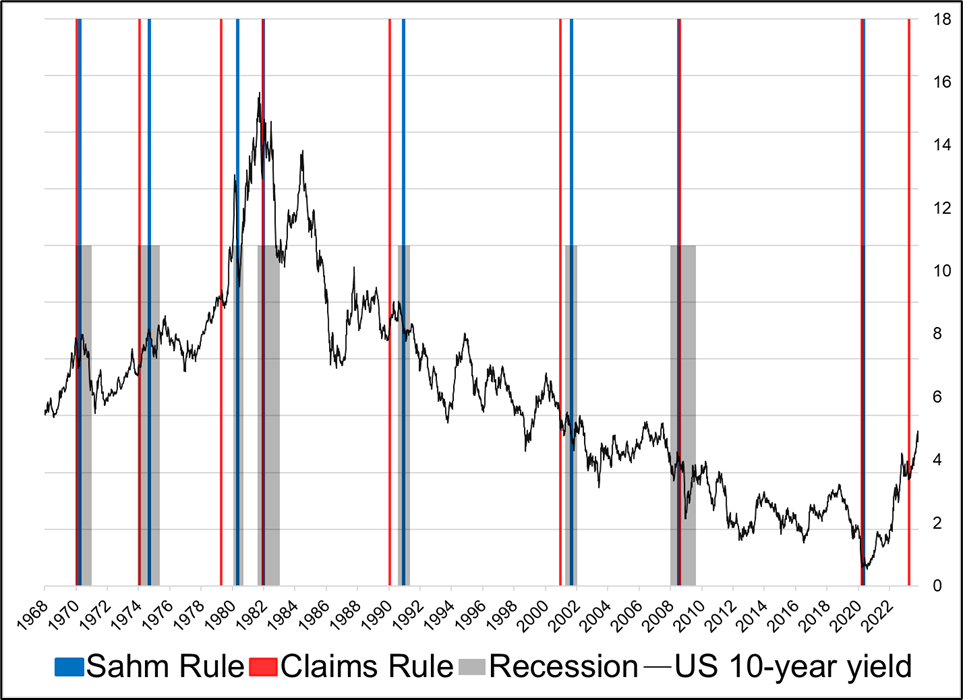
The second error I made was that in order to eliminate duplicates, my spreadsheet ignores repeated signals in my Claims Rule by looking back three years and ignoring any repeat signals. This is fine in the normal cadence of economic cycles, but because we had a whole cycle in 2020 and a new cycle in 2023, I didn’t show the triggering of the Claims Rule in April/June 2023. This is an important mistake. As such, the chart should look like the one below. It’s the same as the one I showed yesterday, but with a new red line in Q2 of 2023. Given prior lags, that would put us in recession right about… Now. Hmm.
It is also worth noting, though, that many readers including Macro Alf have pointed out that if the current story is one of labor market supply returning after exiting due to COVID, you might get a situation where the supply of labor is plentiful, but firings and layoffs remain low so the UR would shoot up but Initial Claims would remain low. The current mix of rising UR and Initial Claims flatlining at the lows is consistent with that theory, but let’s see what happens. This Bloomberg Opinion piece by Claudia Sahm makes a similar point and it’s worth reading. It’s pretty cool that Claudia is willing to say the Rule that made her a household name among ecowonks might not work this cycle. Would be easier to just ignore the new evidence and pound the table on your namesake.
For a nice view of the Claims Rule, you can just plot it against the recessions. For good order, the Claims Rule is:
4-week moving average of Initial Claims minus 12-month MIN(Initial Claims)
divided by
12-month MIN(Initial Claims)
Or in plain English: The current run rate vs. the 1-year low.
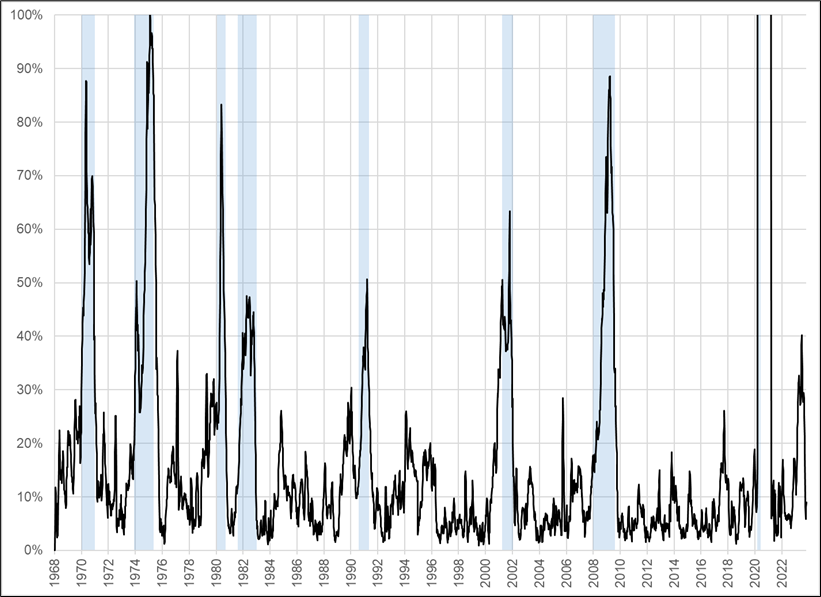
At the moment, the signal in Q2 2023 looks like a false positive similar to the one before the 1995 soft landing. That said, as much as the recession forecasting industry has been waiting for Godot, 2024 looks precarious to say the least as the financial conditions vise continues to tighten.
If you only read the emails and macro commentary from the last 24 hours you would think that bond yields are ripping to the moon after the Worst Bond Auction Ever®. In reality, the chart of the US 30-year yield looks like this:
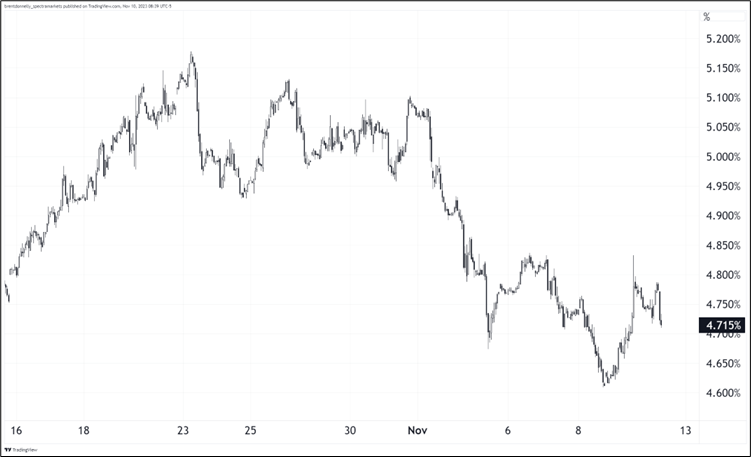
So while the auction obviously shows us that the supply absorption story remains important, the strong signal from the Fed and US Treasury that took yields down here in the first place remains valid. Now they just need to pray for more soft economic data. CPI and Retail Sales next week.
John Williams (NY Fed) made a kind of humorous / glib speech yesterday and this excerpt got me thinking…
From the perspective of monetary policy, 1993 seems like a world away. Back then, the Fed’s balance sheet totaled about $400 billion. Now? It’s nearly $8 trillion.
So many things we take for granted weren’t even a “thing” back then. There were no FOMC statements . . . no press conferences . . . no dot plots . . . no longer-run forecasts in the SEP . . . no policy rules, optimal control, or flexible inflation targeting. In fact, there was no inflation target at all!
There was no QE or QT, no LSAPs . . . no forward guidance, Odyssean or Delphic . . . no ZLB, ELB, or shadow rates . . . no ample or abundant reserves . . . no IORB, ON RRP, or SOFR . . . no DSGE, EDO, or SIGMA . . . no FRB/US model . . . and, most shocking of all, no r-star!
He closes the speech by saying there will be even more tools and information added to the toolkit in the future and this is unambiguously a good thing. Meanwhile, there were 18 public speeches by Fed officials this week. But it’s pretty well known that more information does not lead to better decisions. This paragraph from that Farnham Street link in the last sentence is perfect.
One of the reasons we make worse decisions with more information is that we pursue information that appears relevant but isn’t. The harder the information is to find—that is, the more work we have to do to find it and the more exclusive is it—the more psychology tells us that we’ll put too much value on that information. In part, this happens because of our bias toward commitment and consistency; we’ve spent time and effort seeking out that information, so mentally, we feel obliged to use it. This nudges us toward decisions we otherwise wouldn’t have made.
The Fed feels obliged to use the models and research and variables and policies because they’ve put so much work into them and have so many PhDs on the payroll. But every economic regime is different and the research and models from one regime are not transferable to the next. One could argue that a simpler discretionary framework might be harder to justify, but better in practice. Also, when you produce so much research, tons of it is conflicting and so you are using five GPS systems that are all suggesting a different route.
For example, Powell often looks at inflation expectation because there is Fed research telling him to do so. But there’s also Fed research saying don’t.
https://www.federalreserve.gov/econres/feds/files/2021062pap.pdf
Or the way they used the Phillips Curve sometimes but not others because the research is mixed. Purely discretionary monetary policy probably isn’t the answer, either, but the big takeaway for me from Nate Silver’s book “The Signal and the Noise” was that overreliance on models vs. simple discretionary common sense / logic from smart people is one of the big failings in many organizations.
A radical simplification of Fed policy along with a dramatic reduction in communication would probably streamline the whole thing and lead to similar if not better outcomes. Forward guidance in particular seemed to trap the central banks in their priors. The Fed still buying MBS in 2022 is a good example of that. Any commonsense judgment would have overridden that policy.
Anyway, that Williams speech just got me thinking.
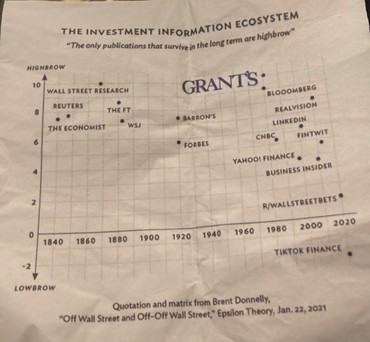
I went to Jim Grant’s 40th anniversary party this week and he used one of my graphics on the cocktail napkins. That’s pretty cool! I was reading him in 1995 when I started in finance!
This tweet gives a quick a rundown on the party.
Have a superb weekend.