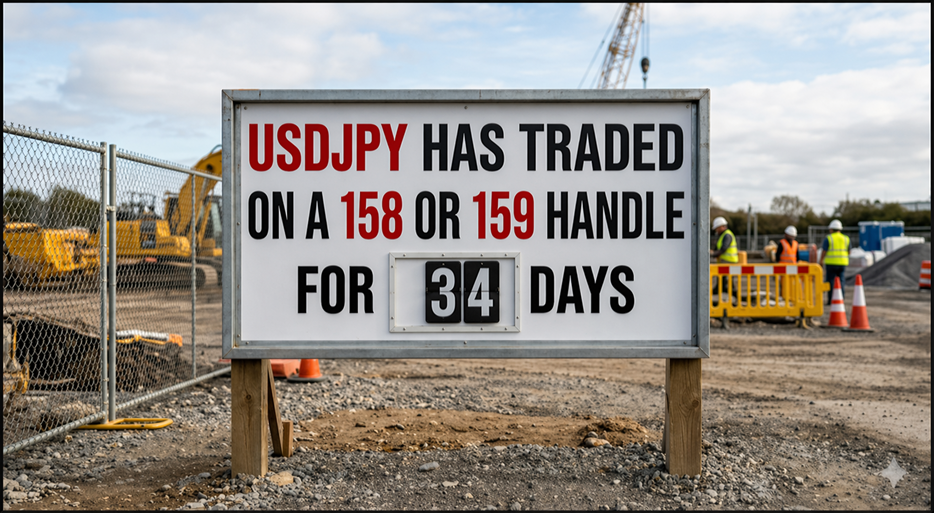
War, earnings, and KRW
In a room of 100 people, 99% are women.
How many women have to leave the room to bring that percentage down to exactly 98%?
HT SkD

War, earnings, and KRW

In a room of 100 people, 99% are women.
How many women have to leave the room to bring that percentage down to exactly 98%?
HT SkD
Short USDCHF vol expiring 30APR
Sell put spread: 0.7800/0.7780
Sell call spread: 0.7860/0.7880
Risk 1 to make 1.1
I suppose it’s easy to say “the market doesn’t care about the war” but really that is an argument that applies mostly to stocks. AI Capex, tech earnings, and unstoppable big government deficits in the United States are unlikely to be affected by $95 oil and therefore it’s easier to argue that stocks don’t care. Obviously oil and rates markets care, and FX is somewhere in between. So, the vol-adjusted hierarchy for trading war news is something like:
Oil, front end rates, mid-curve and back end rates, G10 FX, EMFX, other commodities, equities, crypto. That said, there’s quite a lot of nuance within the asset classes as (for example) BRL is up and ZAR is down since the war started. Tech is up but names like XHB, HD, and JNJ have been smoked. And FX beta, which was high at the start of the war, is lower now because the USD shorts have all been wiped out.
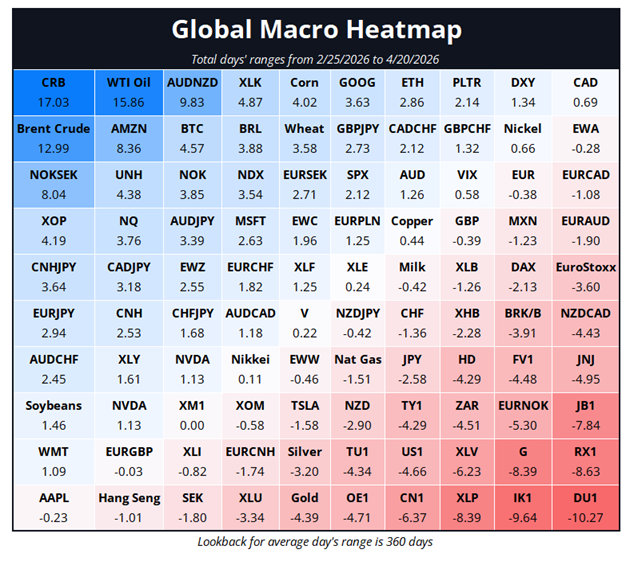
For whatever reason, the market’s kneejerk is to sell stocks on bad war news, even though the Strait of Hormuz has been closed for weeks in what was supposedly a worst-case scenario and the stock market is making new all-time highs. If you’re going to trade war headlines, trade front end rates or maybe oil. Not NQ futures.
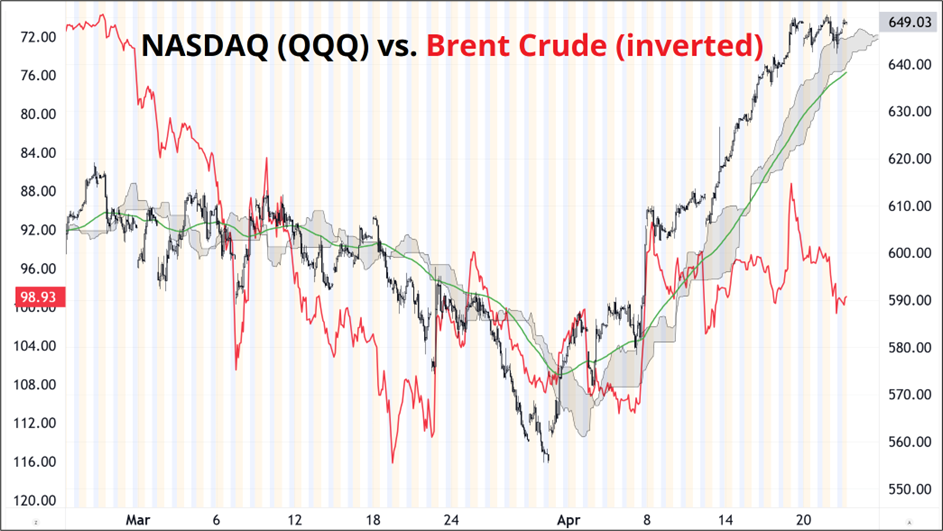
While that grid above gives a snapshot of the overall war reaction, I wanted to drill down and see how the reactions are evolving over time. Here is NASDAQ vs. inverted Brent Crude, for example, putting up an excellent example of why correlation can be misleading. The two products are moving inversely with a correlation still near 50%, but while oil has stayed higher for longer, the asymmetric reactions in NASDAQ place it near the all-time high despite bubbling crude. When oil goes up, NASDAQ sells off small/medium and when oil goes down, NASDAQ explodes higher. This asymmetry allows the correlation to remain intact even as tech bears are first bored, then gored.
In contrast, something like Schatz (German 2-year) has remained tightly linked to the price of oil.
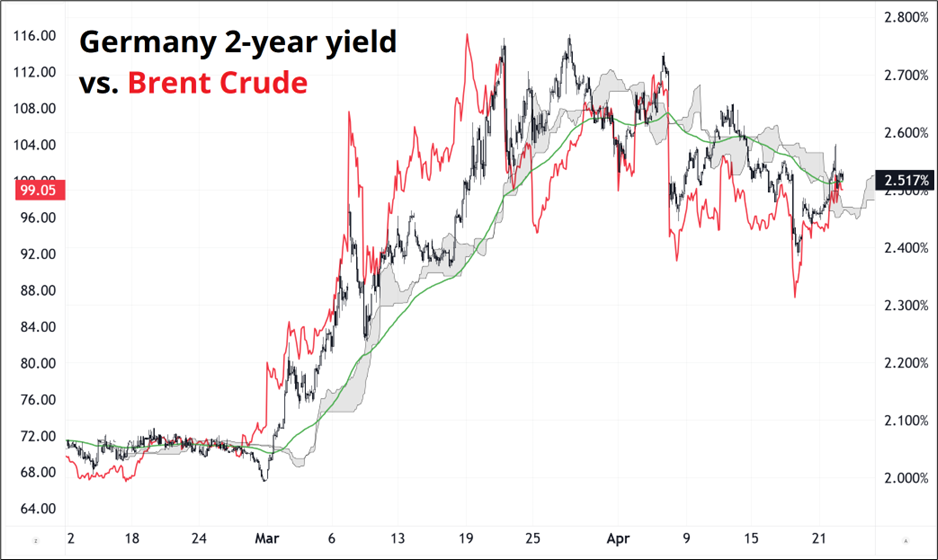
As is often the case, this is about transmission. If higher yields are going to lead to a tighter policy bias from the ECB, but will have no impact on tech earnings… These charts make sense. The question then becomes: “At what level of crude oil do economic growth and financial conditions change enough to matter for the stock market?” My guess would be an attack on the highs in Brent crude ($120) would do the trick. That’s a long way away.
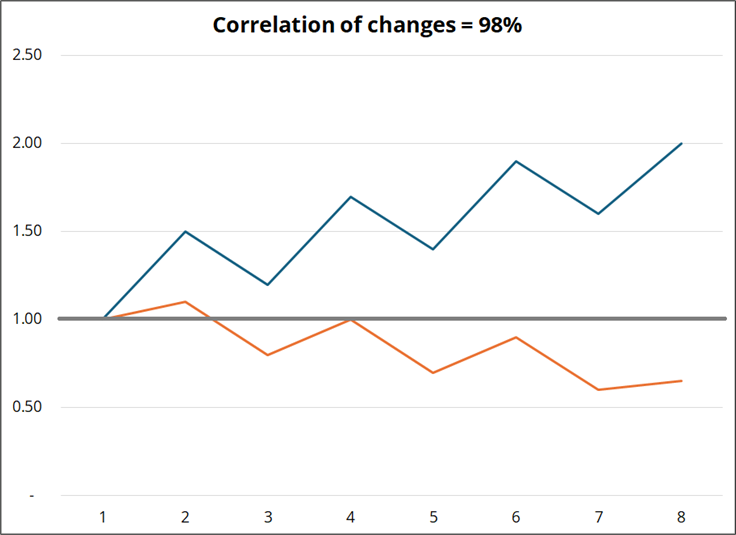
The idea of strong correlations that hold, even while two securities diverge is dear to my heart and with every passing year I feel more and more that correlation data is closer to useless than useful. It too frequently whiffs on the nonlinear relationships that govern financial markets.
There is asymmetry, convexity, and all sorts of nonlinearity in intermarket relationships and a huge correlation grid sucks out all that and just spits out a basic linear description. Useful as a bare bones starting point, but that’s about it. Buying something because a correlated thing is going up only works if you have a deeper knowledge of the real mechanics behind the relationship.
Two things can be 98% correlated and one can go up while the other goes down.
In my new book[1], I have a chapter on how I use LLMs to trade. I wish I had added this as an example, because I think these metrics are pretty cool. Polymarket now runs markets for “Will XYZ company beat earnings?” and the prices offer a good sense of which companies sandbag and which do not. This can be helpful for trading the earnings aftermath in stocks , especially those where you’re not an expert.
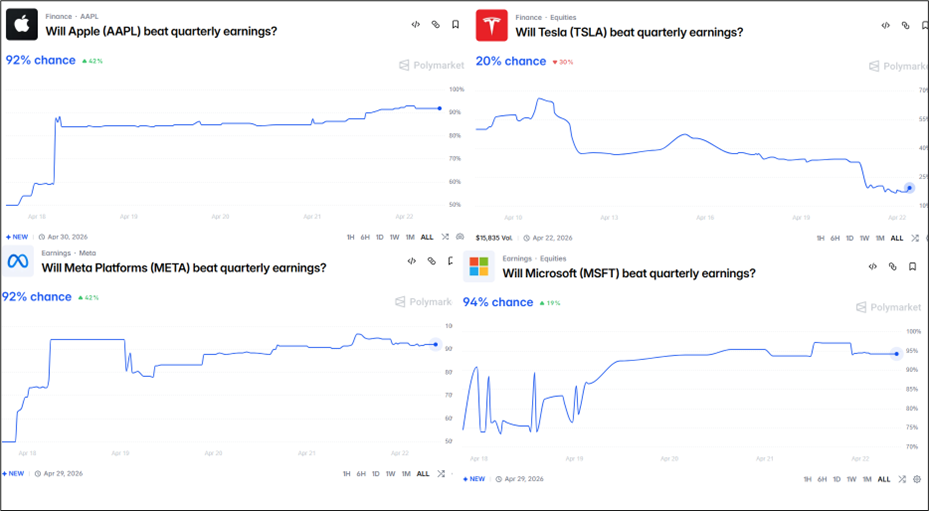
As you might expect, most companies trade around 90% because analysts receive guidance. Silly game. But there are some markets trading well below 90% (like TSLA) and that is good to know!
https://polymarket.com/predictions/earnings
Simon Flint, Spectra’s EMFX strategist, is bearish USDKRW. Here are his thoughts:
I bought a 2mth 1420 USDKRW Digi Put at ~15% mid (~16% offer)
Rationale
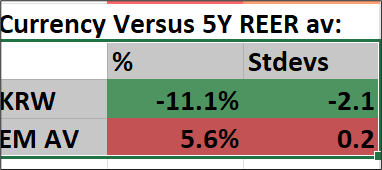
….NEER appreciation generally follows <-2 sdtevs undervaluation

Numbers are z-score of fwd return. OBS: observations.
Risks
Like a repeating David Letterman joke, this will get less funny at first, then much funnier later.
Have a pleasing day.
—
[1] Release date will hopefully be May 22, which happens to be the fifth anniversary of the release of Alpha Trader.
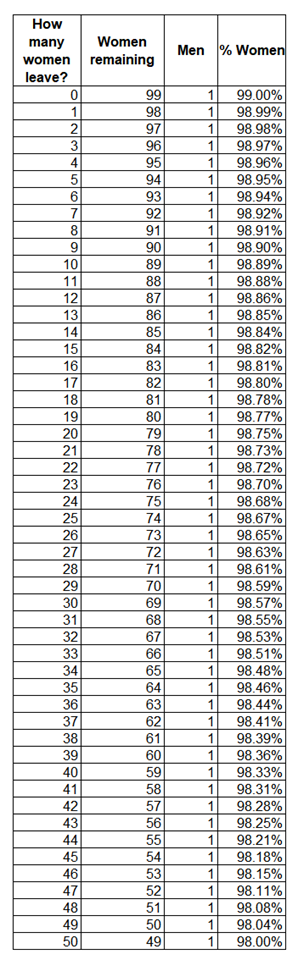
50 women must leave to get to 98% women.
